Charts: Trading View
US Dollar Index (Daily Timeframe):
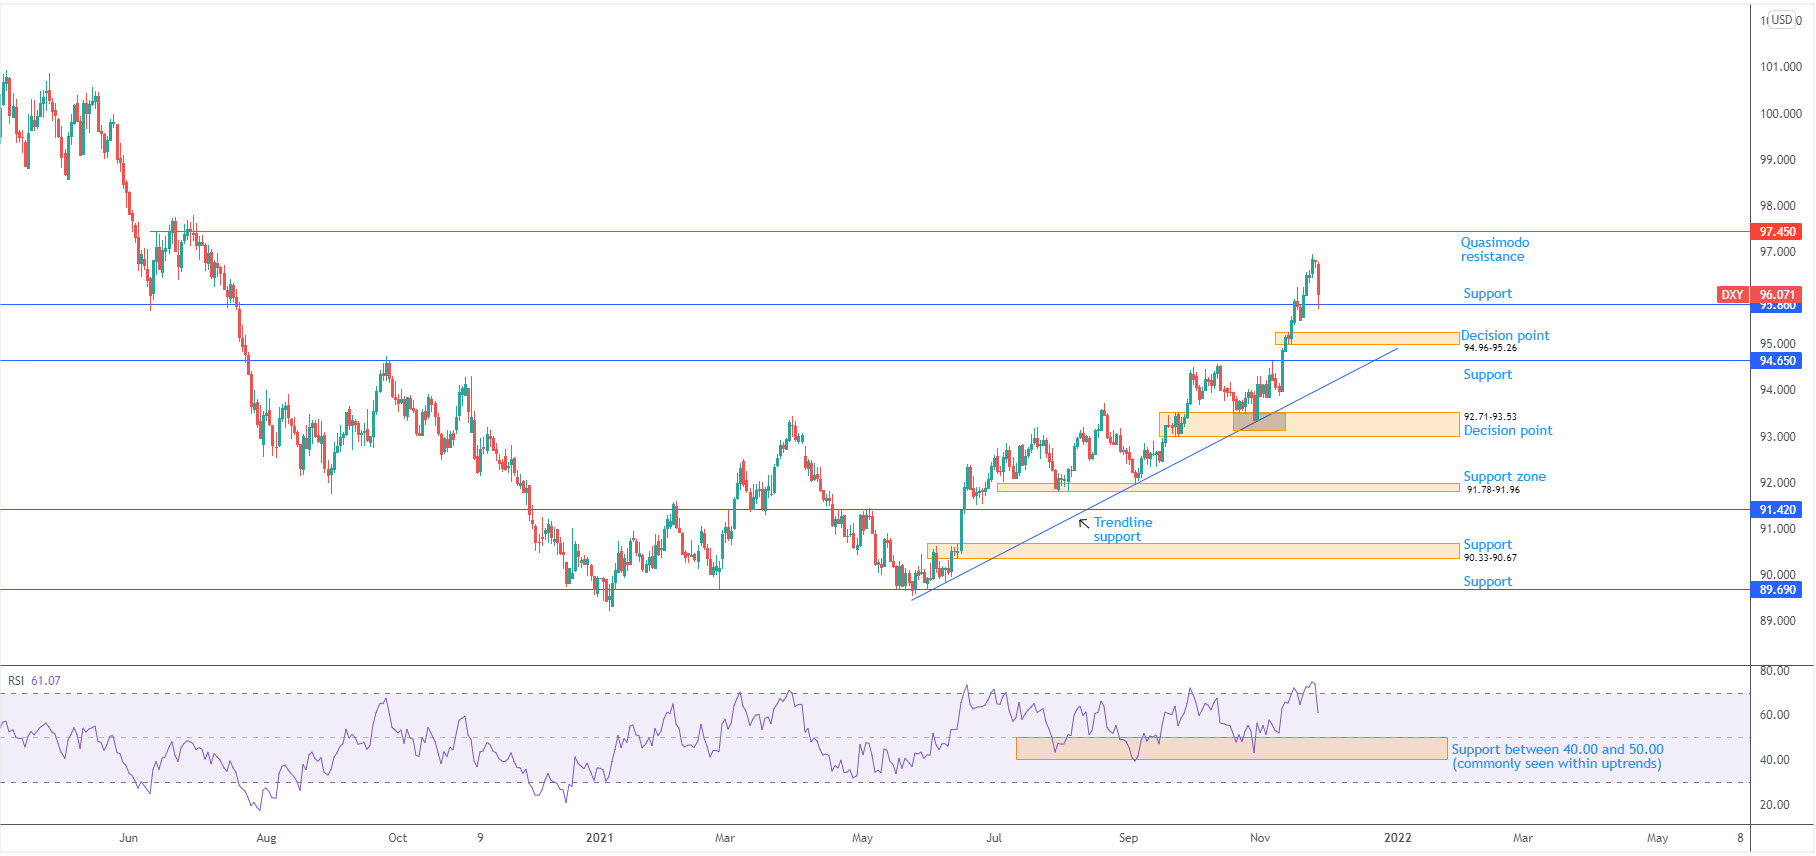
The US dollar, according to the US dollar index, concluded the week considerably off best levels to finish unchanged.
Although refreshing 2021 tops at 96.94, the weekly timeframe shaped a shooting star candlestick configuration (bearish signal), confirmed by the relative strength index (RSI) shaking hands with overbought territory.
Leaving Quasimodo resistance at 97.45 unchallenged, Friday decorated the daily timeframe with a near-full-bodied bearish candle and tested long-term support from 95.86. Additional areas to be mindful of this week are the decision point at 94.96-95.26, closely shadowed by trendline support, extended from the low 89.84, and support from 94.65.
Out of the relative strength index (RSI) on the daily timeframe, the indicator’s value exited overbought territory: demonstrating upside momentum is losing steam (average losses beginning to exceed average gains). Continued downside reveals familiar support between 40.00 and 50.00—a common area of support established within trending environments.
In terms of trend, the weekly timeframe shows an overall indecisive market since 2015, ranging between 103.82 and 88.25. The daily timeframe, however, has displayed an upside bias, established through a series of higher highs and higher lows since price made contact with support from 89.69 in May.
- Despite the weekly timeframe signalling a bearish condition, support from 95.86 on the daily timeframe will likely be a key watch this week for dip-buying interest. Failure to deliver a floor unmasks a possible test of the decision point at 94.96-95.26.
EUR/USD:
(Italics: previous analysis)
Weekly timeframe:
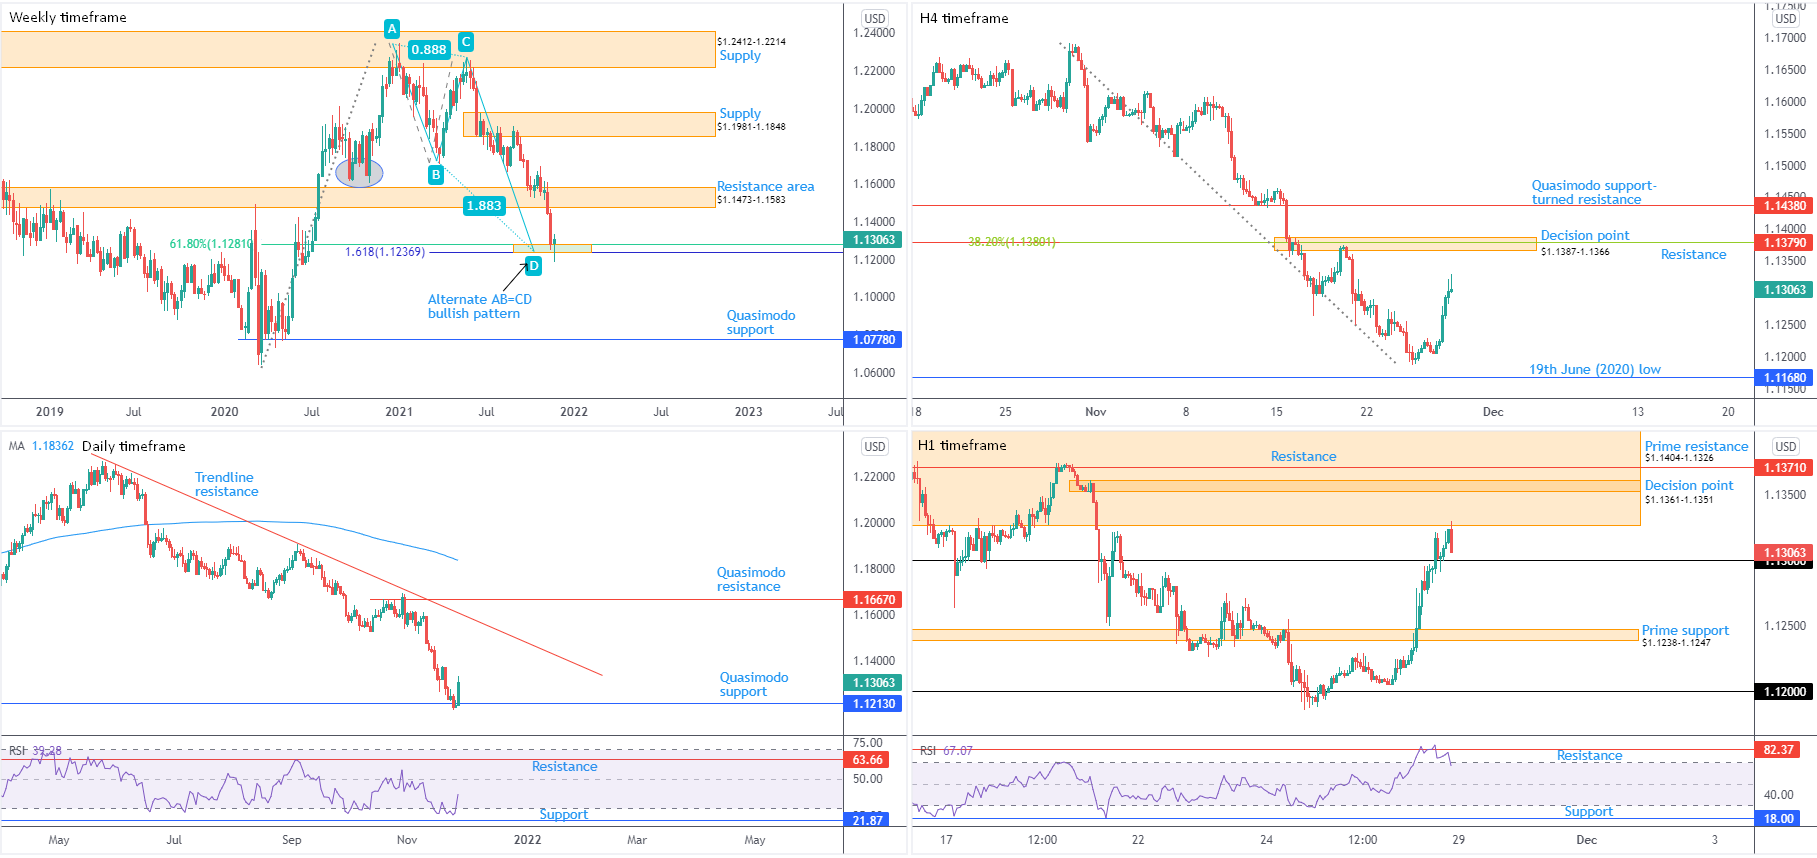
Despite testing the resolve of support at $1.1237-1.1281—made up of a 61.8% Fibonacci retracement at $1.1281 and a 1.618% Fibonacci projection from $1.1237— and clocking a fresh 2021 low, Europe’s single currency finished the week higher against its US counterpart.
‘Harmonic’ traders will acknowledge $1.1237 represents what’s known as an ‘alternate’ AB=CD formation.
Extending recovery gains this week moves resistance at $1.1473-1.1583 in sight, while navigating lower throws light on Quasimodo support as far south as $1.0778.
Interestingly, the pair took out 2nd November low (2020) at $1.1603 in late September. This suggests the beginnings of a primary downtrend on the weekly timeframe, reinforced by the monthly timeframe trending lower since mid-2008.
Daily timeframe:
Quasimodo support at $1.1213 (positioned beneath the weekly timeframe’s Fibonacci structure), drawn from mid-June, made an entrance last week. Aided by the relative strength index (RSI) exiting oversold space, a stronger-than-expected recovery developed Friday.
Continued interest to the upside this week points to a run back to trendline resistance, extended from the high $1.2254. Establishing a decisive close beneath $1.1213, on the other hand, not only helps validate the bearish environment brewing on the weekly timeframe, but also exposes support on the daily timeframe at $1.0991 (not visible on the screen).
H4 timeframe:
The tail end of the week witnessed buyers enter an offensive phase ahead of 19th June (2020) low coming in from $1.1168.
Limited resistance is evident on this timeframe until a decision point area at $1.1387-1.1366, which happens to house resistance from $1.1379 and a 38.2% Fibonacci retracement at 1.1380.
H1 timeframe:
Overhead, thanks to Friday dethroning $1.13 and retesting the latter in the form of support, directs attention towards a large prime resistance from $1.1404-1.1326. Within this area, a decision point at $1.1361-1.1351 is seen, along with resistance at $1.1371. Also noteworthy is the H4 timeframe’s decision point at $1.1387-1.1366 residing within the walls of $1.1404-1.1326.
Between $1.1371 and $1.1361-1.1351, therefore, could be interesting should price advance this far north this week.
Failure to command a bullish presence above $1.13 may have prime support at $1.1238-1.1247 call for attention.
From the relative strength index (RSI), the indicator registered overbought conditions and touched gloves with resistance at 82.37. Exiting overbought this week underlines a bearish signal.
Observed Technical Levels:
Long term:
Price action on the weekly timeframe launching a hammer candlestick pattern from Fibonacci support at $1.1237-1.1281, accompanied by the daily timeframe’s Quasimodo support level from $1.1213, could draw weekly resistance at $1.1473-1.1583 into the fight.
Short term:
The bulky prime resistance on the H1 timeframe at $1.1404-1.1326, an area housing a number of key resistances derived from H1 and H4 charts (in particular between $1.1371 and $1.1361-1.1351 [H1]), may draw attention this week.
How much of a bearish response is seen from the aforementioned resistances is difficult to estimate, given the higher timeframes show room to climb. Nevertheless, a H1 close back under $1.13 is likely sufficient to draw up a bearish scenario back to the H1 timeframe’s prime support coming in from $1.1238-1.1247.
AUD/USD:
(Italics: previous analysis)
Weekly timeframe:
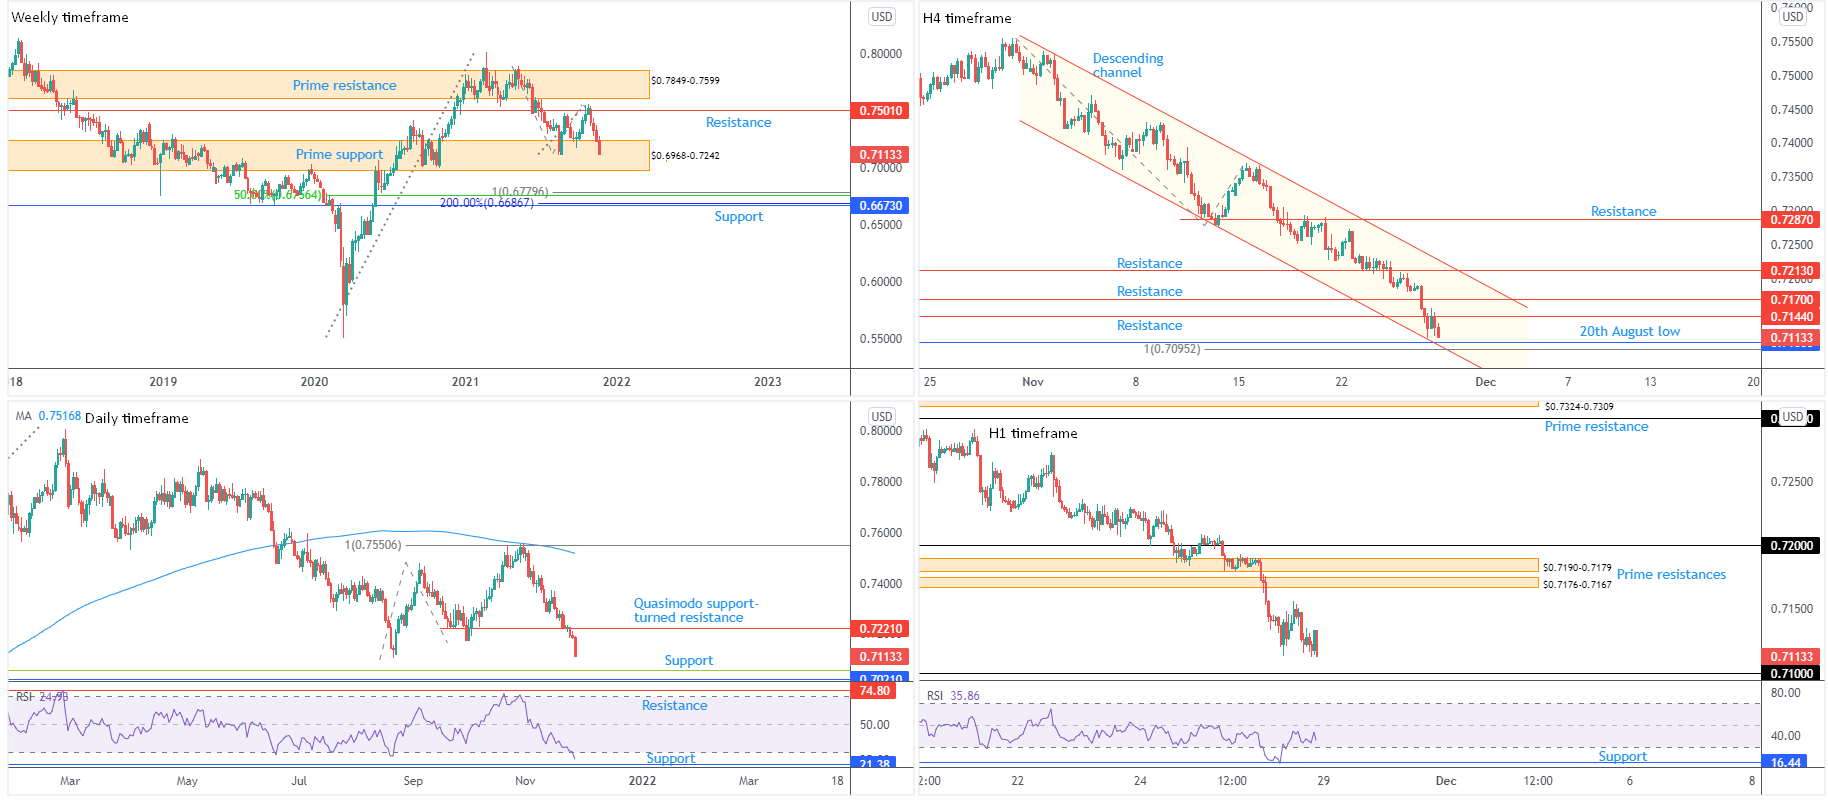
Month to date, AUD/USD is down 5.4 percent. Technically, the decline commenced from resistance at $0.7501 in the shape of four successive weekly bearish candles. As a direct result of latest weakness, prime support at $0.6968-0.7242 has entered the fray.
Manoeuvring beneath $0.6968-0.7242 exposes support at $0.6673 and an assembly of Fibonacci ratios between $0.6687 and $0.6780. Included within this area is a 100% Fibonacci projection: an AB=CD bullish formation.
Trend on the weekly timeframe has been higher since pandemic lows of $0.5506 (March 2020); though note the monthly timeframe has been entrenched within a large-scale downtrend since mid-2011.
Daily timeframe:
Meanwhile, a closer reading of price movement on the daily chart reveals the currency pair is fast approaching 20th August lows at $0.7106, in light of Friday’s 1.0 percent decline.
Additional support is visible at $0.7021, sheltered beneath a 38.2% Fibonacci retracement at $0.7057 (green), while a bullish response may have Quasimodo support-turned resistance elbow its way into the spotlight this week at $0.7221.
With price taking out 29th September low at $0.7170, the trend on the daily timeframe has resumed a downside position. Momentum studies, nonetheless, shows the relative strength index (RSI) dropped in on oversold territory and is closing in on indicator support at 21.38. Traders are urged to note that this indicator has a tendency to remain oversold for prolonged periods in downward markets, with temporary overbought space operating from approximately 50.00.
H4 timeframe:
Since the beginning of November, price has been contained within a descending channel, forged from $0.7532 and $0.7280. More recently, the currency pair tunnelled through Quasimodo support at $0.7144 and subsequently furnished the chart with resistance on Friday.
Downstream, 20th August low falls in at $0.7106 (highlighted on the daily scale), coupled with a 100% Fibonacci projection at $0.7095 and channel support, taken from the low $0.7280.
Trend direction is clearly tilted lower on this scale, aligning with daily and monthly timeframes.
H1 timeframe:
As evident from the H1 chart, the majority of losses were observed early hours Friday, leading movement to within striking distance of $0.71.
Two prime resistance zones absorb chart space higher up at $0.7190-0.7179 and $0.7176-0.7167—both sheltered south of $0.72.
Indicator support put in an appearance at 16.44 on the relative strength index (RSI) on Friday and is demonstrating early bullish divergence. It’s likely the RSI will dip a toe back in oversold before the charts display sharper divergence.
Observed Technical Levels:
Long term:
Prime support on the weekly timeframe at $0.6968-0.7242 remains the centre of interest. Nevertheless, in light of the monthly timeframe’s downside bias and last week tumbling 1.6 percent places a question mark on its authority.
Daily support at $0.7021, and associated 38.2% Fibonacci retracement at $0.7057, however, is set within the lower limits of the said weekly support. Consequently, a bullish showing may emerge when (if) the area is brought in.
Short term:
$0.71 is key on the H1. This, as well as H4 support ($0.7106, a 100% Fibonacci projection at $0.7095 and channel support), echoes a short-term floor early week. Though any upside efforts are likely to be greeted by sellers at H1 prime resistances ($0.7190-0.7179 and $0.7176-0.7167), as traders look for sell-on-rally scenarios as a result of the immediate downtrend.
DISCLAIMER:
The information contained in this material is intended for general advice only. It does not take into account your investment objectives, financial situation or particular needs. FP Markets has made every effort to ensure the accuracy of the information as at the date of publication. FP Markets does not give any warranty or representation as to the material. Examples included in this material are for illustrative purposes only. To the extent permitted by law, FP Markets and its employees shall not be liable for any loss or damage arising in any way (including by way of negligence) from or in connection with any information provided in or omitted from this material. Features of the FP Markets products including applicable fees and charges are outlined in the Product Disclosure Statements available from FP Markets website, www.fpmarkets.com and should be considered before deciding to deal in those products. Derivatives can be risky; losses can exceed your initial payment. FP Markets recommends that you seek independent advice. First Prudential Markets Pty Ltd trading as FP Markets ABN 16 112 600 281, Australian Financial Services License Number 286354.


 Access +10,000 financial
instruments
Access +10,000 financial
instruments