
XJO WEEKLY
Price structure: Impulsive decline
The XJO 200 has decisively moved lower from the ascending wedge pattern discussed last week. It is now moving below the all-time high level and erasing gains for the 2024 year so far. This does not change the primary UP trend. The extended range (large range) may see some follow-through in the coming week. The primary target will be the ascending trendline at the 7200-point level.
Indicator: Relative Strength 14: Bearish
Relative Strength has turned sharply lower as part of the overall directional move. Only further movements towards the 70 level will remain a bullish signal for further gains; last week, the RSI value moved lower in line with the current price move. However, a new indicator high is required over the late Q4-2023 high point to set a bullish tone. Should the RSI reading move below the 50 level, the indication is for the current bearish momentum to continue.
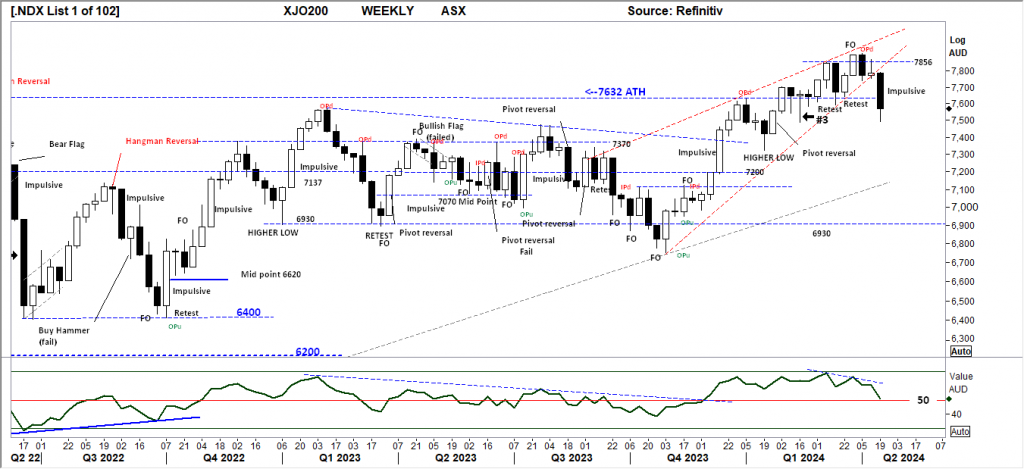
Comments last week: The Fake Out (FO) discussed two weeks ago has continued to play out with a reversal in the form of an outside period (OPd) and, last week, a further rejection of the high with a low closing price in the overall range. With the price remaining within the ascending wedge pattern, the potential flow on from the OPd is for further follow-through lower in this chart to retest the 7632 level. The underlying primary trend is up. However, the observation is that price action remains in a developing consolidation area above the 7632 level. To remain bullish, a close over the 7856 level and the 7900 level is required. A new divergence signal has developed at this level and should be monitored for further declines.
XJO DAILY
Price structure: Bearish wedge breakdown.
The retest towards the 7472 historical support level, with the resulting closing price of 7467 for the week, was the breakout level set during February 2024 following the prior retest of the 7472 level. The price ranges of support and resistance follow a very technical pattern,, indicating the market is not in a distressed sell with buying programs looking at key levels. Further declines may see the 200-day moving average retested at 7350 points.
Indicator: Relative Strength 14:
The Relative Strength Indicator (14) turned lower into the close on Friday, indicating an overall decline in momentum as a result of the larger price decline developing. This is the level where traders would be looking for a further sell signal, with the current crossing of the “50” level now heading to the “30” level, where early buyers would look for a divergence buy signal.
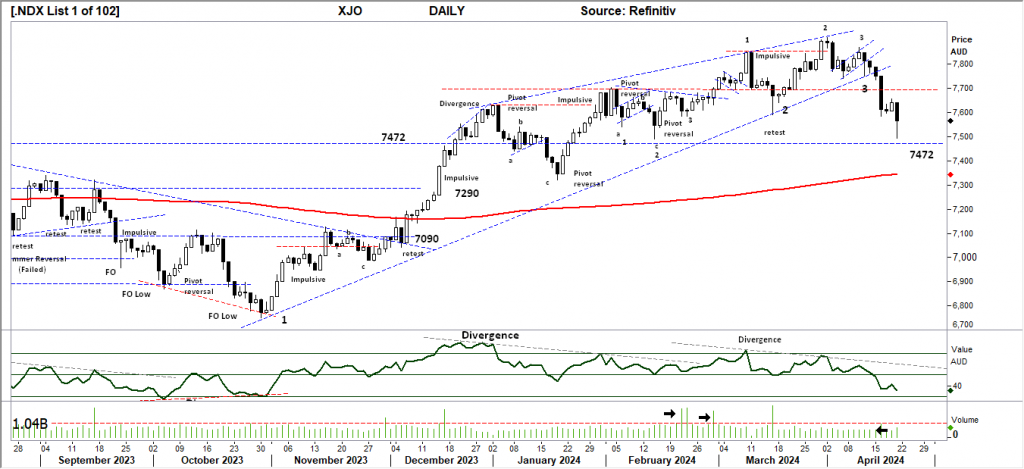
Comments last week: The short trendline was confirmed last week with the third touch, and low-volume price declines are viewed as bullish as the market is not declining on current news or a changed forward view about the economy. Overall, a bearish rising wedge is developing. Should the price break to the lower side, a retest of the 7540 level is possible, given that the current value is equal to the impulsive move of early March 24.
S&P 500 WEEKLY: Impulsive decline
Last week, we saw a strong follow-through from the pivot reversal discussed. The small support level shown at 4920 may offer some support early in the week. However, a breakdown below this level will target the 4545-point breakout level set during Q3 2023. The primary trend has not changed to a downward trend. Historically, the 2nd quarter is bearish for stocks leading into the May period. Look for further declines.
Indicator: Relative Strength Indicator 14
Relative Strength has turned lower as the momentum indicator moves below the 70 level. In the coming weeks, traders will monitor the RSI for a bearish divergence signal, as any index price consolidation towards the 4818 level may re-assert a bearish RSI signal as the indicator crosses lower towards the 50 level and towards the 30 level.

Comments from last week: An outside week with a strong lower shadow has given way to setting a bearish pivot point, halting further extension of this already overextended move, which is now 22% from the early November 23 low. The first level of support remains at 4920, with the potential to retest the breakout area of 4545 points. Historically, the second quarter is bearish for stocks leading into the May period, looking for further declines.
SPX DAILY
Price structure: Directional decline.
The daily price movements have now resolved the “Gap” area at the 5000 point level following 6 daily lower closing prices from the “pivot reversal” indicated last week. Daily price declines can give way to sharp “short covering” rallies in price. A closing price over the 5000-point level for several sessions is required before an indication of a further rally can be confirmed.
Indicator: Relative Strength Indicator 14
Relative Strength Indicator has moved strongly below the 50 level, indicating bearish momentum, and is currently continuing lower towards the 30 level. The Sell divergence signal has now played out; the RSI touching the 30 level and turning lower will see a downward continuation in the index this week. This is the level to monitor for a bullish divergence signal over the next 2-3 weeks.
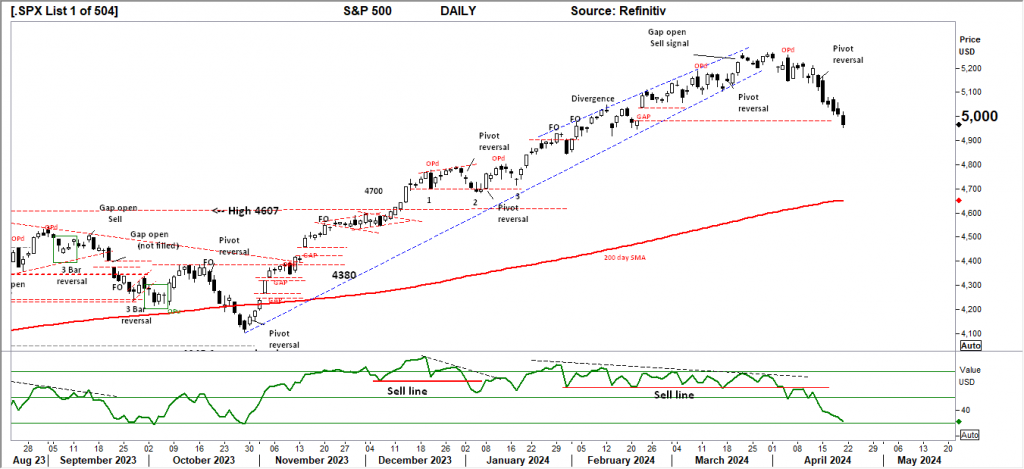
Comments from last week: The daily view of the S&P 500 shows a second bearish pivot formed at the close of last week. The developing top pattern now targets the “GAP” area around 5000 points. The Index is at risk of developing a downtrend to retest the 200-day moving average at the breakout point of 4607 points.
NASDAQ DAILY
Price structure: Breakdown
The Nasdaq’s daily chart is dominated by strong range days moving lower into the gap support area of 16,996 points. This level is also the January 24 breakout point and effectively wipes out the past four months of gains. This current high momentum move may retest the 200-day moving average at 16,300 points. The index is currently at a key level of support with the potential for a consolidation phase to develop; a further lower daily close may see a strong momentum move lower.
Indicator: Relative Strength 14
Relative Strength has moved lower, below the 50 level, and is now at the 30 level. The RSI should now be monitored for further movement below the 30 level, indicating a strong bearish momentum move is underway. This may provide some early insight into the overall primary trend’s failure.
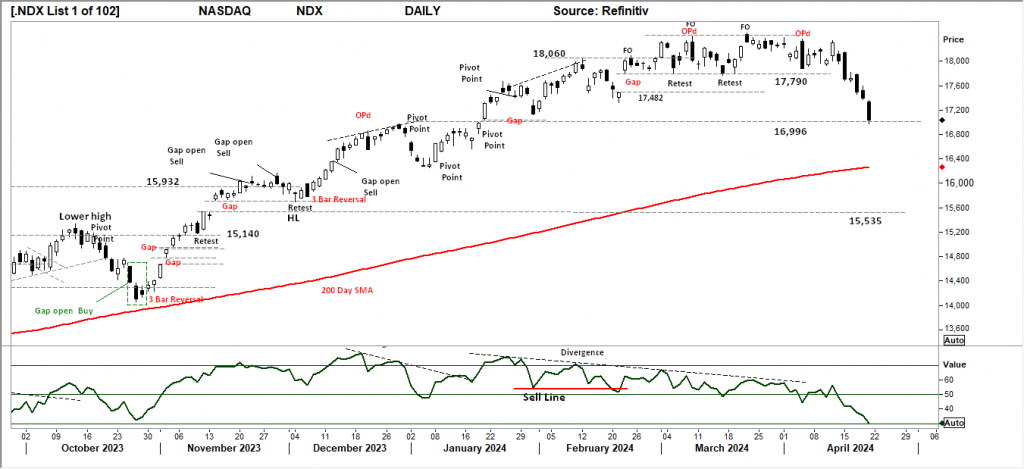
Comments from last week: Sideways consolidation is well developed, with a significant support level of 17,790 points being the key level for the Bulls to hold in the coming days. As with the S&P500, this chart is dominated by the failed retest of the high seen last Thursday and Friday. As the current trading range is well developed, a break to the lower side would be a swift movement as stop losses are taken towards the 200-day moving average. The observation is that the overall Relative Strength has turned bearish for now; the failed 4th attempt to move over the 70 level is often a signal of exhaustion.
USD Spot GOLD – DAILY: Continuing Rejection
The Spike High (SH) achieved on the 12th of April has not been broken, with a succession (5) of retests showing continued rejection. The trading risk is now to the downside, as a sharp protect profit event may trigger stops for the late buyers and a “protect profit” from the longer-term holders. The underlying Primary trend remains UP, and consolidation is an important development within trends. However, statistics show that after 9 weeks of advances in Gold, the PM often declines into long periods of consolidation. February and March are also a seasonal window for Gold buying in the subcontinent.
Indicator: Relative Strength 14
The RSI is turning lower from above the key 70 level set in late March with the price reversal, with this breakdown lower moving the indicator towards the 70 level. The Relative Strength continues to show a bearish divergence signal. Long-term traders should monitor this Daily chart for a fifth major yearly top developing at this $2400.0 level, with further declines in the long term.
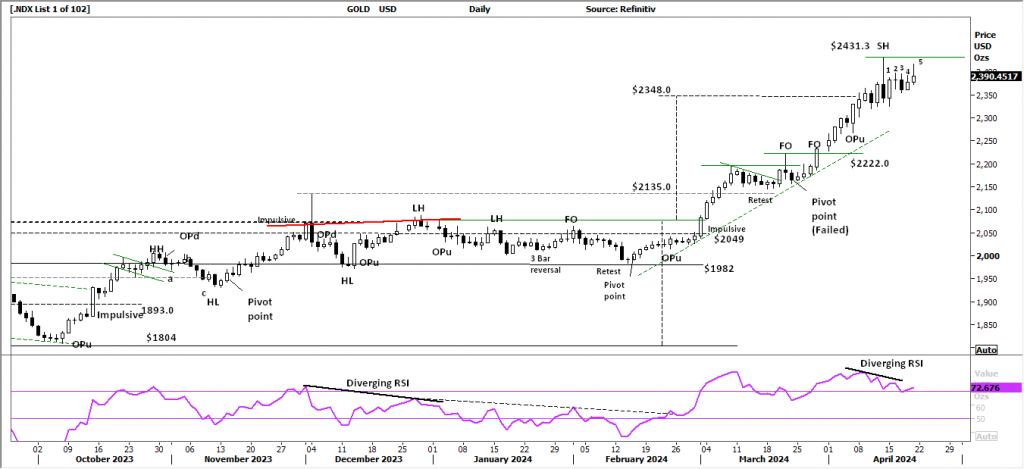
Comments from last week: The breakout extension price target of $2348.0 has been met, and it is acknowledged that gold remains a “hedge” against inflation and Global uncertainty. Without a solid catalyst showing, profit-taking may enter the market and set a new retracement back to the Trendline or test $2222.0 as support. The potential for a multiyear top remains. Gold has advanced for 9 weeks; statistics indicate a strong potential for a high to be in place following this current rejection of higher prices.
AUD Spot GOLD – DAILY: Continuing Impulsive moves.
The $AUD Gold price is a product of the $USD Gold price and the fluctuating $AUD FX rate. The strong, impulsive move continued last week to set a new closing high price. For this movement to continue, the $USD gold price must rally, and the $AUD must decline further. With both of these now in an extended move, any rally in the $AUD or decline in the $USD Gold price will show a sharp decline in the $AUD price and bring a change of sentiment towards the underlying producing miners.
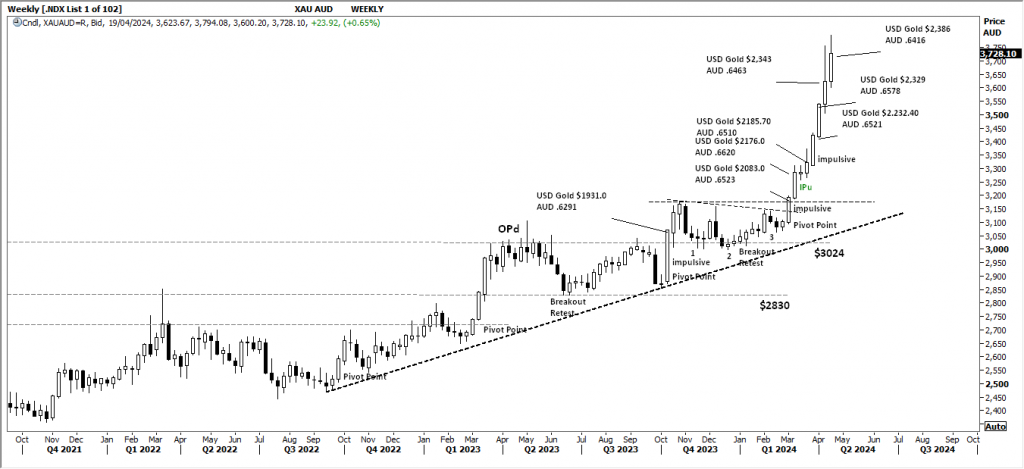
Comments from last week: A parabolic move best describes $AUD Gold’s impulsive movement higher. The key is the declining $AUD, currently around the $0.6463 level with a consolidating $USD Gold price. This remains very bullish for locally producing gold companies. Australian-based gold producers sell in Australian dollars. NST, NEM, and GOR.
SILVER
Price structure: significant resistance level met.
As seen in the gold price, silver has also failed to exceed the all-time high set on Feb 21’ and the recent SH point. Last Friday, silver set an OPu (Outside Period, up close), and the statistics show the OPu can set the high within 3 bars with a strike rate of 94%. Consolidation is developing below the $28.80 level and may see a profit-taking event in the coming days. Only a sharp movement over the SH would put the Bulls back in control.
Relative Strength 14
Current Relative Strength has turned lower from above the 70 level, indicating momentum has turned very neutral. Should the RSI continue lower to begin a Sell signal, downward momentum is indicated. Only a continued move higher and over the 70 levels would reflect a solid change in the underlying price momentum and should alert to a potential new trend and breakout.

Comments from last week: The Daily chart of Silver has rejected the All-time High level of $30.03 set in February 2021 with a strong rejection bar to close below the $28.80 level. The retest of the $27.00 level is underway. Outside ranges have a high statistical outcome for marking high points within the next three bars. A Daily closing price below $27.00 would give the first indication of a real sellers-induced reversal underway.
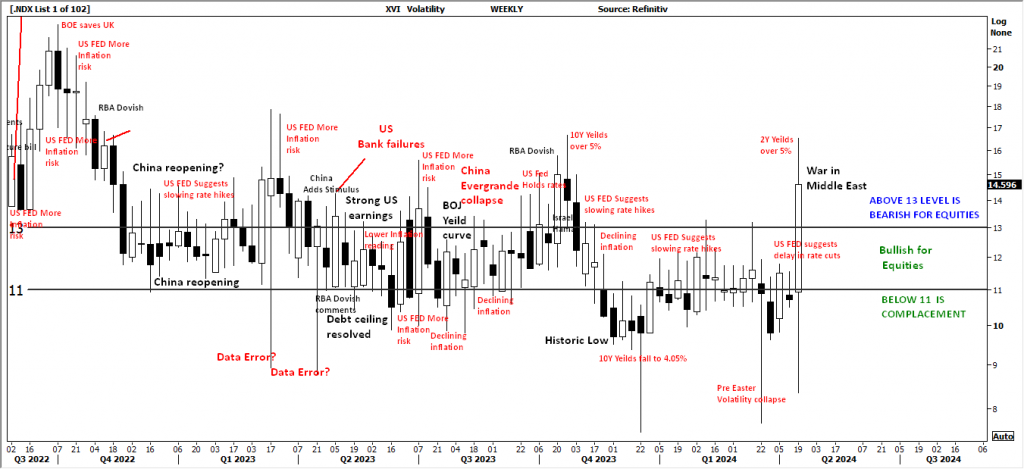
AUSTRALIAN VOLATILITY INDEX: The equities traders compass.
The current volatility closing value has moved to close above the 13 level following a move below the 11 level. The closing value indicates the XVI remains within the “Bearish for Equities” level.
With the indicator moving higher early in the week, the forward pricing (volatility) of PUT options (insurance) is increasing; this is observed against a falling market, indicating equity price movements may turn bearish as the cost of 3 months (insurance) put Options is increasing, suggesting the market is moving towards a protect profits mode.
For continued support of equities, the XVI should remain subdued below the “13” level.
The cost of 3-month forward PUT options is decreasing from recent elevated levels.
The XVI is the difference between the 3-month forward pricing of ETO Options and the current month. As markets anticipate events, the forward-priced option volatility changes; hence, as the forward price changes, this “skew” in pricing is measured in this XVI.
The XVI value works as an inverse correlation to the underlying market.


 Access +10,000 financial
instruments
Access +10,000 financial
instruments