
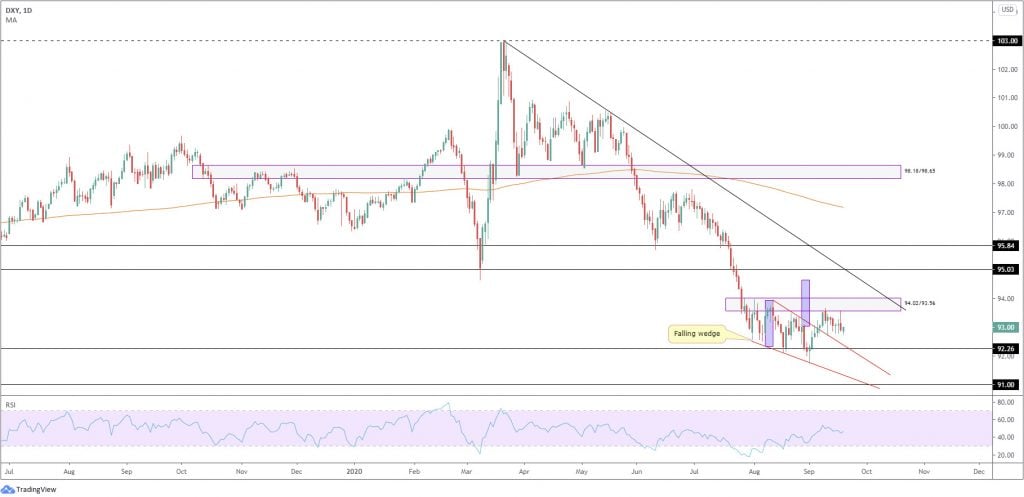
US Dollar Index (DXY)
After breaching the upper rim of a daily falling wedge pattern (93.91/92.55), upside performance has been lacklustre, hampered by daily supply at 94.02/93.56 and the current downtrend, active since topping in March at 102.99. A falling wedge can signify either a reversal or continuation signal – in this case the pattern implies a reversal could be at hand.
In order to reach the falling wedge take-profit target at 94.65 (measured by gauging the base distance and adding this value to the breakout point – light purple boxes), the aforesaid daily supply, an area that’s contained upside since August, must be unseated.
Sustained weakness suggests support at 92.26, an active S/R level since late 2017, may resurface this week. Traders will also observe the support aligns with the upper limit of the daily falling wedge, communicating confluence.
- The RSI oscillator has produced a series of higher lows/highs after bottoming at 17.50 heading into August, recently greeting the 50.00 mid-way point.
- Concerning the 200-day simple moving average, circling 97.18, the dynamic value continues to curve lower, two years after mostly drifting higher.
EUR/USD
Monthly timeframe:
(Technical change on this timeframe is often limited though serves as guidance to potential longer-term moves)
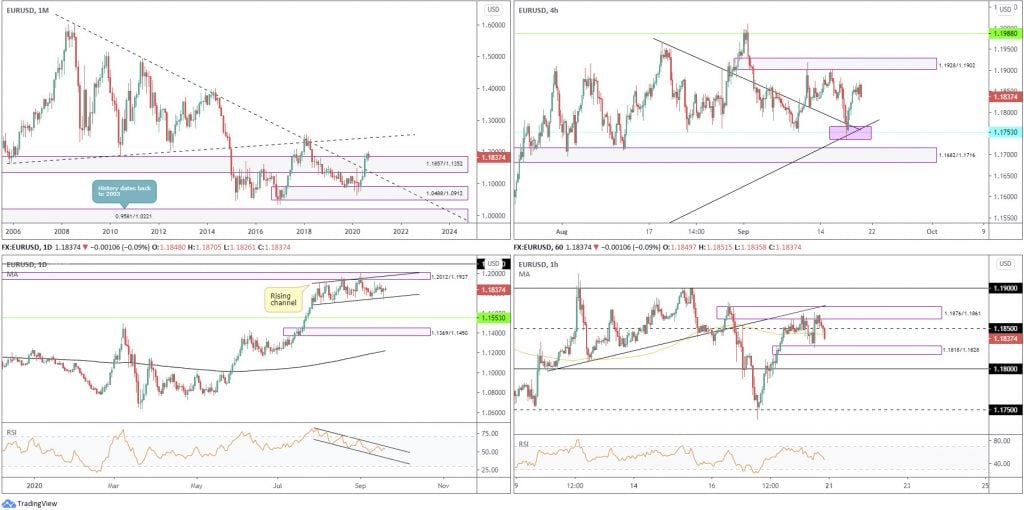
August saw the euro nudge to a fourth successive monthly gain against the US dollar, adding nearly 1.5 percent.
The move toppled supply from 1.1857/1.1352 and extended space north of long-term trendline resistance (1.6038), arguing additional upside may be on the horizon, targeting trendline resistance (prior support – 1.1641). Despite this, the primary downtrend (since July 2008) remains intact until 1.2555 is engulfed (Feb 1 high [2018]).
Trading in September is down more than 0.8 percent.
Daily timeframe:
Partially altered from previous analysis
Price remains contained within the parapets of a rising channel pattern (1.1695/1.1909), and is also hampered by supply at 1.2012/1.1937, extended from May 2018.
Recently, we saw the pair probe beneath the aforesaid channel support and fashion a hammer candlestick pattern. Although this configuration is generally sufficient to stimulate buying, Friday failed to develop any follow-through momentum.
With respect to the RSI indicator, we remain inside a (near) two-month descending channel formation, currently hovering nearby the upper limit.
H4 timeframe:
Last week witnessed a recovery form from support at 1.1753, a barrier that shared space with two trendline supports (1.1965/1.1185).
The week ended hovering within touching distance of supply at 1.1928/1.1902 (prior demand), located under the current daily supply.
H1 timeframe:
Supply at 1.1876/1.1861, alongside a nearby trendline resistance (prior support – 1.1798), made an entrance Friday and survived a number of upside attempts. As you can see, we ended the week closing back under 1.1850 and the 100-period simple moving average at 1.1842, within striking distance of demand at 1.1818/1.1828.
Outside of the aforesaid supply and demand areas, 1.19/18 levels are visible.
In terms of the RSI indicator, the value concluded the week below the 50.00 mid-way point.
Structures of Interest:
Long term:
The monthly timeframe suggests buyers could push beyond supply at 1.1857/1.1352.
In conjunction with the monthly chart, daily price rejected channel support on Thursday in the shape of a hammer candle pattern. Consequently, buyers are still likely to push for higher levels this week at least until reaching daily supply at 1.2012/1.1937.
Short term:
In respect to the H4 timeframe, room to advance is visible until we cross paths with supply at 1.1928/1.1902. Therefore, this is in harmony with the bigger picture.
With this being the case, buyers will likely focus on either the H1 demand plotted at 1.1818/1.1828 or the 1.18 level as structures of interest in early trading.
AUD/USD
Monthly timeframe:
(Technical change on this timeframe is often limited though serves as guidance to potential longer-term moves)
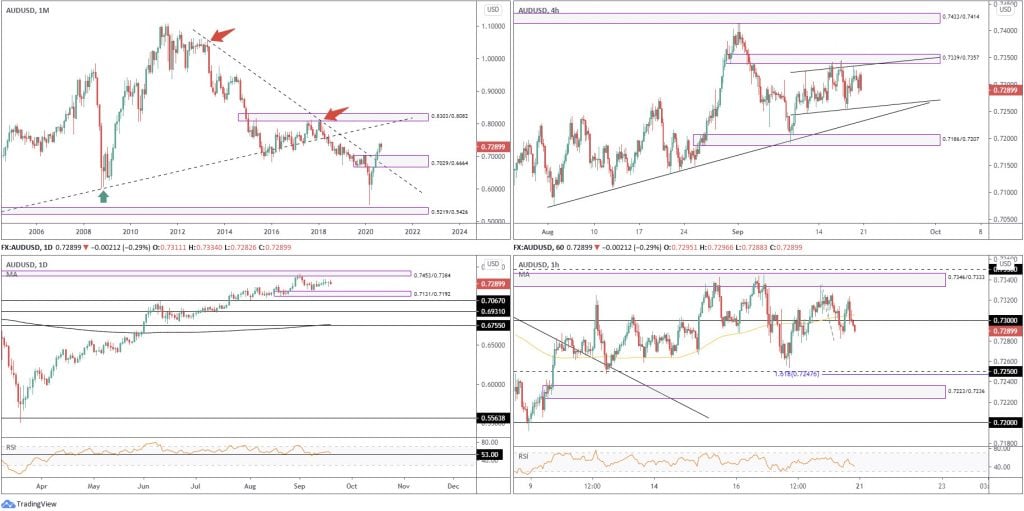
August’s 3.3% gain extended space north of supply at 0.7029/0.6664 and long-term trendline resistance (1.0582). Technically, buyers appear free to explore as far north as 0.8303/0.8082 in the coming months, a supply zone aligning closely with trendline resistance (prior support – 0.4776).
While price has indeed removed trendline resistance and supply, traders might still want to take into account the primary downtrend (since mid-2011) remains south until breaking 0.8135 (January high [2018]).
Daily timeframe:
Brought forward from previous analysis
In recent sessions, AUD/USD has echoed an indecisive stance between demand at 0.7131/0.7192 (a drop-base-rally area) and supply at 0.7453/0.7384, an area which recently capped YTD peaks at 0.7413.
Support at 0.7067 is seen should we push through the aforesaid demand.
The trend, according to the daily timeframe, has emphasised a positive tone since bottoming in late March.
Indicator-based traders may also recognise the RSI holds support at 53.00, a clear S/R level since October 2019.
H4 timeframe:
Candles, as you can see, have been entrenched within an ascending channel formation, drawn between 0.7247/0.7324.
Also capping upside is supply at 0.7339/0.7357 (prior demand), while drilling south throws light on trendline support (0.7076), and a demand at 0.7186/0.7207.
A reaction to the upside, one that engulfs current supply, may eventually see price cross paths with supply at 0.7433/0.7414 (inhabits daily supply at 0.7453/0.7384).
H1 timeframe:
Supply at 0.7346/0.7333, sheltered just under 0.7350 and housed around the lower limits of H4 supply at 0.7339/0.7357, made an arrival early Friday. Despite piercing 0.73 heading into US trading, a recovery attempt was seen south of 0.73, though failed to preserve gains past 0.7320 before recoiling back under 0.73 by the close. As a result of this, the technical radar has been refocused to 0.7250 support. Also deserving notice is the 161.8% Fib ext. level at 0.7247 and demand at 0.7223/0.7236.
Recently, the RSI indicator also overrun its 50.00 centreline, facing the prospect of reaching oversold terrain.
Structures of Interest:
Long term:
Limited resistance is visible above the recently penetrated monthly supply at 0.7029/0.6664, suggesting price on the daily timeframe, albeit somewhat lacklustre of late, could venture above supply from 0.7453/0.7384. However, a retracement to daily demand at 0.7131/0.7192 could also be in the offing before buyers make a show.
Short term:
As we move to the lower timeframes, traders will note H4 supply at 0.7339/0.7357 and channel resistance (0.7324), as well as connecting H1 supply at 0.7346/0.7333 (areas positioned just beneath daily supply at 0.7453/0.7384) have held back buyers. As a result, at current price, buying could be challenging, despite higher timeframe direction.
Does this imply we’re heading lower to collect more buyers? According to the daily timeframe, we could push as far south as 0.72 on the H1 (the top edge of daily demand). Therefore, 0.7250 support on the H1 and 61.8% Fib confluence, along with demand at 0.7223/0.7236 and the 0.72 level are potential areas buyers may focus on this week.
DISCLAIMER:
The information contained in this material is intended for general advice only. It does not take into account your investment objectives, financial situation or particular needs. FP Markets has made every effort to ensure the accuracy of the information as at the date of publication. FP Markets does not give any warranty or representation as to the material. Examples included in this material are for illustrative purposes only. To the extent permitted by law, FP Markets and its employees shall not be liable for any loss or damage arising in any way (including by way of negligence) from or in connection with any information provided in or omitted from this material. Features of the FP Markets products including applicable fees and charges are outlined in the Product Disclosure Statements available from FP Markets website, www.fpmarkets.com and should be considered before deciding to deal in those products. Derivatives can be risky; losses can exceed your initial payment. FP Markets recommends that you seek independent advice. First Prudential Markets Pty Ltd trading as FP Markets ABN 16 112 600 281, Australian Financial Services License Number 286354.


 Access +10,000 financial
instruments
Access +10,000 financial
instruments