
EUR/USD:
Monthly timeframe:
(Technical change on this timeframe is often limited though serves as guidance to potential longer-term moves)
August saw the euro nudge to a fourth successive monthly gain against the US dollar, adding nearly 1.5 percent.
The move toppled supply from 1.1857/1.1352 and extended space north of long-term trendline resistance (1.6038), arguing additional upside may be on the horizon, targeting trendline resistance (prior support – 1.1641). Despite this, the primary downtrend (since July 2008) remains intact until 1.2555 is engulfed (Feb 1 high [2018]).
Trading in September is down more than 1.4 percent.
Daily timeframe:
As you can see, the euro traded 0.6 percent lower to the dollar on Monday, dropping to test channel support from 1.1695. Fracturing the aforesaid limit signals a continuation to the downside to support at 1.1553, with a break uncovering clear demand at 1.1369/1.1450.
With respect to the RSI oscillator, we remain inside a (near) two-month descending channel formation.
H4 timeframe:
The US dollar booked impressive gains Monday as sentiment soured, weighing on EUR/USD. Reconnecting with support at 1.1753 and an aligning trendline support (prior resistance – 1.1965), this was enough confluence to attract buyers in recent hours.
Continued weakness, nonetheless, targets demand seen at 1.1682/1.1716, an area extended from July.
H1 timeframe:
Early trade US had candle action assault lows at 1.1731, a few pips plotted ahead of support from 1.1722, and mildly pare losses into the close.
Supply around 1.1787 (red arrow) is seen as the next possible hurdle on the H1 timeframe, located just below the 1.18 level, therefore gains above 1.1750 could be extended today.
In terms of the RSI indicator, the line exited oversold territory, advancing from a low of 22.60.
Structures of Interest:
Despite Monday’s steep decline, technical indicators suggest an upturn in the euro could be on the cards. Monthly price is hovering around the upper edge of broken supply, daily action recently greeted channel support and H4 price also challenged support at 1.1753 and trendline support. In addition, H1 exhibits room to approach 1.18.
With the above in mind, a retest at 1.1750 is a scenario buyers may welcome, initially targeting the 1.18 hurdle.

AUD/USD:
Monthly timeframe:
(Technical change on this timeframe is often limited though serves as guidance to potential longer-term moves)
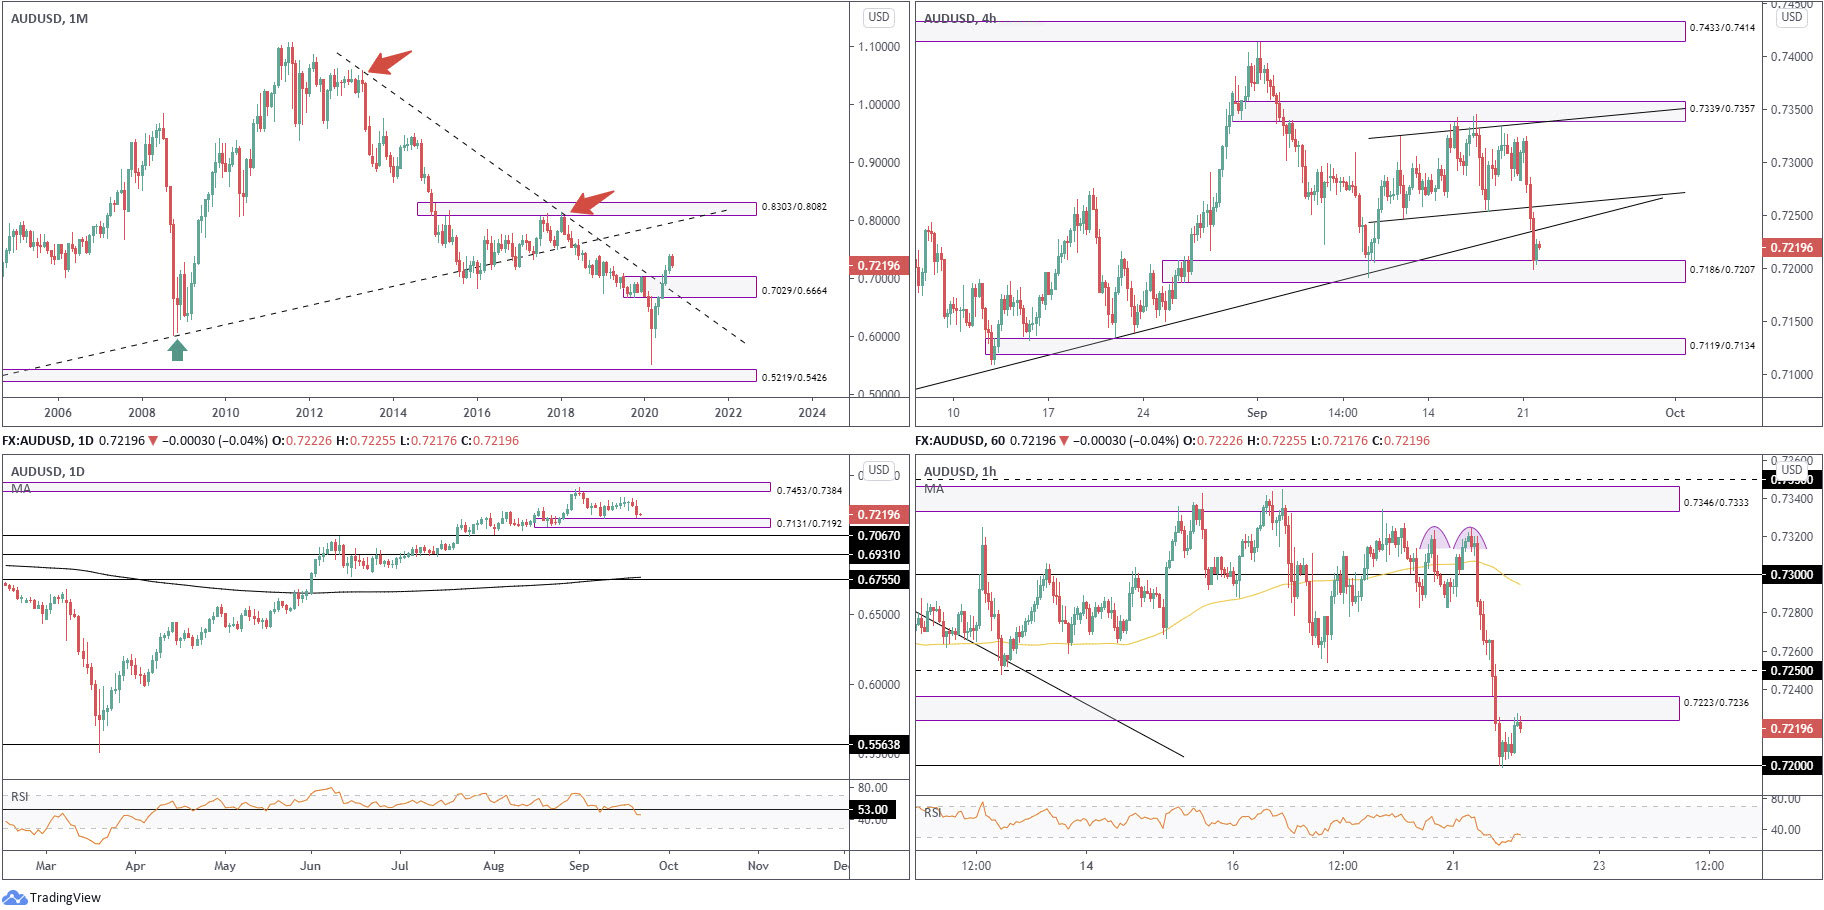
August’s 3.3% gain extended space north of supply at 0.7029/0.6664 and long-term trendline resistance (1.0582). Technically, buyers appear free to explore as far north as 0.8303/0.8082 in the coming months, a supply zone aligning closely with trendline resistance (prior support – 0.4776).
While price has indeed removed trendline resistance and supply, traders might still want to take into account the primary downtrend (since mid-2011) remains south until breaking 0.8135 (January high [2018]).
Daily timeframe:
Partially altered from previous analysis –
AUD/USD dipped in recent sessions, weighed amidst risk-off movement. Leaving supply at 0.7453/0.7384, an area which recently capped YTD peaks at 0.7413, unopposed, price slipped 0.9 percent Monday to test waters just ahead of demand at 0.7131/0.7192 (a drop-base-rally area).
Support at 0.7067 is seen should we push through the aforesaid demand.
The trend, according to the daily timeframe, has emphasised a positive tone since bottoming in late March.
Indicator-based traders may also recognise the RSI dropped through support at 53.00, a clear S/R level since October 2019.
H4 timeframe:
Monday’s acceleration to the downside nudged through channel support (0.7247), as well as a trendline support from 0.7076, reaching demand at 0.7186/0.7207.
Extending the mild recovery out of 0.7186/0.7207 has the recently penetrated trendline support to target; breaking to lower levels, however, could send price as far south as demand at 0.7119/0.7134.
H1 timeframe:
Following the formation of a double-top pattern around 0.7323, the pair plunged through a number of key levels, including the 0.73 hurdle and demand at 0.7223/0.7236.
Intraday flow tagged 0.72 (housed within H4 demand at 0.7186/0.7207) heading into the US morning session Monday, unearthing a mild recovery that retested supply at 0.7223/0.7236 (prior demand).
With reference to the RSI, we recently exited oversold terrain after tapping lows at 20.40.
Structures of Interest:
Given 0.72 (a recorded support level in Monday’s analysis) resides within H4 demand and eight pips above daily demand at 0.7131/0.7192, buyers could remain in control today and take on current H1 supply and H4 trendline resistance, areas where current longs may move stops to breakeven and bank partial profits.
Another scenario to keep an eyeball on is possible dips beneath 0.72 to test the upper edge of daily demand at 0.7192. Alone, this may be enough to spark another wave of buying.
USD/JPY:
Monthly timeframe:
(Technical change on this timeframe is often limited though serves as guidance to potential longer-term moves)
Since kicking off 2017, USD/JPY has been carving out a descending triangle pattern between 118.66/104.62. As you can see, though, price is currently testing the lower boundary of the aforesaid pattern.
Areas outside of the noted triangle can be seen at supply from 126.10/122.66 and demand coming in at 96.41/100.81.
Daily timeframe:
Snapping a five-day losing streak, buyers stamped through a mild recovery Monday around monthly support at 104.62 (the lower boundary of the monthly descending triangle).
The RSI is seen bottoming ahead of oversold levels.
H4 timeframe:
USD/JPY staged an impressive recovery during US trading on Monday, lifted on the back of broad USD strength and technical buying derived from a 161.8% Fib ext. level at 104.12, positioned ahead of another 161.8% Fib ext. point at 103.90.
The above led to price testing supply at 104.88/104.74, a minor rally-base-drop zone, which if a break comes to pass here could see supply at 105.06/105.30 make an entrance.
H1 timeframe:
By midday London Monday, the 104 level made a show and encouraged buyers to take over. Upside gained speed heading into the US morning session, clearing 104.50 resistance and testing resistance coming in from 104.82 and intersecting 100-period SMA. North of here, traders will note the 105 level as viable resistance, positioned close by supply at 105.23/105.14.
The RSI oscillator is seen topping ahead of overbought territory, after a strong run higher from oversold space.
Structures of Interest:
The monthly support level at 104.62, derived from the lower boundary of a descending triangle pattern, is likely to be of interest to buyers in this market.
Previous writing stated that buyers pushing for at least 105 on the H1 would not be a surprise. It was also underlined that traders would likely expect sellers to make an entrance around 105, owing to the lower edge of daily supply circling 105.10 and H4 supply at 105.06.
Going forward, and seeing as how we’ve yet to test 105, a 104.50 retest on the H1 could be in the offing today, a move fresh buyers may welcome.

GBP/USD:
Monthly timeframe:
(Technical change on this timeframe is often limited though serves as guidance to potential longer-term moves)
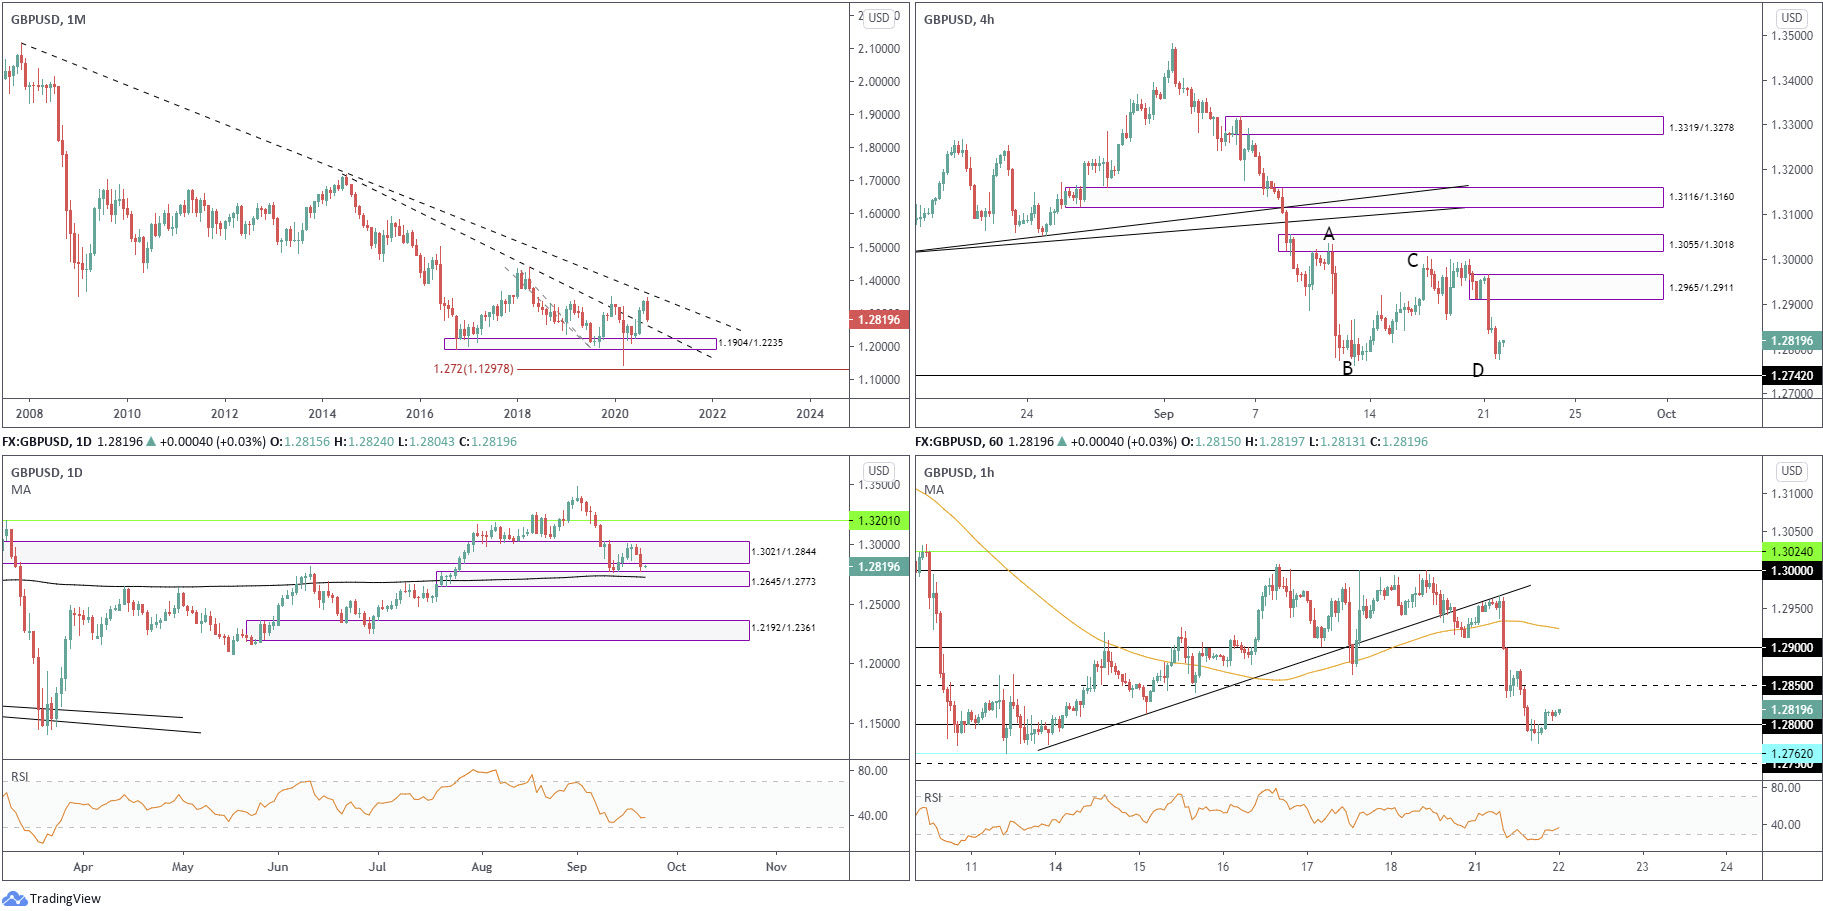
Leaving trendline resistance taken from 2.1161 unopposed, September currently trades lower by 4.2 percent, on track to retest trendline support (prior resistance – 1.7191).
Interestingly, the primary trend has faced lower since early 2008, unbroken until 1.4376 gives way – April 2 high 2018.
Daily timeframe:
Partially altered from previous analysis –
The four-day recovery from demand at 1.2645/1.2773 (houses the 200-day simple moving average at 1.2724) ran into strong opposition within the upper border of supply at 1.3021/1.2844. As you can see, price is on the verge of retesting the aforesaid demand area.
The RSI indicator is currently drawing up a bottoming phase ahead of oversold levels.
H4 timeframe:
The recent depreciation, a victim of USD strength, created firm supply around 1.2965/1.2911 and positioned price action within a stone’s throw from support at 1.2742 and merging ABCD support.
H1 timeframe:
Following an early retest at trendline resistance (prior support – 1.2773), we ducked under the 100-period simple moving average and challenged 1.29 and 1.28. the latter, as you can see, managed to keep price action afloat into the close.
As we enter Asia Pac hours, H1 hovers just above 1.28 and the RSI is poised to potentially connect with 50.00 after exiting oversold space.
Structures of Interest:
- Monthly price suggests we could be heading for further losses until around 1.26 (monthly trendline support).
- Daily price is poised to approach demand at 1.2645/1.2773.
- H4 is nudging towards support at 1.2742 and ABCD confluence.
- H1 holds above 1.28, yet buyers seem reluctant to commit.
H4 support at 1.2742 is likely of interest to buyers. Not only does the figure unite with ABCD support, it is housed within daily demand at 1.2645/1.2773. In addition, H1 support lurks close by at 1.2762 as well as 1.2750 support. Failure to hold here signals we’re headed for the 1.26 level, the monthly trendline support.
DISCLAIMER:
The information contained in this material is intended for general advice only. It does not take into account your investment objectives, financial situation or particular needs. FP Markets has made every effort to ensure the accuracy of the information as at the date of publication. FP Markets does not give any warranty or representation as to the material. Examples included in this material are for illustrative purposes only. To the extent permitted by law, FP Markets and its employees shall not be liable for any loss or damage arising in any way (including by way of negligence) from or in connection with any information provided in or omitted from this material. Features of the FP Markets products including applicable fees and charges are outlined in the Product Disclosure Statements available from FP Markets website, www.fpmarkets.com and should be considered before deciding to deal in those products. Derivatives can be risky; losses can exceed your initial payment. FP Markets recommends that you seek independent advice. First Prudential Markets Pty Ltd trading as FP Markets ABN 16 112 600 281, Australian Financial Services License Number 286354.


 Access +10,000 financial
instruments
Access +10,000 financial
instruments