
Your weekly review of technical patterns and structure.
The research team scans the financial markets for you, highlighting clear and actionable technical structures.
Forex: EUR/USD Poised to Navigate Lower?
Daily Timeframe –
Since topping around $1.1096 on 3 May and chalking up a double-top pattern, Europe’s shared currency has been on a downward slide against its US counterpart. Of technical relevance is the currency pair recently venturing south of its 50-day simple moving average at $1.0891, which, aided by the Relative Strength Index (RSI) extending its position below the 50.00 centreline, potentially opens the door for further downside towards support from $1.0717.
 Commodities: Silver Retesting Trendline Resistance-Turned-Support Level
Daily Timeframe –
After breaking beneath a neckline ($24.51) of a double-top pattern formed around resistance at $25.85, spot silver (XAG/USD) followed through to the downside. Subsequently, the precious metal tested a trendline resistance-turned-support level taken from the high of $30.14, set just above the double-top pattern’s profit objective at $22.89.
Given the uptrend this market has been in since September 2022, the space seen between the trendline support and the pattern’s profit objective could be enough of a technical floor to encourage buying.
 Equities: Germany’s DAX 40 Approaching Critical Juncture
Daily Timeframe –
The daily price of the DAX is fast approaching key resistance at 16,282. Venturing north of here will have price action refresh all-time highs, potentially attracting breakout buying.
However, any sizeable correction in this market could see trendline support make a show, taken from the low of 11,796.
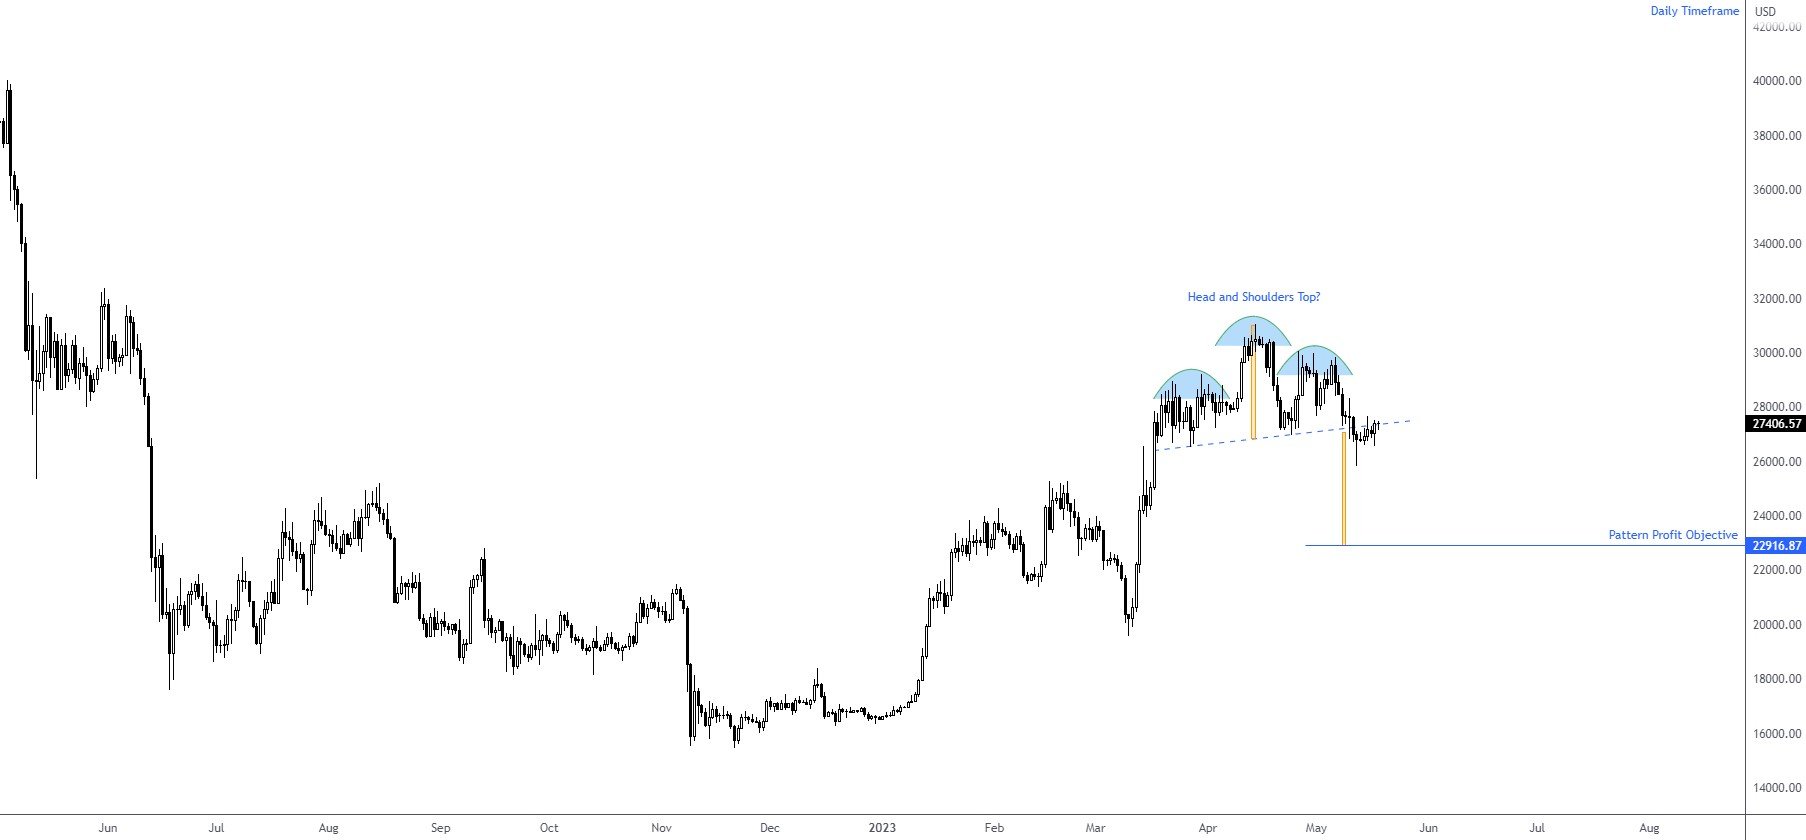
 Cryptocurrency: BTC/USD Testing Underside of Neckline
Daily Timeframe –
Price action on the daily timeframe of BTC/USD has, since 19 March, been busy carving out a head and shoulder top pattern, formed at $29,190 (left shoulder), $31,050 (head) and $30,050 (right shoulder). The major crypto recently closed beneath the pattern’s neckline, extended from the low of $26,525, and price is now retesting the lower side of the neckline.
If we see resistance emerge from the current price level, sellers could target the pattern’s profit objective as far south as $22,916.
 Charts: TradingView
DISCLAIMER: The information contained in this material is intended for general advice only. It does not consider your investment objectives, financial situation or particular needs. FP Markets has made every effort to ensure the accuracy of the information as at the date of publication. FP Markets does not give any warranty or representation as to the material. Examples included in this material are for illustrative purposes only. To the extent permitted by law, FP Markets and its employees shall not be liable for any loss or damage arising in any way (including by way of negligence) from or in connection with any information provided in or omitted from this material. Features of the FP Markets products including applicable fees and charges are outlined in the Product Disclosure Statements available from FP Markets website, www.fpmarkets.com and should be considered before deciding to deal in those products. Derivatives can be risky; losses can exceed your initial payment. FP Markets recommends that you seek independent advice. First Prudential Markets Pty Ltd trading as FP Markets ABN 16 112 600 281, Australian Financial Services License Number 286354.


 Access +10,000 financial
instruments
Access +10,000 financial
instruments