
Charts: Trading View
EUR/USD:
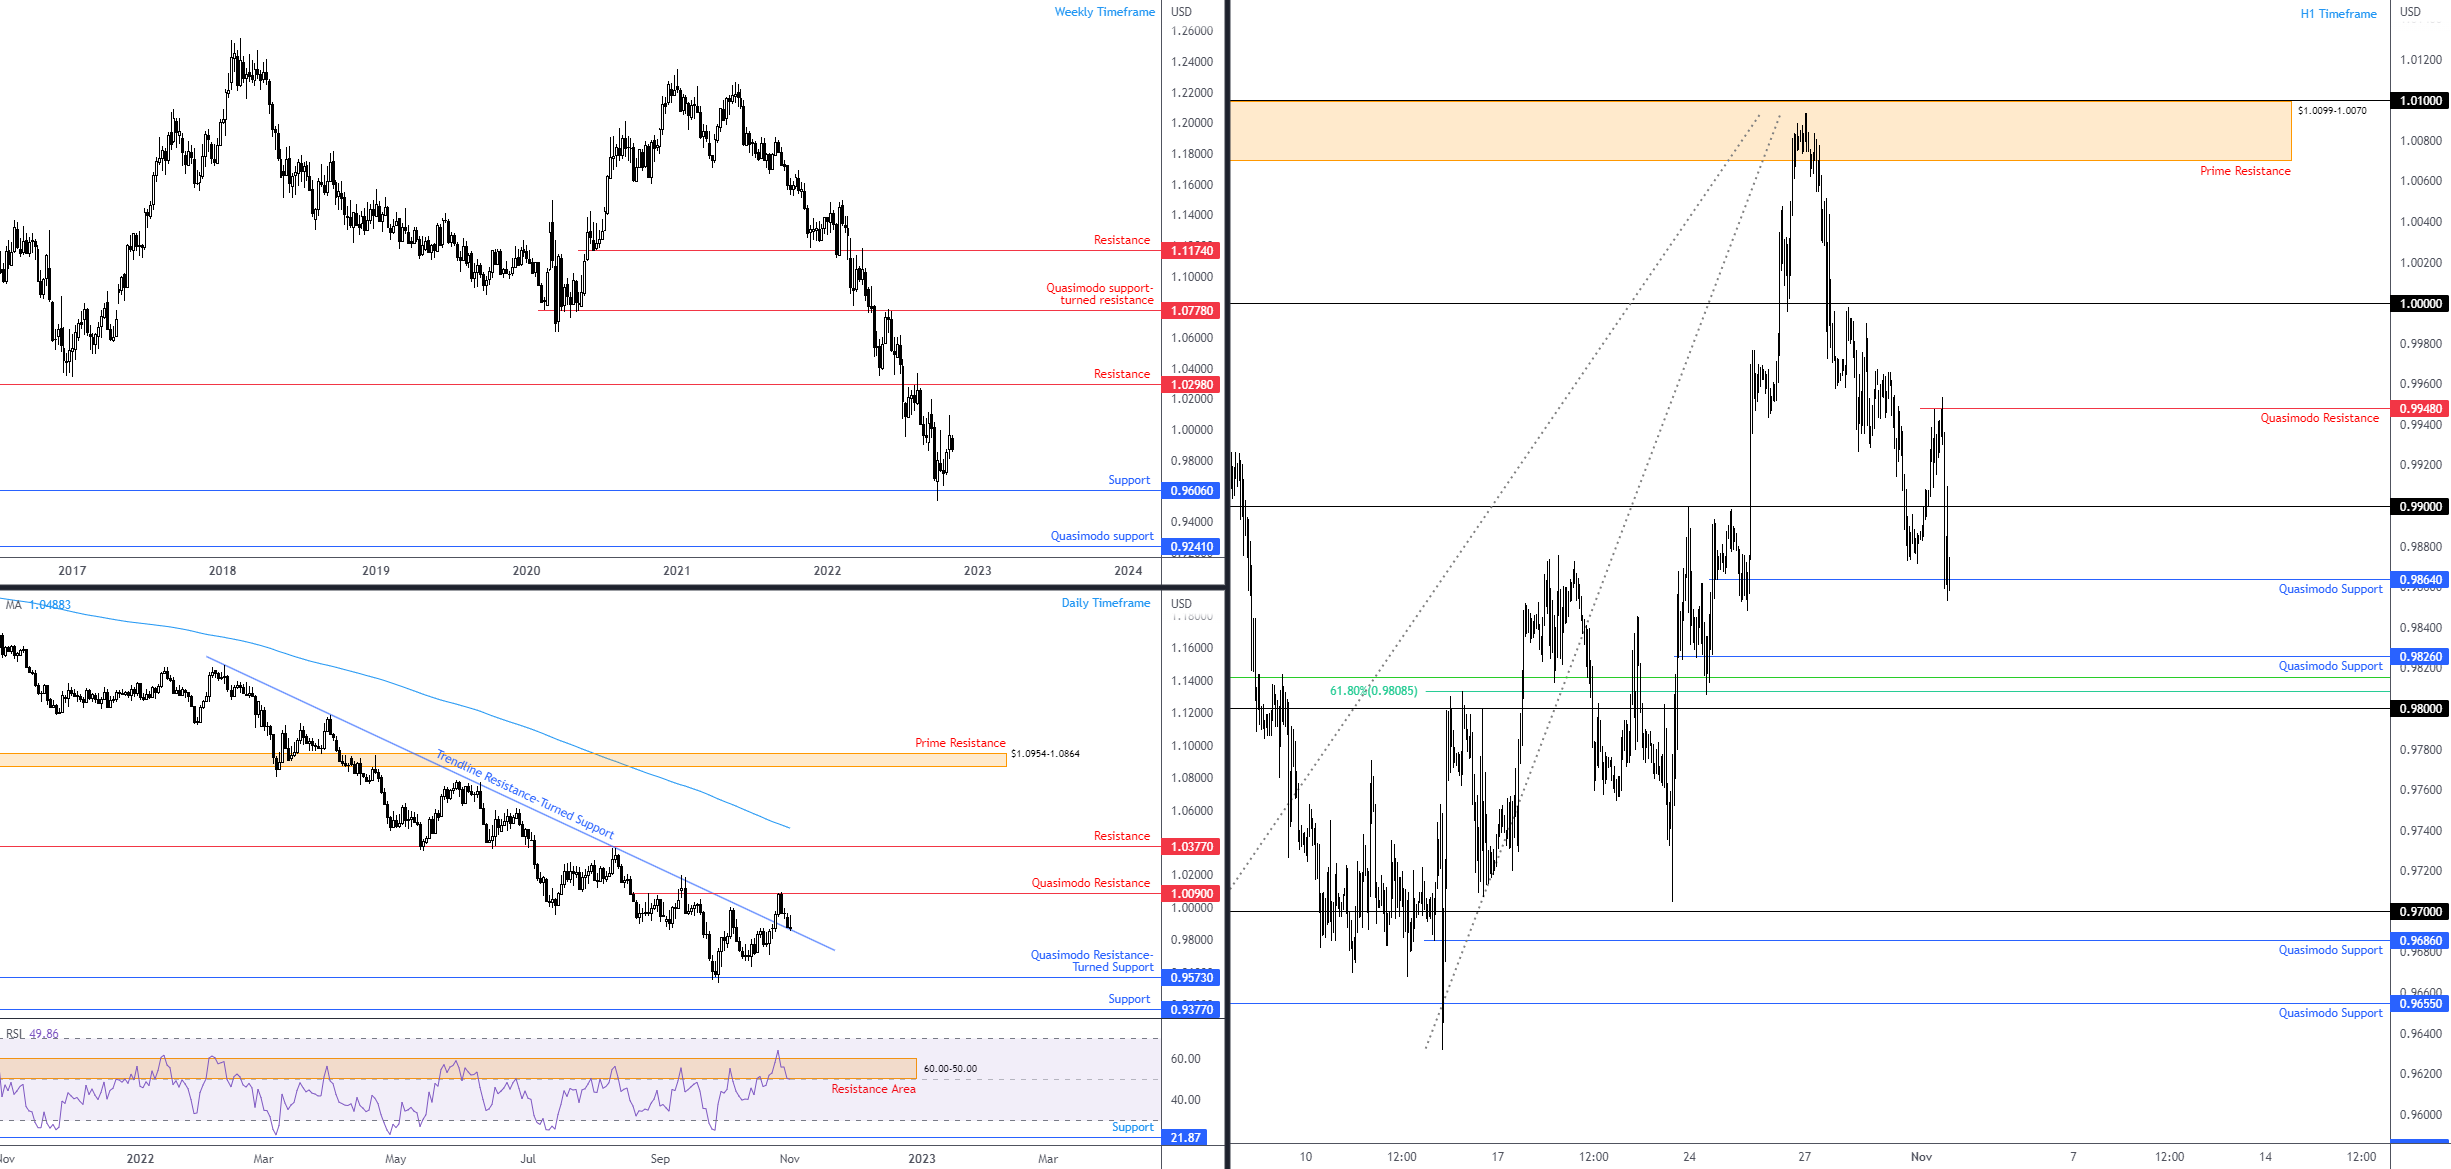
It was a tough day for the shared currency on Tuesday, concluding the session off best levels against its US counterpart. The EUR/USD, down a second consecutive day, is consequently testing the spirit of a trendline resistance-turned support on the daily timeframe, extended from the high of $1.1495. This follows last week’s rejection of daily Quasimodo resistance from $1.0090. Clearing the noted trendline support uncovers a familiar daily Quasimodo resistance-turned support coming in at $0.9753.
Front and centre, of course, however, is trend direction. Price action on the weekly timeframe has been entrenched in an unmistakable bear trend since pencilling in a top in early 2021 with heavy-handed pullbacks in short supply. Weekly support is shown at $0.9606, and resistance calls for attention at $1.0298. Aiding trend identification is the daily timeframe’s price movement continuing to work under its 200-day simple moving average ($1.0488). Adding to the bearish narrative is the daily chart’s relative strength index (RSI) retesting resistance between 60.00 and 50.00. Note that this area has been active since October 2021 and is common to view such resistance in downtrends.
Out of the H1, Tuesday burrowed through $0.99 and tested Quasimodo support at $0.9864. With the aforementioned level appearing on shaky ground, Quasimodo support at $0.9826 is poised to welcome price, closely followed by a 50% retracement ratio at $0.9816, a 61.8% Fibonacci retracement ratio at $0.9809 and the $0.98 figure.
Technical Expectation:
H1 Quasimodo support from $0.9864 is on the verge of ceding ground, a move that is supported by the overall downtrend and thus could encourage short-term breakout selling towards H1 Quasimodo support at $0.9826 and possibly the $0.98 region. As a result, this places a question mark on the daily timeframe’s trendline support.
 AUD/USD:
A top-down approach demonstrates weekly price forged a bottom a whisker above weekly demand at $0.5975-0.6166, a base that houses a 1.618% Fibonacci projection ratio at $0.6024 (an ‘alternate’ AB=CD pattern). While this did aid October, pulling the currency pair off its lows to create a monthly doji indecision candle (which could serve as a reversal signal), is it enough to encourage buyers? The trend says no, though if we see a pullback on the weekly scale, resistance is limited until $0.6673.
Price has reflected a bear trend since $0.8007 (22nd Feb high [2021]) on the weekly; the monthly timeframe has also portrayed a longer-term downtrend since August 2011, indicating the rally from the pandemic low of $0.5506 (March 2020) to a high of $0.8007 (February 2021) on the weekly timeframe is viewed as a deep pullback among chartists.
Meanwhile, on the daily timeframe, the relative strength index (RSI), a popular momentum gauge, observed a test of its 50.00 centreline in recent trading after rebounding from oversold territory. Price support is seen at $0.6212 and resistance is calling at $0.6536. A close beyond current resistance suggests strength and further buying to at least daily resistance at $0.6678 (nearby weekly resistance at $0.6673).
Short term, buyers and sellers are seen squaring off around the lower side of $0.64, echoing the possibility of a drop towards a 1.618% Fibonacci projection at $0.6350 and a 50% retracement from $0.6347, which happens to join hands with a descending channel support, drawn from the low $0.6368.
Technical Expectation:
Keeping it simple, the H1 appears comfortable under $0.64, informing market participants that sellers remain in the driving seat for the time being, targeting the $0.6350ish neighbourhood.
 USD/JPY:
Recent hours observed the USD/JPY currency reclaim ¥148+ status, following a mid-morning rebound from ¥147 during London and the help of a neighbouring H1 decision point at ¥147.55-147.81. While another retest of the said decision point could be on the table today, further outperformance shines the technical spotlight on ¥149 (H1), nestled just above tops around ¥148.82.
Higher up on the curve, weekly price scraped the lower side of Quasimodo resistance at ¥151.90 almost to the pip during October and formed a hefty upper candle shadow. While scope to record additional losses is seen to as far south as support from ¥137.23, action has been somewhat subdued since the test of the Quasimodo resistance noted above. This could have something to do with the trend, higher since 2021.
Out of the daily timeframe, last week witnessed a rebound just shy of a Quasimodo resistance-turned support from ¥144.95. Just south of here we can also see another Quasimodo support set at ¥141.60. Interestingly, though, is the daily chart’s relative strength index (RSI) double-top at 79.94. The pattern’s neckline can be seen at 56.73 (blue line) which was recently engulfed to confirm the pattern’s validity. If the indicator crosses under 50.00, this will help further confirm the pattern’s existence.
Technical Expectation:
In line with the longer-term uptrend, another test of the H1 decision point at ¥147.55-147.81 may be seen. This might mean another run on any stops residing just under ¥148, targeting the ¥149 region.
 GBP/USD:
Sterling finished on the back foot versus the US dollar on Tuesday, retreating from a session top of $1.1566 and shifting attention back to daily trendline resistance-turned support, taken from the high of $1.3643. Although room to advance is evident on the daily timeframe to resistance between $1.2178 and $1.2052 (made up of Fibonacci and other ratios), the weekly timeframe has price action testing the inside of a decision point at $1.1751-1.1413, alongside the daily chart’s relative strength index (RSI) resistance between 60.00 and 50.00, in place since February this year. This is also supported by the dominant downtrend visible on the weekly timeframe since topping at $1.4250 in June 2021.
Against the backdrop of the higher timeframes, price movement on the H1 timeframe recently recoiled higher from Quasimodo support at $1.1445. Directly above, we have a Quasimodo resistance from $1.1549, and a break of $1.1445 potentially paves the way lower to at least $1.14.
Technical Expectation:
Trend direction favouring sellers and the weekly timeframe’s decision point at $1.1751-1.1413 in play signals a drop lower could be in the offing for the GBP/USD currency pair. This means a possible drop through H1 Quasimodo support at $1.1445 to test $1.14. Alternatively, additional recovery gains from the current H1 Quasimodo support could see the unit test and REJECT H1 Quasimodo resistance at $1.1549.
 DISCLAIMER:
The information contained in this material is intended for general advice only. It does not take into account your investment objectives, financial situation or particular needs. FP Markets has made every effort to ensure the accuracy of the information as at the date of publication. FP Markets does not give any warranty or representation as to the material. Examples included in this material are for illustrative purposes only. To the extent permitted by law, FP Markets and its employees shall not be liable for any loss or damage arising in any way (including by way of negligence) from or in connection with any information provided in or omitted from this material. Features of the FP Markets products including applicable fees and charges are outlined in the Product Disclosure Statements available from FP Markets website, www.fpmarkets.com and should be considered before deciding to deal in those products. Derivatives can be risky; losses can exceed your initial payment. FP Markets recommends that you seek independent advice. First Prudential Markets Pty Ltd trading as FP Markets ABN 16 112 600 281, Australian Financial Services License Number 286354.


 Access +10,000 financial
instruments
Access +10,000 financial
instruments