
Having a way to identify the market’s ebb and flow is essential.
Support and resistance considered a foundation of technical analysis, represent horizontal lines, serving as a tool to map price movement, and, ultimately, estimate future direction on bar or candlestick charts (there are other chart types available, though these are the most common).
Aside from technical indicators, support and resistance strategies are generally one of the first concepts Forex traders discover.
While simple in nature, various interpretations of support and resistance exist, some more accurate than others.
Pin-Point Support and Resistance
Trading the financial markets is rarely precise.
Times when support and resistance offer near pin-point levels, therefore, should not be overlooked.
Pin-point support and resistance involve locating traditional swing highs/lows, void of bulky whipsaws.
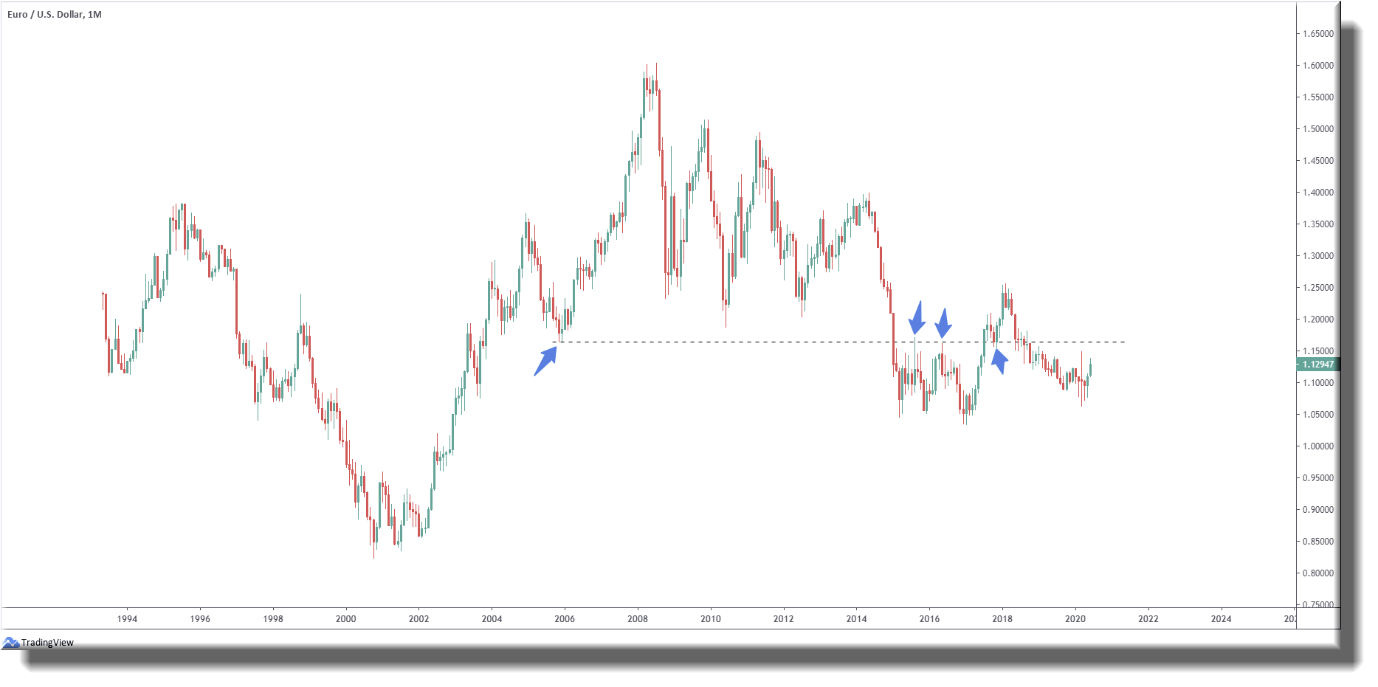
Figure 1. A offers an interesting example on EUR/USD’s monthly chart.
The initial swing low formed in November 2005 at 1.1641, followed through to record peaks in July of 2008 reaching 1.6038. This is a significant swing low and extending a line to the right from here proved interesting. The barrier, as you can see, was violated in early 2015 and invited back-to-back retests as resistance in August 2015 and May of 2016.
For some, the first retest may have been sufficient to validate the level for possible shorting opportunities at the second retest, which was formed by way of a bearish outside candlestick pattern. The optimal entry, according to historical testing, however, was the retest as support in October 2017, forged in the shape of a bullish outside candle pattern. Why here? The level validated itself as support and resistance, proving its worth. This gives traders confidence a clear level has been respected on both sides of the market and may do so again if retested in the future, as was the case in figure 1.A.
(FIGURE 1.A)
The pin-point approach not only works well on longer-term charts, but historical testing also found lower-timeframe levels particularly accurate, too.
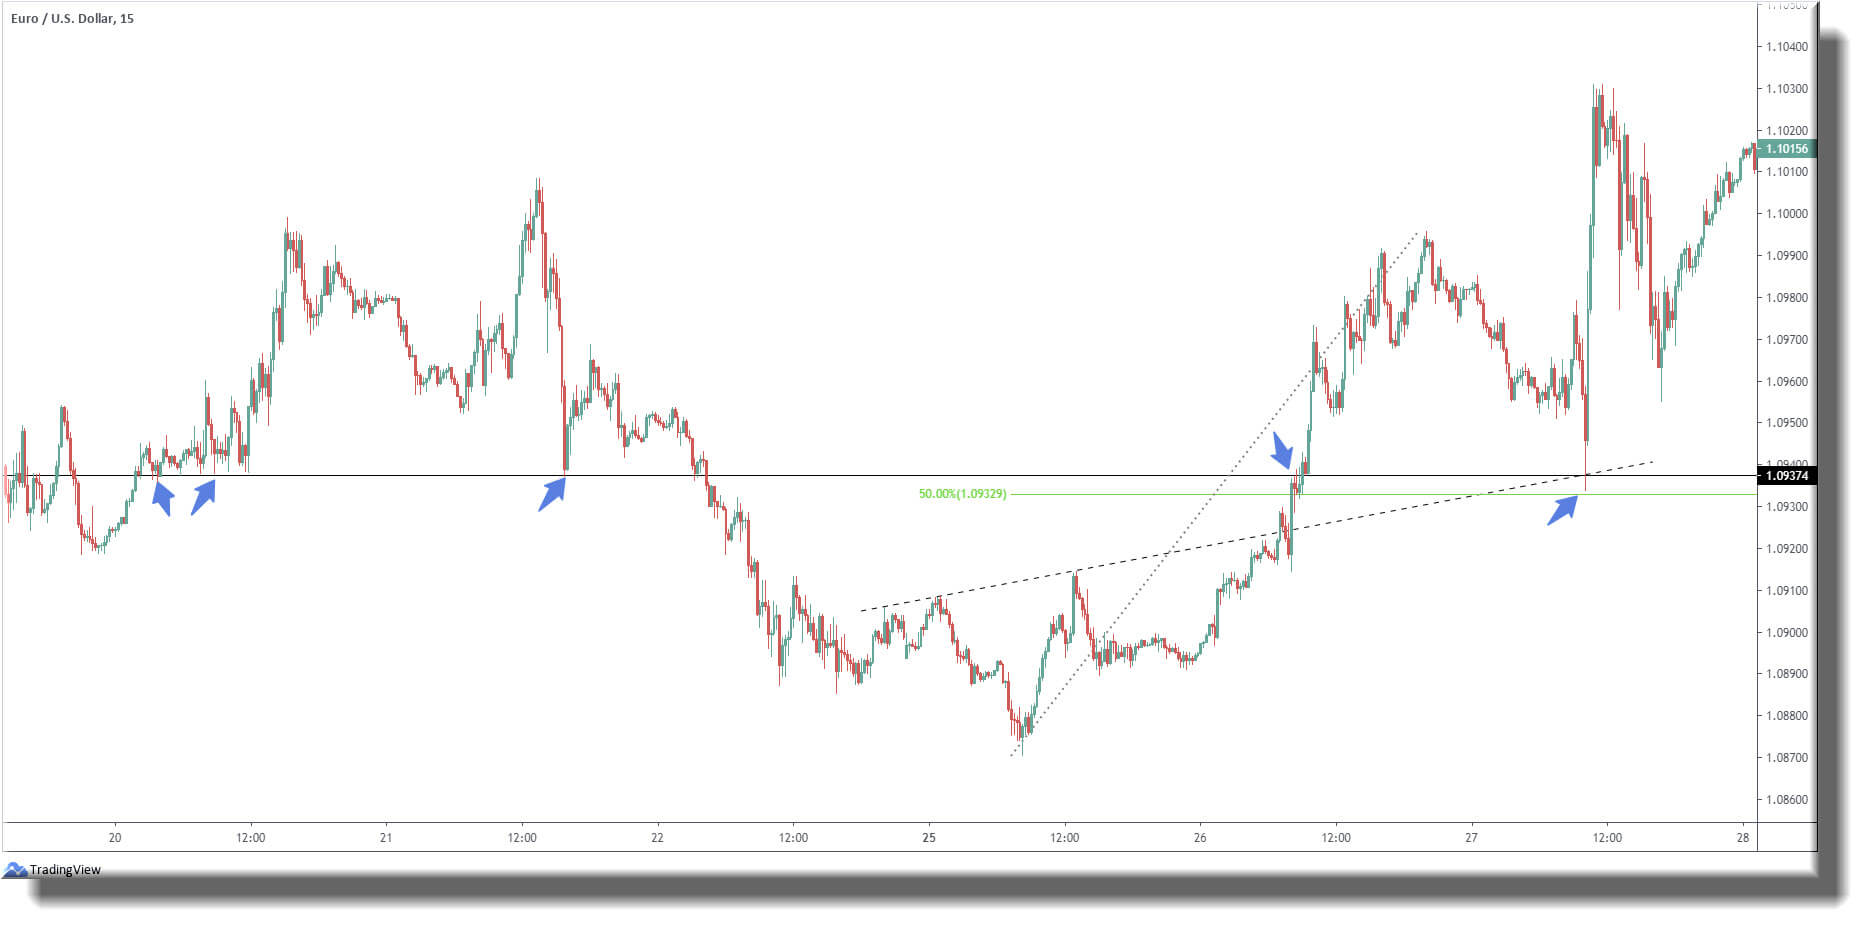
Figure 1.B illustrates a EUR/USD 15-minute chart displaying clear support and resistance at 1.0937. Readers will note support formed between May 20 and 21, with a brief flicker of activity as resistance on May 26. Shortly after, our level was retested as support on May 27. This was our entry, having already seen support and resistance prove itself.
Additional confluence can also be seen here in the form of trendline support (prior resistance) and a 50.00% Fibonacci retracement at 1.0932, essentially providing an extra floor. Confluence can be powerful.
(FIGURE 1.B)
Round Numbers
Trading psychology plays a huge factor in trading and can be viewed on the charts.
Round numbers are price levels ending in .00 or .50. So, 1.1500 or 1.1550.
Traders are attracted to round numbers on charts, often initiating a spike in trading activity at these barriers. The concept is easily explained through everyday life examples, as humans tend to round numbers to simplify things. For instance, if someone asked you the time and it was 11.27 am, you’d likely reply 11.30 am, or half-past eleven. Traders do the same with price levels.
Fading round numbers and attempting to forecast breakouts are popular trading strategies. These levels also bode well with traders as they’re objective.
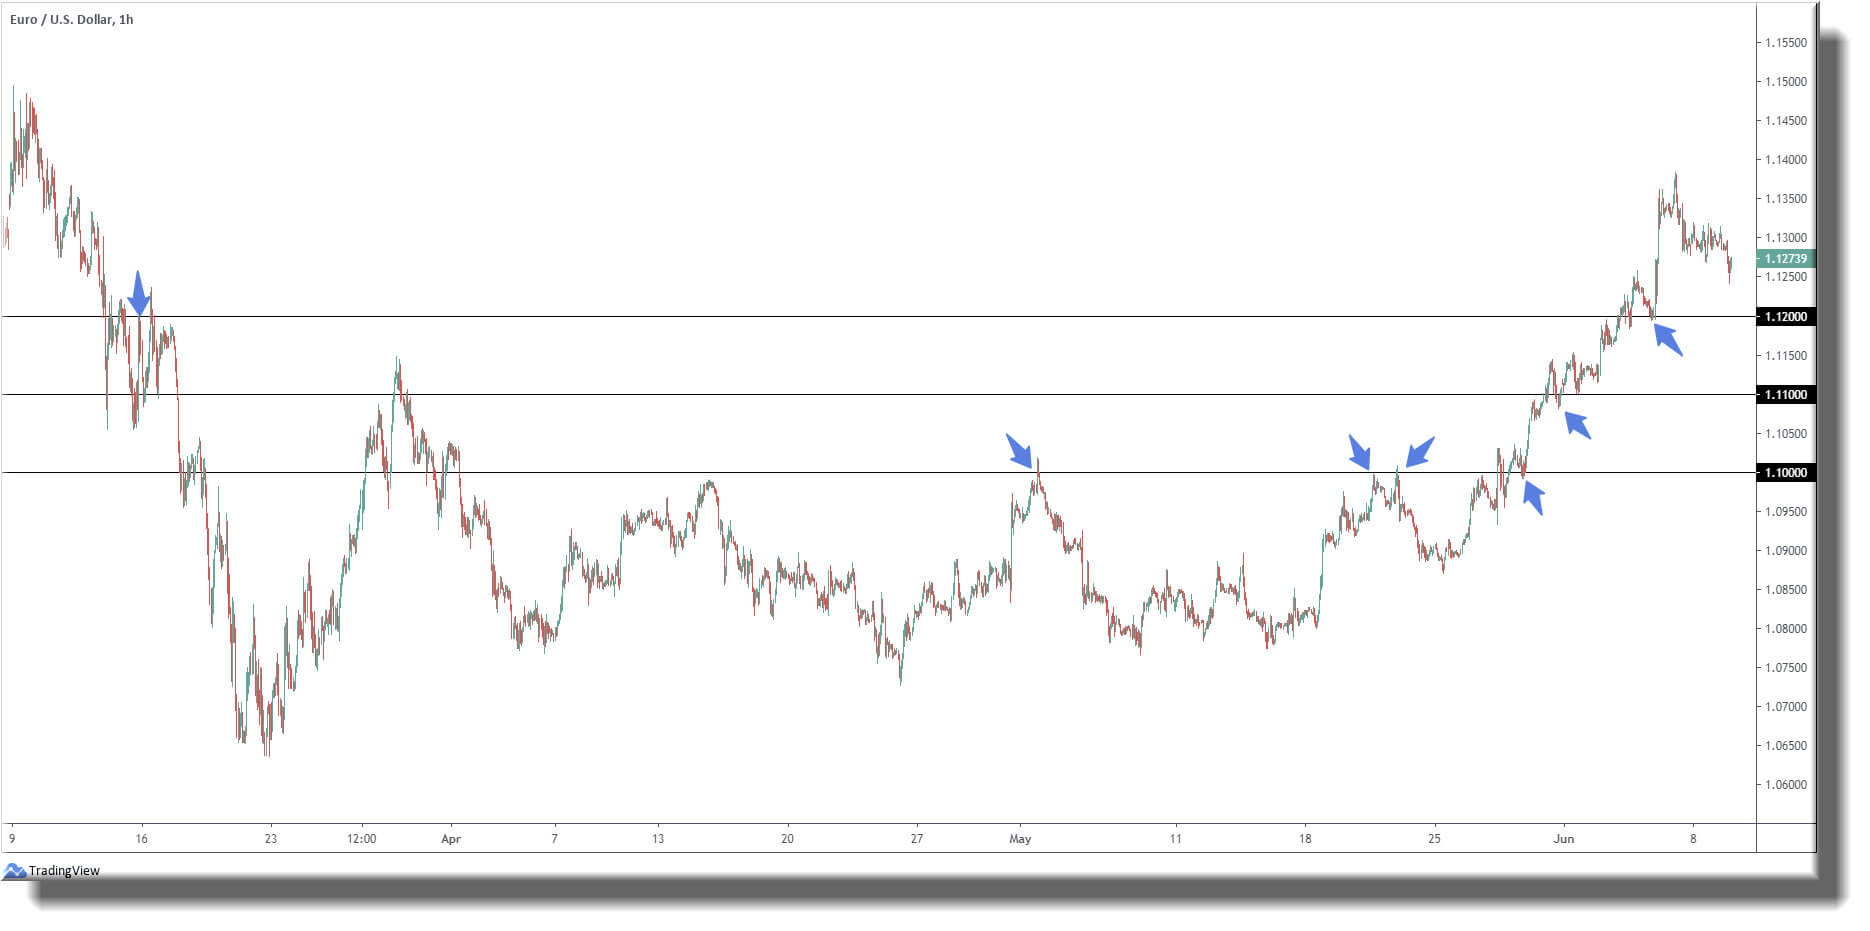
As shown in figure 1.C, the EUR/USD H1 chart, 1.10, a widely watched key figure, capped upside on a number of occasions throughout May. However, heading into the close of the month we shifted to support after a price break to the upside was observed.
1.11, in early June, also held as support after giving way as resistance. The same occurred at 1.12.
(FIGURE 1.C)
Psychological round numbers seldom provide to-the-pip reactions. This can catch newer traders off guard, believing round numbers are definite support and resistance levels.
Whipsaws forming around psychological levels are common.
The entire market can see these levels, hence a collection of orders tend to congregate around these price points.
For example, price approaching 1.10 from below has sell limit orders fixed at the round number for that forecasting resistance, with protective stop-loss orders set above. On the other side, breakout buyers set buy-stop entry orders above the round number, expecting the level to give way and price continue higher.
Is there a way to predict this movement at round numbers with 100% accuracy? No. Though there are techniques to help. One such approach is if a supply or demand area (preferably a fresh zone) is sited 10/20 pips above/below the round number. This generally suggests a fakeout scenario may unfold.
Supply and demand areas can be defined in a number of different ways. A basic interpretation is a zone that produced a sizeable move in either direction.
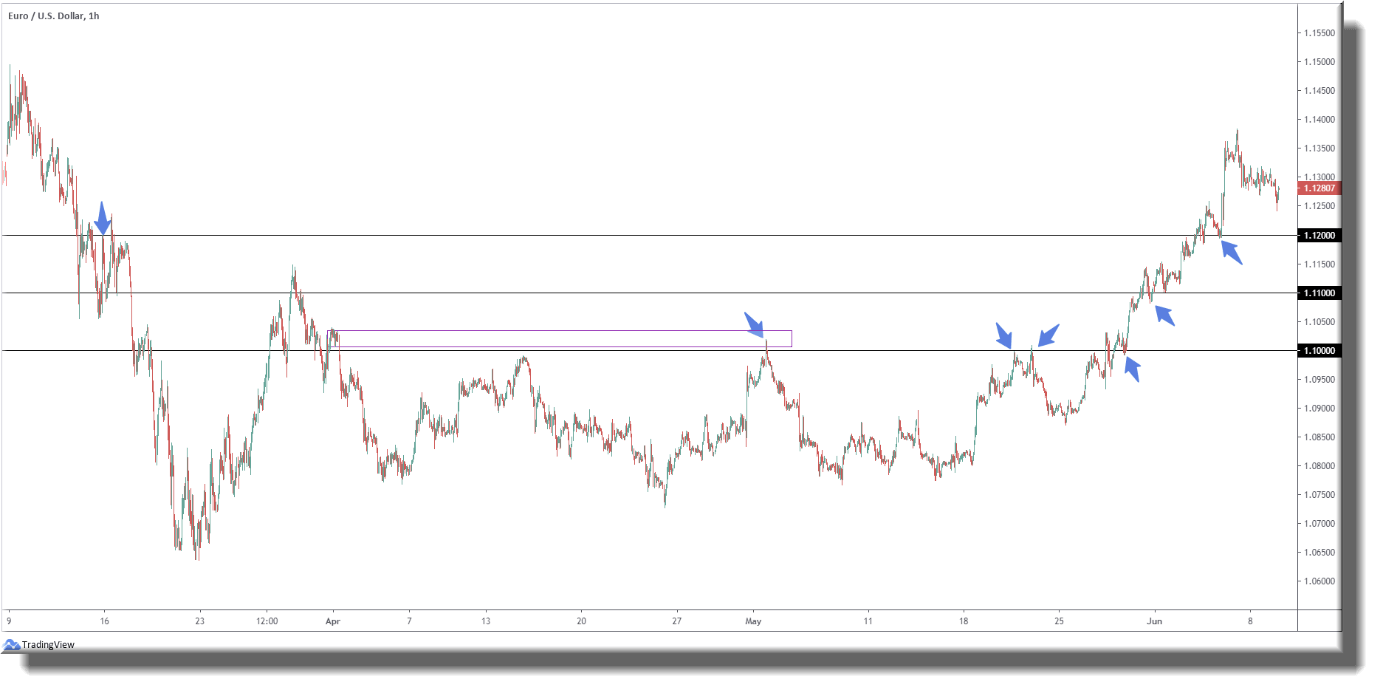
Figure 1.D shows a supply zone hovering above the 1.10 level. May, as you can see, witnessed a clear-cut whipsaw through 1.10, a move that crashed into supply before turning lower. What this did was trip protective stop-loss orders from sellers attempting to fade 1.10 and simultaneously cause a bull trap (breakout traders).
(FIGURE 1.D)
Dynamic Support and Resistance
One of the most successful methods of identifying trending markets comes from moving averages, a constant period average calculated for each successive chart period interval. Moving averages effectively dampen the effects of short-term oscillations. For example, a 50-day moving average is an individual value representing the price levels for the previous 50 days. Although the simple moving average is commonly used (SMA), traders also regularly employ the exponential moving average (EMA), a value that places greater emphasis on most recent data points. Both values are calculated using closing prices.
Aside from determining the trend, usually defined by price action closing above/below the moving average, moving averages also serve as dynamic support and resistance levels. As displayed in figure 1.E, the same EUR/USD H1 chart used in figure 1.D, the 200-day simple moving average is applied.
Although not perfect, like most things in trading, the moving average offered support/resistance on several occasions. Heading into the later stages of May was particularly impressive. We conquered the moving average on May 18 in dominant fashion, confirming the trend may be changing to the upside, and later retested the value as support. Traders long this move are still likely holding, 400 pips later.
For identifying long-term support and resistance levels and overall trends, the 50-day, 100-day, and 200-day moving averages are most common. Short-term support/resistance and trend changes can be found using the 5, 10, and 20-day moving averages.
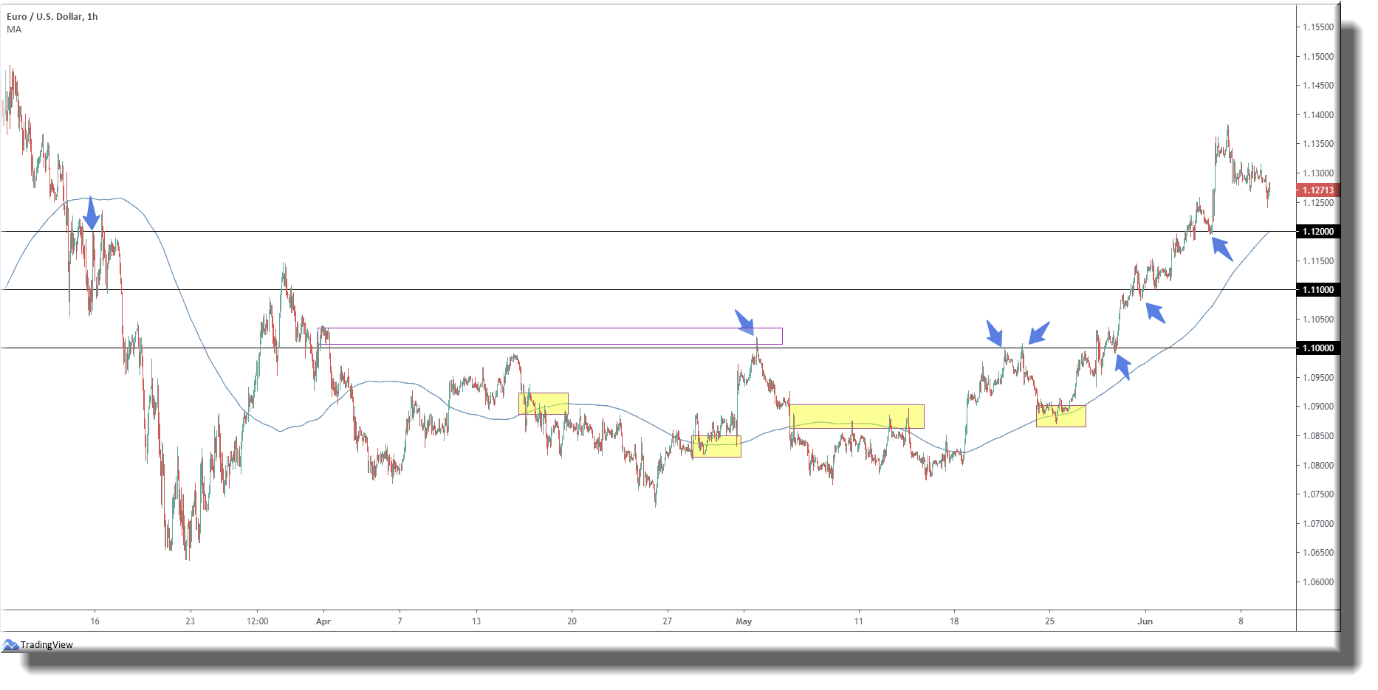
(FIGURE 1.E)
Going Forward
Support and resistance levels communicate different things to different traders. Some are subjective, some objective.
The key is to master one approach and build from there.
Why not consider test driving a couple of the methods shown here on one of our demo accounts.
DISCLAIMER: The information contained in this material is intended for general advice only. It does not take into account your investment objectives, financial situation, or particular needs. FP Markets has made every effort to ensure the accuracy of the information as at the date of publication. FP Markets does not give any warranty or representation as to the material. Examples included in this material are for illustrative purposes only. To the extent permitted by law, FP Markets and its employees shall not be liable for any loss or damage arising in any way (including by way of negligence) from or in connection with any information provided in or omitted from this material. Features of the FP Markets products including applicable fees and charges are outlined in the Product Disclosure Statements available from FP Markets website, www.fpmarkets.com, and should be considered before deciding to deal with those products. Derivatives can be risky; losses can exceed your initial payment. FP Markets recommends that you seek independent advice. First Prudential Markets Pty Ltd trading as FP Markets ABN 16 112 600 281, Australian Financial Services License Number 286354.


 Access +10,000 financial
instruments
Access +10,000 financial
instruments