
EUR/USD:
Monthly timeframe:
(Technical change on this timeframe is often limited though serves as guidance to potential longer-term moves)
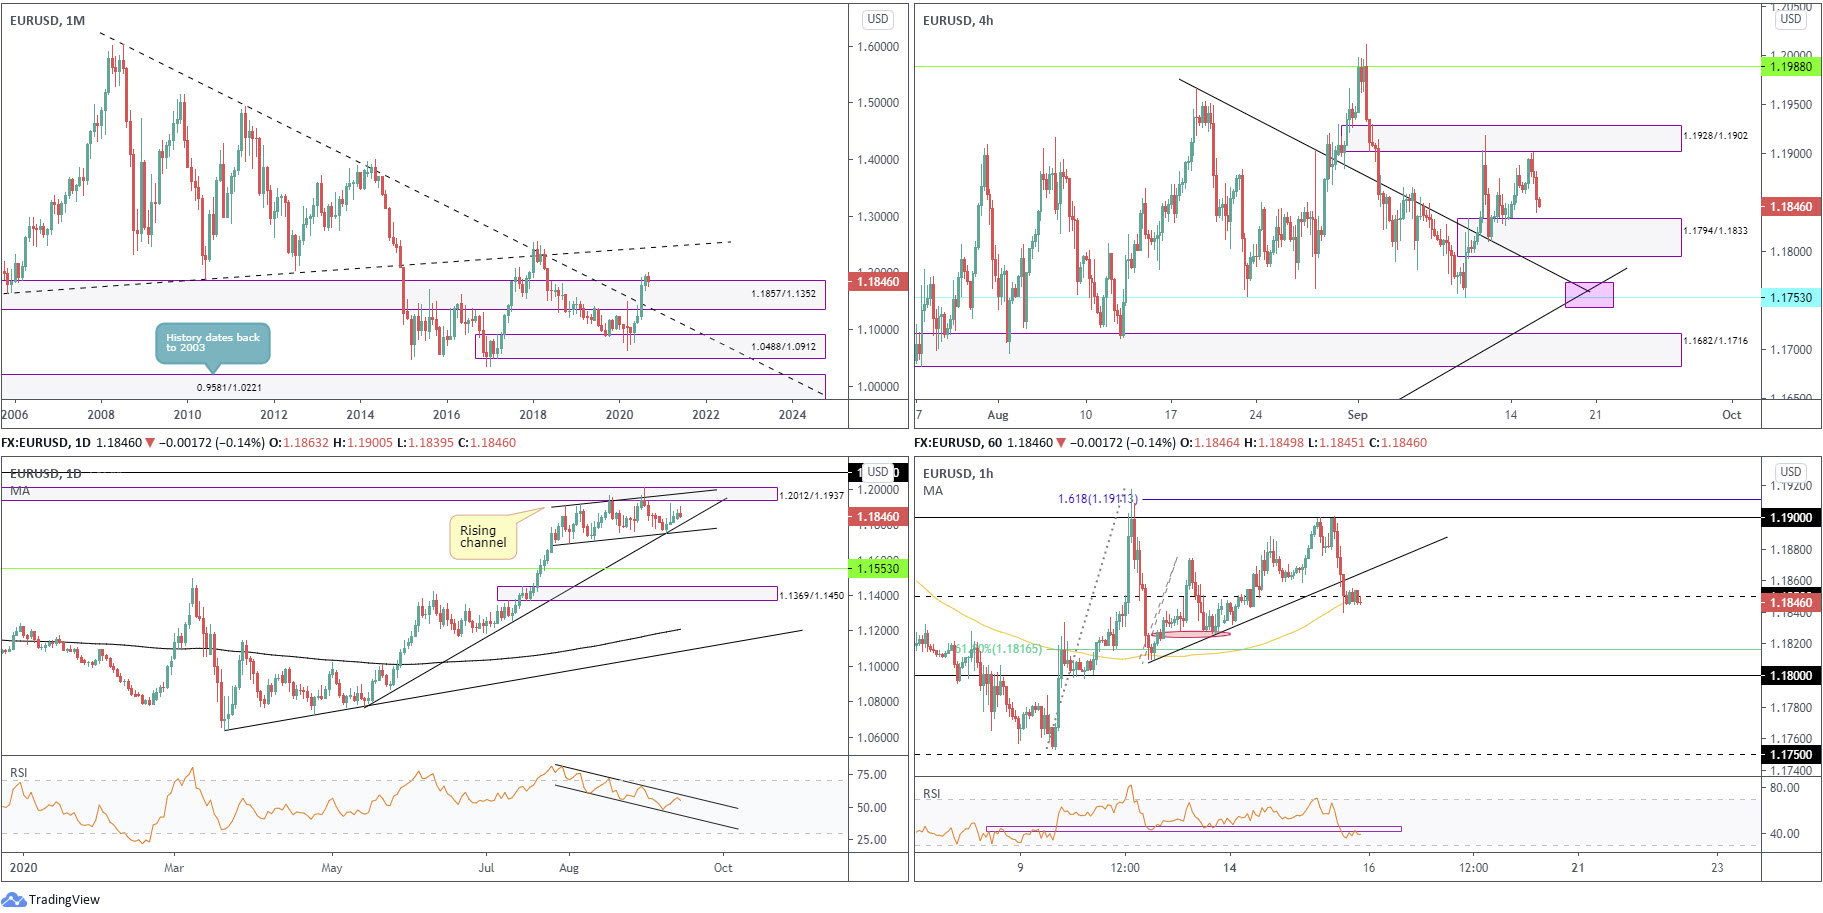
August saw the euro nudge to a fourth successive monthly gain against the US dollar, adding nearly 1.5 percent. The move toppled supply from 1.1857/1.1352 and extended space north of long-term trendline resistance (1.6038), arguing additional upside may be on the horizon, targeting trendline resistance (prior support – 1.1641). Despite this, the primary downtrend (since July 2008) remains intact until 1.2555 is engulfed (Feb 1 high [2018]).
Daily timeframe:
Partially altered from previous analysis –
Price remains contained within the parapets of a rising channel pattern (1.1695/1.1909), and is also hampered by supply at 1.2012/1.1937, extended from May 2018. Following last week’s modest recovery from the aforesaid channel support, aided by trendline support (1.0774), the pair retreated Tuesday, ending the session by way of a shooting star candlestick pattern, generally considered a bearish signal at peaks.
Based on the daily timeframe, trend traders will also note that alongside monthly price violating long-term structure, EUR/USD has trended higher since late March. With respect to the RSI indicator, we crossed back above 50.00 last week, rebounding from a month-long channel support with the value now poised to retest channel resistance.
H4 timeframe:
Partially altered from previous analysis –
Demand stationed at 1.1794/1.1833 maintains position on the H4 timeframe, as does supply at 1.1928/1.1902. The former represents a reasonably significant zone, a rally-base-rally area where a decision was made to break the 1.1865 September 4 peak.
Trendline support (prior resistance – 1.1965) and another trendline support from 1.1185, as well as support at 1.1753, are next to come under fire should sellers push for control. The area coloured pink offers interesting confluence. Above current supply, nonetheless, resistance at 1.1988 will likely be monitored.
H1 timeframe:
Sellers embraced 1.19 resistance on Tuesday, a psychological barrier exhibiting strong S/R qualities since July. The intraday sell-off toppled trendline support (1.1810) and welcomed 1.1850 support along with the 100-period simple moving average at 1.1848.
Demand is seen around 1.1826 (red oval), located just ahead of a 61.8% Fib level at 1.1816 and the 1.18 level.
Also interesting is the RSI oscillator seen retesting the underside of a clear S/R zone around 45.00.
Structures of Interest:
The monthly timeframe suggests buyers could push beyond supply at 1.1857/1.1352, though daily supply at 1.2012/1.1937 could hinder upside attempts.
H1 appears set to make a run for the 61.8% Fib level at 1.1816, yet the upper base of H4 demand at 1.1833 poses a possible threat to intraday selling under 1.1850.
1.1753 support on the H4 timeframe is interesting, not only due to its H4 confluence, but because the level unites closely with daily channel support.
AUD/USD:
Monthly timeframe:
(Technical change on this timeframe is often limited though serves as guidance to potential longer-term moves)
July’s rally, coupled with August’s 3.3% follow-through, witnessed supply at 0.7029/0.6664 and intersecting long-term trendline resistance (1.0582) abandon its position. Technically, buyers appear free to explore as far north as 0.8303/0.8082 in the coming months, a supply zone aligning closely with trendline resistance (prior support – 0.4776).
While price has indeed removed trendline resistance and supply, traders might still want to take into account the primary downtrend (since mid-2011) remains south until breaking 0.8135 (January high [2018]).
Daily timeframe:
Brought forward from previous analysis –
- Demand at 0.7131/0.7192 (a drop-base-rally area) remains in play.
- Support at 0.7067 is seen should we push through the aforesaid demand.
- Supply at 0.7453/0.7384 can be found to the upside, an area which recently capped YTD peaks at 0.7413.
- The trend, according to the daily timeframe, has emphasised a positive tone since bottoming in late March.
- Indicator-based traders may also recognise the RSI holds support at 53.00, a clear S/R level since October 2019.
H4 timeframe:
Supply at 0.7300/0.7282 relinquished ground Tuesday, allowing for price to greet supply at 0.7339/0.7357, a prior demand zone.
A decisive rejection from 0.7339/0.7357 was seen, enough to force a 0.7300/0.7282 retest. Removing the latter calls for a reconnection with trendline support (0.7076) and demand at 0.7186/0.7207. A reaction back to the upside, on the other hand, may eventually cross paths with supply at 0.7433/0.7414 (inhabits daily supply at 0.7453/0.7384).
H1 timeframe:
0.73 surrendered its position heading into early trading on Tuesday, delivering candles to supply coming in from 0.7346/0.7333 (fastened to the lower edge of the H4 supply at 0.7339/0.7357) as European traders started entering the market. The US session, as you can see, probed higher into the zone to bring in sellers from the 161.8% Fib ext. level at 0.7339. This directed a precipitous decline to 0.73, which held into the close.
The 100-period simple moving average, a dynamic value that has offered support since late last week, is waiting to welcome price should 0.73 give way. Beyond here, 0.7250 is likely to make a show.
RSI support is also seen at around the 39.00 region.
Structures of Interest:
Monthly action forecasts further buying over the coming months to 0.8303/0.8082. Daily price proposes AUD/USD may push for supply at 0.7453/0.7384, should demand at 0.7131/0.7192 hold. Dips could find 0.7067 support.
The above, alongside H1 holding 0.73 and H4 testing demand at 0.7300/0.7282, echoes a bullish vibe heading into Wednesday’s session.

USD/JPY:
Monthly timeframe:
(Technical change on this timeframe is often limited though serves as guidance to potential longer-term moves)
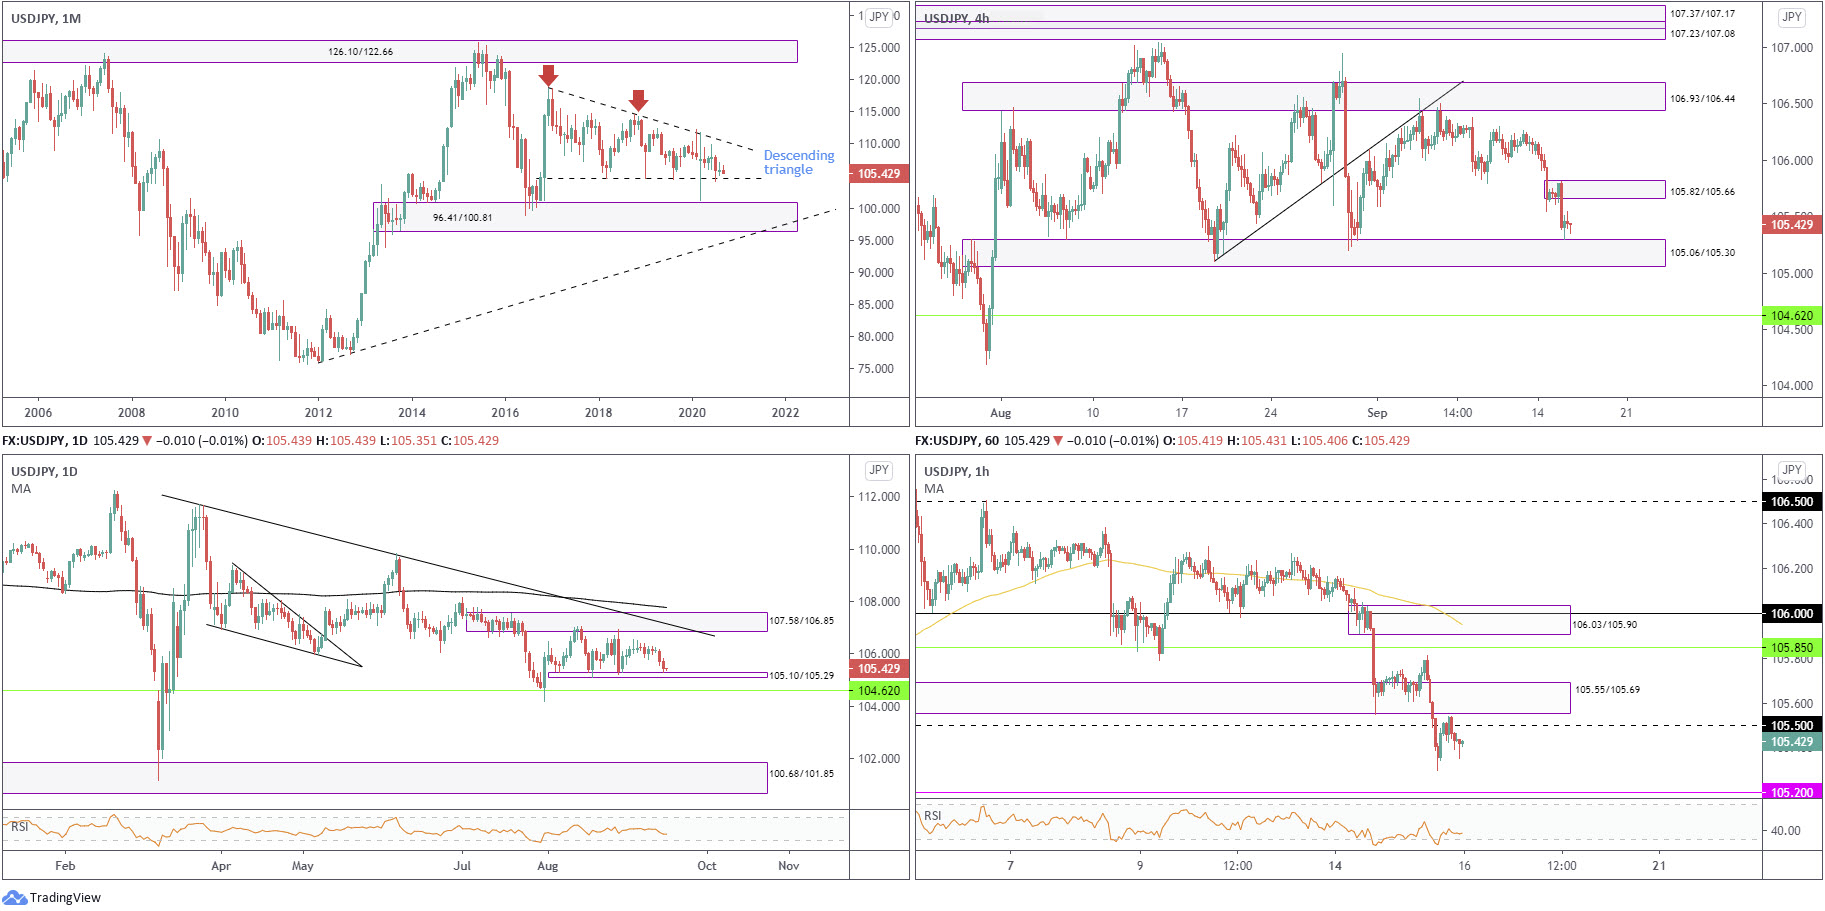
Since kicking off 2017, USD/JPY has been carving out a descending triangle pattern between 118.66/104.62. July sunk nearly 2 percent, testing the lower boundary of the descending triangle, while August ended off best levels, effectively unmoved.
Areas outside of the noted triangle can be seen at supply from 126.10/122.66 and demand coming in at 96.41/100.81.
Daily timeframe:
Partially altered from previous analysis –
Supply from 107.58/106.85 proved a tough nut to crack in August, an area demonstrating a close connection with trendline resistance from 111.71. The aforesaid areas, alongside a narrow support area at 105.10/105.29, has carved out an active range. Note the latter was tested in recent trading after the pair recorded its second successive daily decline.
Outside of the consolidation, the 200-day simple moving average at 107.77 is seen to the upside, while lower on the curve monthly support at 104.62 can be found.
With reference to the RSI, we still remain pretty neutral right now, though we did marginally nudge under 50.00 to test the 40.00 area.
H4 timeframe:
USD/JPY challenged demand at 105.06/105.30 (prior supply) Tuesday, with the decline also establishing a fresh drop-base-drop supply area at 105.82/105.66.
Should we journey through 105.06/105.30, which, as you can see, is a notable demand, monthly support at 104.62 is marked as a potential downside target.
H1 timeframe:
Leaving resistance at 105.85 and supply at 106.03/105.90 unopposed, the pair worked through demand at 105.55/105.69 heading into US trading Tuesday, movement that also breached 105.50 support. Recent hours saw price retest the latter which is holding as resistance, projecting a possible continuation move to 105.20 support.
The RSI oscillator is seen struggling to secure position out of oversold territory.
Structures of Interest:
Committing to a bearish position from 105.50 in hope that price reaches 105.20 H1 support could find opposition from the upper edge of H4 demand at 105.30 and daily support around 105.29. This implies we may retake 105.50 to the upside today and tackle H1 supply at 105.55/105.69.
GBP/USD:
Monthly timeframe:
(Technical change on this timeframe is often limited though serves as guidance to potential longer-term moves)
Leaving trendline resistance taken from 2.1161 unopposed, September currently trades lower by 3.6%, on track to retest trendline support (prior resistance – 1.7191).
Interestingly, the primary trend has faced lower since early 2008, unbroken until 1.4376 gives way – April 2 high 2018.
Daily timeframe:
Demand at 1.2645/1.2773 (houses the 200-day simple moving average at 1.2730) recently made a show and is, as you can see, currently generating enough curiosity for price to tackle nearby supply at 1.3021/1.2844 (prior demand).
The RSI indicator bottomed ahead of oversold territory, displaying signs the value could retest 50.00. Further to this, we’re also seeing hidden bullish divergence.
H4 timeframe:
With the pair chalking up a second successive daily gain Tuesday, some traders are likely betting on an advance to resistance at 1.2950, with a break uncovering supply at 1.3055/1.3018.
Failure to reach the aforesaid zones unlocks potential moves to support at 1.2742 and a 61.8% Fib level at 1.2720 (green).
H1 timeframe:
From 1.2773 and 1.2863, a bearish flag is in the process of forming. The combination of resistance at 1.2919 and the 1.29 level have capped recent upside attempts. This could force a 1.2850 support breach and, by extension, a flag break.
Alternatively, the H1 candles could continue to compress within the bearish flag until crossing paths with supply at 1.2995/1.2962 (and the round number 1.30).
In addition to the above, we also have RSI trendline support in play.
Structures of Interest:
Partially altered from previous analysis –
Monthly price suggests we could be heading for further losses until around 1.26 (monthly trendline support). Daily price, however, suggests bulls are gaining confidence from demand at 1.2645/1.2773, attacking supply from 1.3021/1.2844.
H4 shows room to approach 1.2950 resistance, implying H1 could indeed continue pushing higher within its bearish flag until reaching supply at 1.2995/1.2962. It is here technicians will anticipate selling activity.

DISCLAIMER:
The information contained in this material is intended for general advice only. It does not take into account your investment objectives, financial situation or particular needs. FP Markets has made every effort to ensure the accuracy of the information as at the date of publication. FP Markets does not give any warranty or representation as to the material. Examples included in this material are for illustrative purposes only. To the extent permitted by law, FP Markets and its employees shall not be liable for any loss or damage arising in any way (including by way of negligence) from or in connection with any information provided in or omitted from this material. Features of the FP Markets products including applicable fees and charges are outlined in the Product Disclosure Statements available from FP Markets website, www.fpmarkets.com and should be considered before deciding to deal in those products. Derivatives can be risky; losses can exceed your initial payment. FP Markets recommends that you seek independent advice. First Prudential Markets Pty Ltd trading as FP Markets ABN 16 112 600 281, Australian Financial Services License Number 286354.


 Access +10,000 financial
instruments
Access +10,000 financial
instruments