
EUR/USD:
Monthly timeframe:
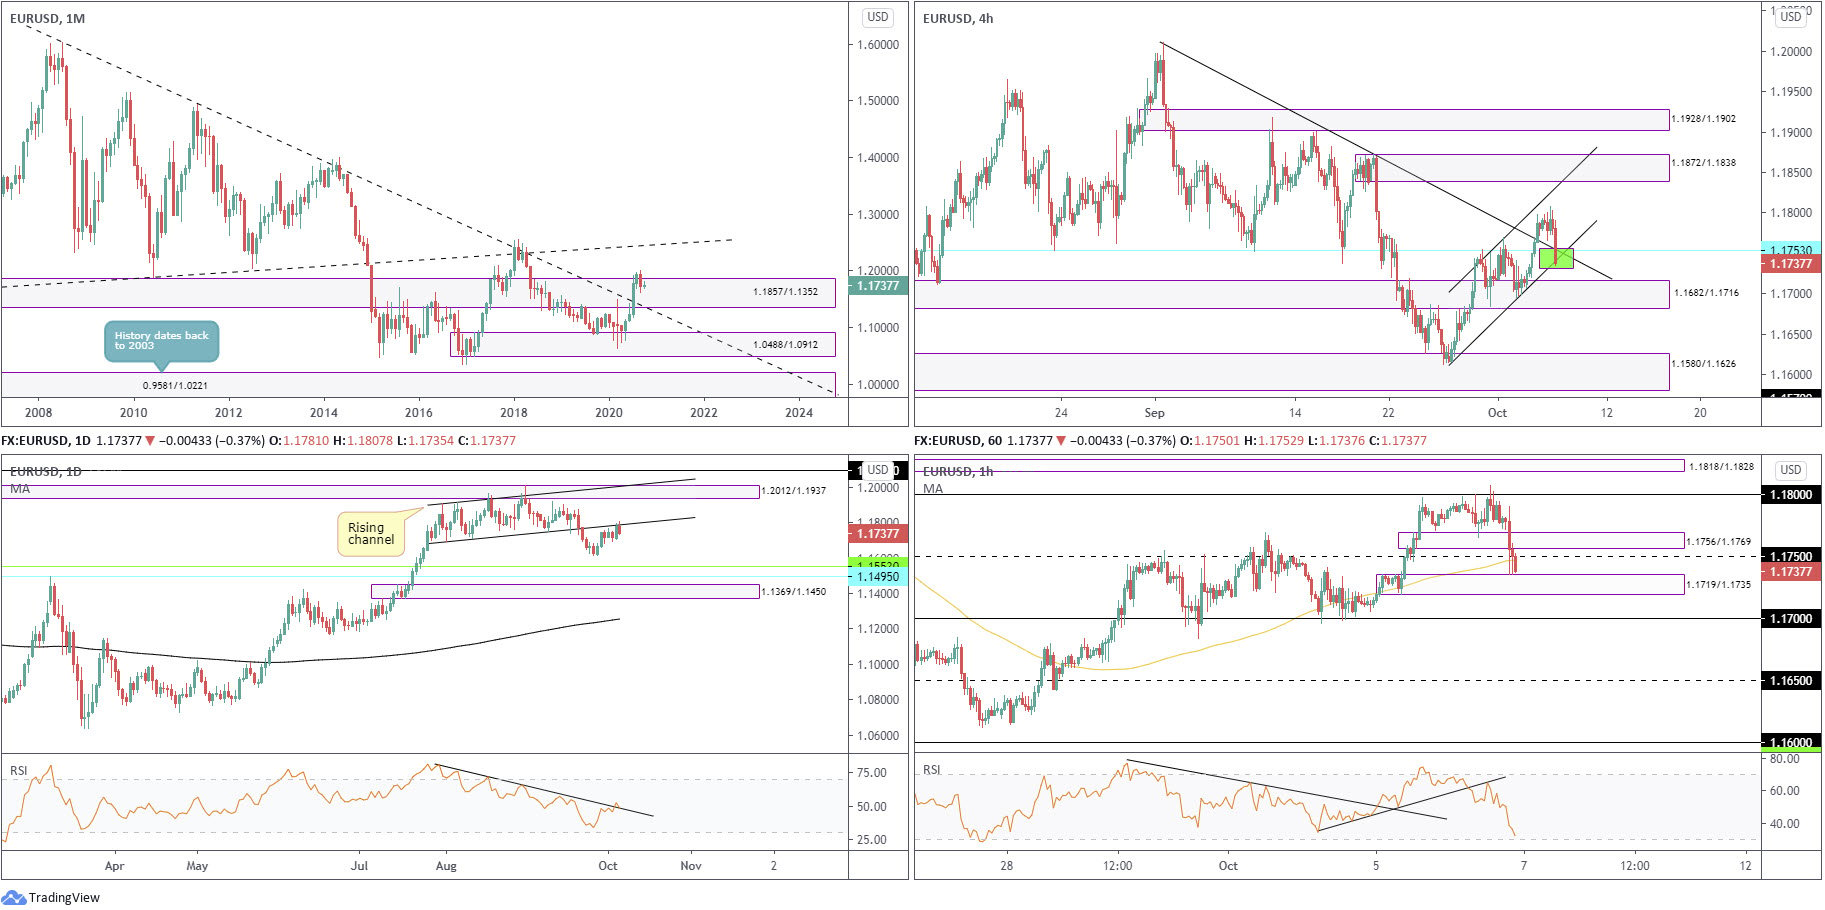
(Technical change on this timeframe is often limited though serves as guidance to potential longer-term moves)
August, as you can see, toppled supply from 1.1857/1.1352 and extended space north of long-term trendline resistance (1.6038), arguing additional upside may be on the horizon, targeting trendline resistance (prior support – 1.1641).
Trading in September, however, concluded lower by 1.8 percent, snapping a four-month winning streak and establishing an outside reversal candle pattern. This refocuses attention on the recently penetrated trendline resistance (support).
The primary downtrend (since July 2008) remains intact until 1.2555 is engulfed (Feb 1 high [2018]).
Daily timeframe:
Partially modified from previous analysis –
Channel resistance (prior support – 1.1695) recently made an arrival. A pivotal rejection from here rolls supports at 1.1553 and 1.1495 in focus, located just under 1.1612 (September 25 low) and also pinned just north of demand at 1.1369/1.1450.
The RSI oscillator is seen tackling the 50.00 region and trendline resistance.
H4 timeframe:
The euro crossed into negative numbers against the US dollar Tuesday, weighed by US President Donald Trump announcing intentions to walk away from COVID relief talks.
EUR/USD, as you can see, currently addresses a noteworthy zone of support (green), composed of channel support (1.1616), support at 1.1753 and trendline support (prior resistance – 1.2011). Aside from local peaks, supply at 1.1872/1.1838, a rally-base-drop formation, is seen as the next upside objective, uniting with channel resistance (1.1769).
H1 timeframe:
Demand at 1.1756/1.1769 suffered a hit in the recent sell-off, with price also whipsawing through the 1.1750 support/100-period simple moving average to challenge demand at 1.1719/1.1735.
Beyond the aforesaid demand, the 1.17 level is marked as the next available support.
As for the RSI, we can see the value retested the underside of a broken trendline support and ended the session closing in on oversold territory.
Structures of Interest:
Partially modified from previous analysis –
Longer term, despite taking out the upper edge of monthly supply at 1.1857/1.1352, September’s depreciation echoes the possibility of further declines to retest the recently penetrated monthly trendline. Daily price also currently supports the monthly timeframe’s potential drop after responding from channel resistance.
Shorter term, however, H1 demand at 1.1719/1.1735 is interesting, sharing space with H4 supports. For that reason, an intraday rally could materialise, despite downside pressure from the higher timeframes.
AUD/USD:
Monthly timeframe:
(Technical change on this timeframe is often limited though serves as guidance to potential longer-term moves)
The month of September (lower by 2.9 percent) snapped a five-month winning streak and tested the upper border of demand at 0.7029/0.6664 (prior supply). From here, buyers appear free to explore as far north as 0.8303/0.8082 in the coming months, a supply zone aligning closely with trendline resistance (prior support – 0.4776).
In terms of trend, though, traders might want to take into account the primary downtrend (since mid-2011) remains south until breaking 0.8135 (January high [2018]).
Daily timeframe:
Brought forward from previous analysis –
Supply at 0.7131/0.7192 (prior demand) remains a prominent base on the daily timeframe, despite price testing stops above its border last week.
Tuesday finished by way of a bearish outside reversal, suggesting demand at 0.6964/0.7042 could re-enter the flow.
The trend, according to the daily timeframe, has emphasised a positive tone since bottoming in late March.
Traders may also recognise Tuesday saw the RSI top within a stone’s throw of 53.00 S/R.
H4 timeframe:
Supply from 0.7234/0.7199 (intersects with a 61.8% Fib level at 0.7214 and a 50.00% level at 0.7209), located just above daily supply at 0.7131/0.7192, helped establish a double-top pattern (red arrows – 0.7209) which recently had its neckline at 0.7130 punctured. This throws light on support at 0.7080 and the double-top’s take-profit target (green) at 0.7051, as well as demand at 0.7014/0.7035.
H1 timeframe:
Tuesday’s descent, fuelled on the back of risk assets taking a hit, guided H1 to the 0.71 level (and the RSI into oversold terrain), a psychological barrier placed just ahead of demand at 0.7074/0.7088 and support from 0.7072. Any upside attempts are likely to zero in on supply at 0.7170/0.7145.
Structures of Interest:
Monthly price is seen testing 0.7029/0.6664 as demand, which, structurally, prompts a bullish theme. The daily timeframe, however, formed a bearish outside reversal pattern yesterday from supply at 0.7131/0.7192.
The H4 double-top pattern (red arrows – 0.7209), which recently has its neckline penetrated at 0.7130, is likely to interest H4 sellers and perhaps force a 0.71 break on the H1 timeframe to test H1 demand at 0.7074/0.7088 (houses H4 support at 0.7080).

USD/JPY:
Monthly timeframe:
(Technical change on this timeframe is often limited though serves as guidance to potential longer-term moves)
Since kicking off 2017, USD/JPY has been carving out a descending triangle pattern between 118.66/104.62.
September, as you can see, tested the lower boundary of the aforesaid pattern and ended the month modestly off worst levels.
Areas of interest outside of the triangle can be seen at supply from 126.10/122.66 and demand coming in at 96.41/100.81.
Daily timeframe:
Brought forward from previous analysis –
Recovery gains off monthly support at 104.62 (the lower boundary of the monthly descending triangle) invites the prospect of additional bullish sentiment towards daily trendline resistance (111.71) and nearby daily supply at 107.58/106.85 (joined by the 200-day simple moving average at 107.47).
The RSI is seen on course to retest resistance around 57.00, currently toying with the 50.00 point, as we write.
H4 timeframe:
Brought forward from previous analysis –
Supply at 105.82/105.66 (stores a 61.8% Fib level within its upper boundary at 105.81) remains on the scene, after USD/JPY recently extended recovery gains out of demand at 104.92/105.09.
Additional areas of resistance to be aware of on the H4 chart are 105.98 and supply from 106.38/106.23.
H1 timeframe:
Intraday flow spent the majority of Tuesday rebounding from the 105.50 region, aided by the 100-period simple moving average and a local trendline support (prior support -105.79). Defending this area today could eventually see price make a run for resistance at 105.86 and supply at 106.05/105.91 (includes the 106 level).
Structures of Interest:
Partially modified from previous analysis –
Monthly support at 104.62 (lower base of the monthly descending triangle) holding price higher in September, along with the daily chart exhibiting room to approach trendline resistance and supply coming in from 107.58/106.85, signals buyers still have a reasonably strong hand in this fight.
H4 supply at 105.82/105.66 appears to be in a vulnerable position, due to the higher timeframes suggesting a move north. This, therefore, indicates H1 could rebound from the 105.50 region to approach H1 resistance at 105.86.

GBP/USD:
Monthly timeframe:
(Technical change on this timeframe is often limited though serves as guidance to potential longer-term moves)
Leaving trendline resistance taken from 2.1161 unopposed, September sunk 3.4 percent by way of a bearish outside reversal candle, on track to perhaps retest trendline support (prior resistance – 1.7191). Interestingly, the primary trend has faced lower since early 2008, unbroken (as of current price) until 1.4376 gives way – April 2 high 2018.
Daily timeframe:
Partially modified from previous analysis –
Supply at 1.3021/1.2844 continues to entertain price movement on the daily timeframe, following the prior week’s rebound from demand at 1.2645/1.2773 (and 200-day simple moving average at 1.2711). Tuesday, as you can see, scored a bearish outside reversal formation, shifting attention back to the aforesaid demand.
With reference to the RSI indicator, the value is seen topping just ahead of resistance at 55.00, after journeying from just ahead of oversold terrain.
H4 timeframe:
Within a stone’s throw from supply at 1.3055/1.3018, the mood turned sour on Tuesday and sent sterling nearly 1 percent lower against the US dollar.
In light of both monthly and daily timeframes displaying room to extend south, the recent sell-off may have prepped the ground to approach support listed at 1.2773.
H1 timeframe:
The widely watched 1.30 resistance served sellers well on Tuesday as we elbowed into European trading. Sellers dethroned the 100-period simple moving average, in addition to trendline support (1.2687) and the 1.29 level. The move also perhaps unshackled downside to demand at 1.2810/1.2833 and threw the RSI value to within touching distance of oversold territory.
Structures of Interest:
All four timeframes point to the possibility of additional bearish sentiment today.
On the basis of the above, retesting 1.29 and establishing a resistance might entice selling towards H1 demand at 1.2810/1.2833 and the 1.28 level.

DISCLAIMER:
The information contained in this material is intended for general advice only. It does not take into account your investment objectives, financial situation or particular needs. FP Markets has made every effort to ensure the accuracy of the information as at the date of publication. FP Markets does not give any warranty or representation as to the material. Examples included in this material are for illustrative purposes only. To the extent permitted by law, FP Markets and its employees shall not be liable for any loss or damage arising in any way (including by way of negligence) from or in connection with any information provided in or omitted from this material. Features of the FP Markets products including applicable fees and charges are outlined in the Product Disclosure Statements available from FP Markets website, www.fpmarkets.com and should be considered before deciding to deal in those products. Derivatives can be risky; losses can exceed your initial payment. FP Markets recommends that you seek independent advice. First Prudential Markets Pty Ltd trading as FP Markets ABN 16 112 600 281, Australian Financial Services License Number 286354.


 Access +10,000 financial
instruments
Access +10,000 financial
instruments