
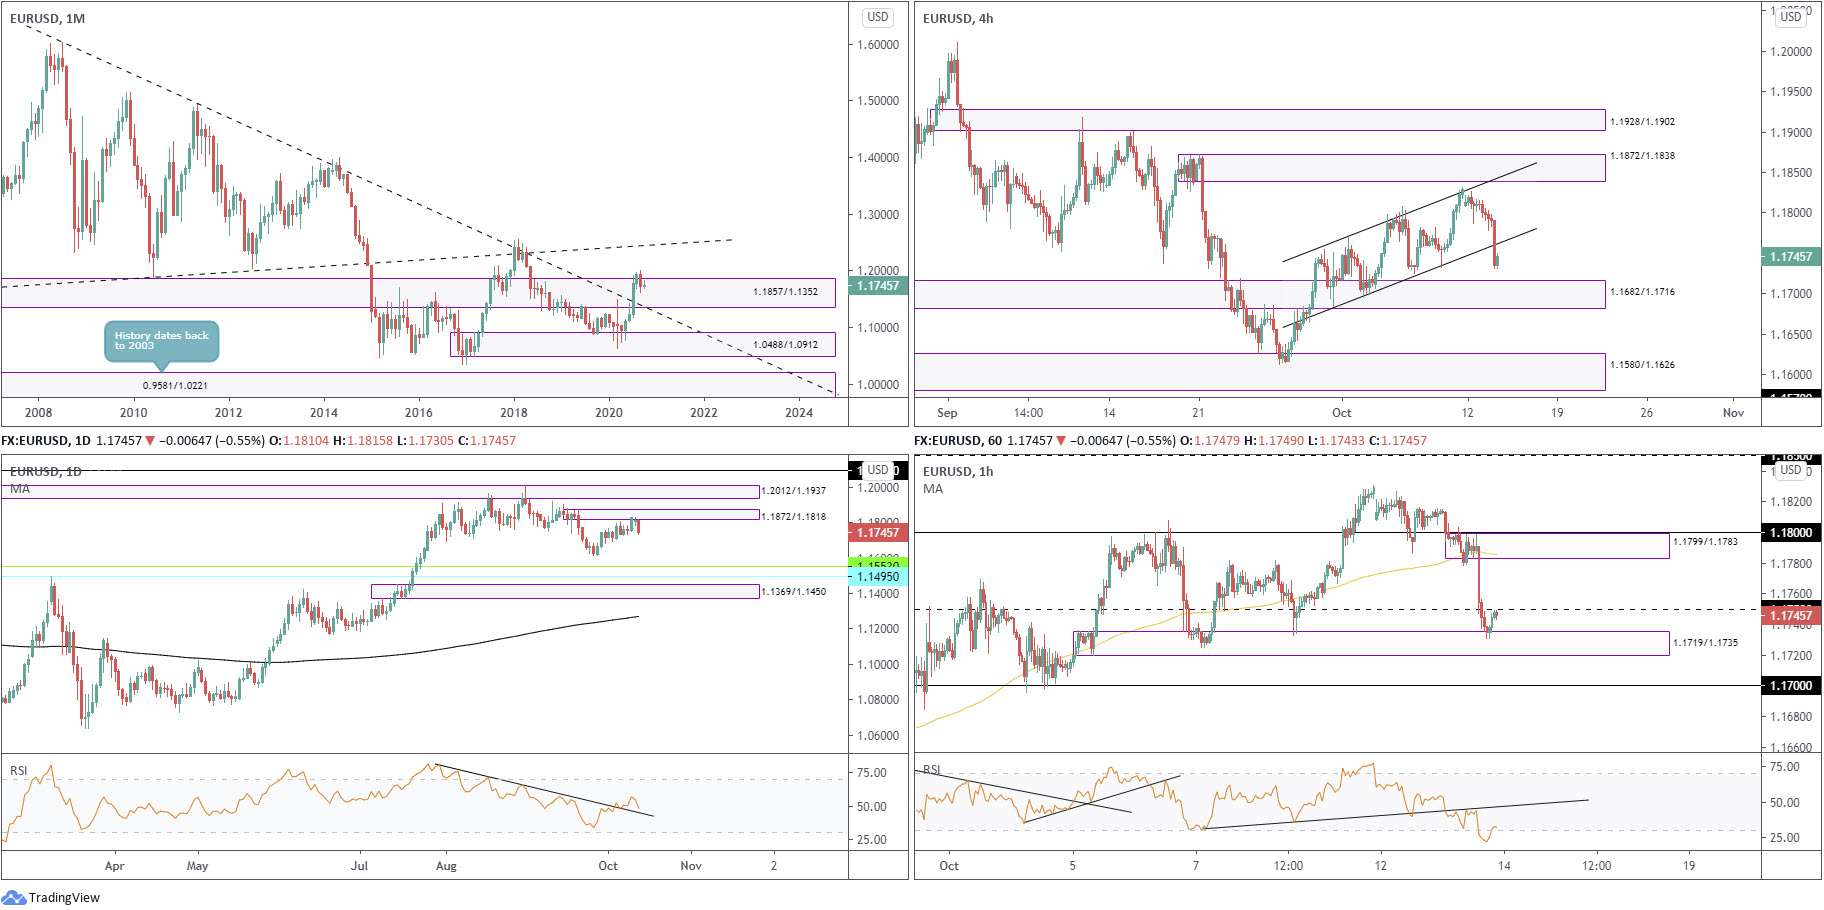
EUR/USD:
Monthly timeframe:
(Technical change on this timeframe is often limited though serves as guidance to potential longer-term moves)
August, as you can see, toppled supply from 1.1857/1.1352 and extended space north of long-term trendline resistance (1.6038), arguing additional upside may eventually be on the horizon, targeting trendline resistance (prior support – 1.1641). Despite this, before seeking higher territory, a dip to the recently penetrated trendline resistance (support) could materialise.
The primary downtrend (since July 2008) remains intact until 1.2555 is engulfed (Feb 1 high [2018]).
Daily timeframe:
Supply at 1.1872/1.1818, a rally-base-drop configuration, is proving a tough nut to crack, an area positioned under another supply coming in from 1.2012/1.1937.
The trend on the daily timeframe has displayed a bullish vibe since March. Additionally, the RSI oscillator, despite recently dipping back under 50.00, took over trendline resistance.
H4 timeframe:
The response seen from daily supply, underlined above at 1.1872/1.1818, generated enough force on the H4 timeframe to take out channel support (1.1684). This also threw light on a familiar demand area at 1.1682/1.1716.
H1 timeframe:
Tuesday’s spirited decline, following a brief 1.18 retest (and RSI trendline resistance retest), established healthy supply at 1.1799/1.1783. Price action, as you can see, surpassed 1.1750 support heading into US hours and joined hands with demand at 1.1719/1.1735.
As we move into Wednesday, 1.1750 resistance could come under fire as the RSI indicator makes its way out of oversold territory.
Structures of Interest:
The fact we faded daily supply at 1.1872/1.1818, and H4 displays room to drop to at least the upper boundary of demand at 1.1716, places a question mark on H1 buyers holding demand at 1.1719/1.1735.
Bearish setups may form should we fail to climb above 1.1750 resistance on the H1, whereas a H1 close above the latter signals enthusiasm from buyers.
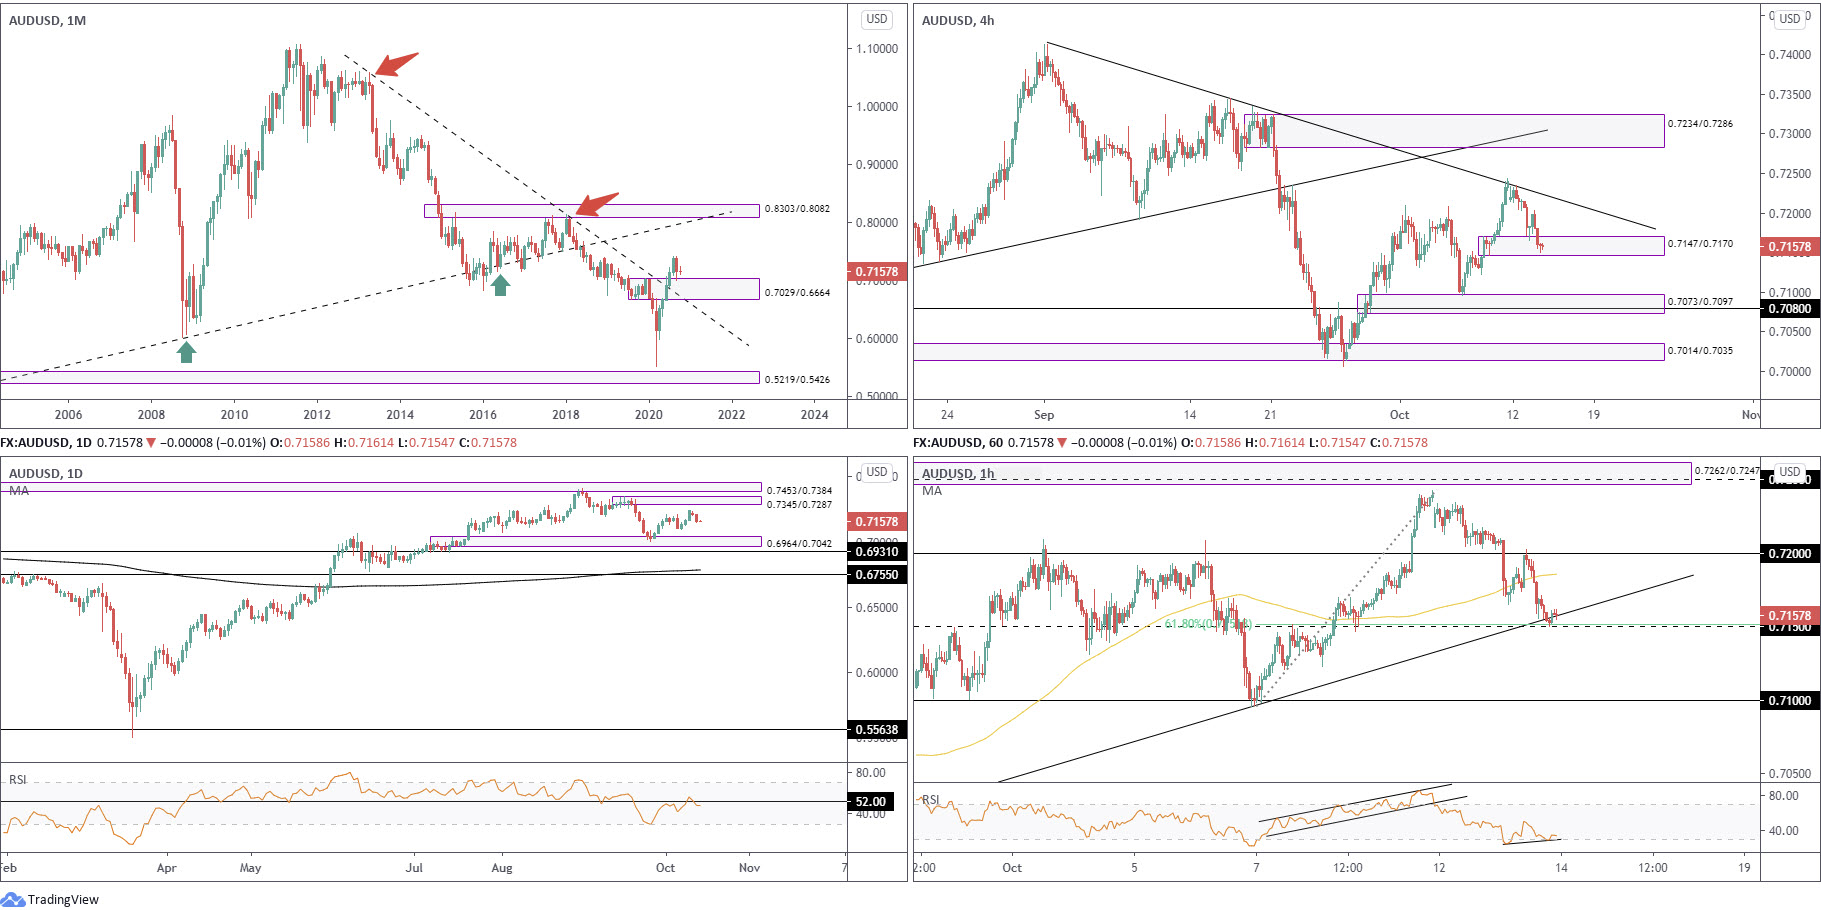
AUD/USD:
Monthly timeframe:
(Technical change on this timeframe is often limited though serves as guidance to potential longer-term moves)
The month of September (lower by 2.9 percent) snapped a five-month winning streak and tested the upper border of demand at 0.7029/0.6664 (prior supply). From a structural standpoint, buyers appear to have the upper hand, free to explore as far north as 0.8303/0.8082 in the coming months, a supply zone aligning closely with trendline resistance (prior support – 0.4776).
In terms of trend, though, traders might want to take into account the primary downtrend (since mid-2011) remains south until breaking 0.8135 (January high [2018]).
Daily timeframe:
Obvious areas of note on the daily chart are demand coming in from 0.6964/0.7042, and a rally-base-drop supply formation at 0.7345/0.7287 (sheltered just under another area of supply at 0.7453/0.7384).
Another key observation is RSI support-turned resistance at 52.00.
H4 timeframe:
Since crossing paths with trendline resistance (0.7413) at the beginning of the week, AUD/USD folded over and recently joined hands with demand at 0.7147/0.7170. The lack of buying seen out of the zone questions bullish commitment. Slipping through the aforesaid demand shines light on another demand area at 0.7073/0.7097 (as well as support at 0.7080).
H1 timeframe:
Technically, we are at an interesting juncture on the H1 chart, featuring a trendline support (0.7005), 0.7150 support and a 61.8% Fib level from 0.7151. Additionally, we can see RSI bullish divergence.
Smothering the above support, however, unlocks the possibility of a move towards 0.71.
Structures of Interest:
The H1 supports, along with H4 trekking within demand at 0.7147/0.7170 and monthly price testing 0.7029/0.6664 as demand, advertises a possible bullish setting, with at least 0.72 targeted.
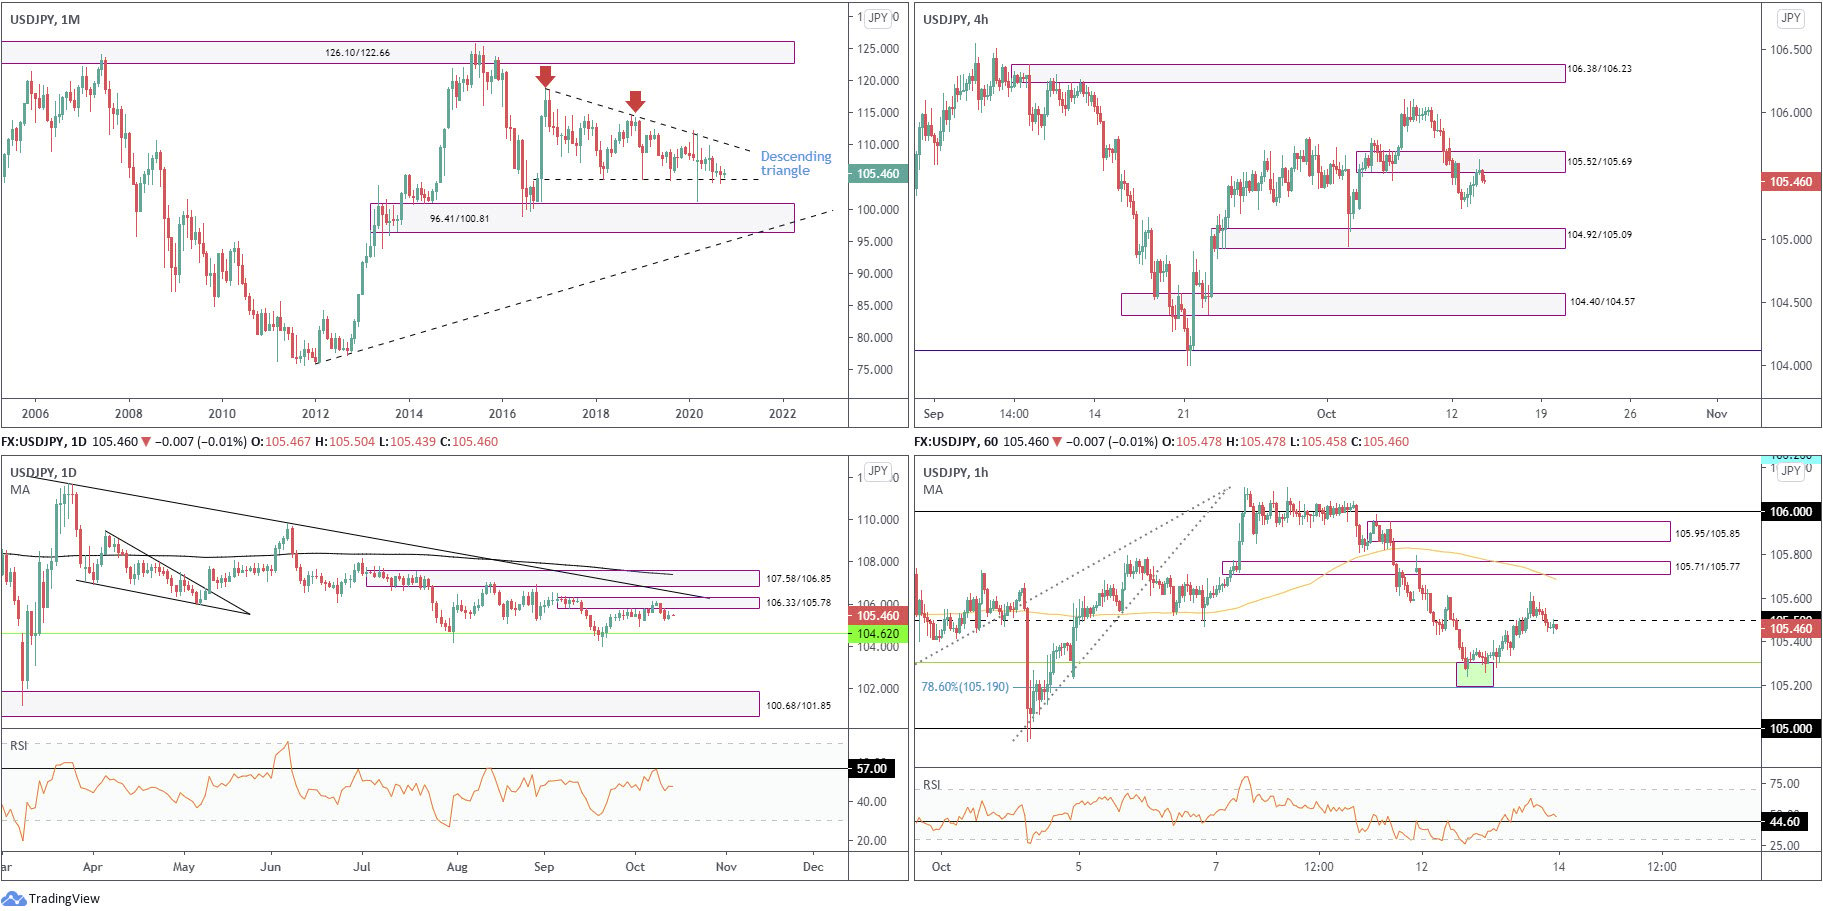
USD/JPY:
Monthly timeframe:
(Technical change on this timeframe is often limited though serves as guidance to potential longer-term moves)
Since kicking off 2017, USD/JPY has been carving out a descending triangle pattern between 118.66/104.62.
September, as you can see, tested the lower boundary of the aforesaid pattern and ended the month modestly off worst levels, with October now emphasising a hesitant tone.
Areas of interest outside of the triangle can be seen at supply from 126.10/122.66 and demand coming in at 96.41/100.81.
Daily timeframe:
Brought forward from previous analysis –
Since recovering from monthly support at 104.62 (the lower boundary of the monthly descending triangle), action on the daily timeframe has been clinging to daily supply at 106.33/105.78, perhaps encouraged by the RSI oscillator also fading resistance at 57.00.
Areas of note above the aforesaid supply are nearby trendline resistance (111.71), supply at 107.58/106.85 and the 200-day simple moving average at 107.40.
H4 timeframe:
Supply at 105.52/105.69 (prior demand) is, as you can see, welcoming a retest, with recent action putting up a shooting star candlestick pattern, considered a bearish signal at peaks. Continued interest out of 105.52/105.69 throws light on demand at 104.92/105.09.
H1 timeframe:
In the early hours of trading on Tuesday, buyers made a stand out of 105.19/105.30 (a 78.6%38.2% Fib area), with price action clocking peaks at 105.62 heading into the US open. Mildly paring gains into the close, however, the pair ended the day a touch under 105.50.
To the upside, the 100-period simple moving average is seen closing in on 105.65, floating just under a supply zone from 105.71/105.77 (prior demand).
In terms of where we stand in regards to the RSI, the value is seen nearing an S/R level around 44.60.
Structures of Interest:
Should H1 sellers maintain control south of 105.50, this could trigger another wave of selling today, weighed by H4 reacting from supply at 105.52/105.69 and daily price engaging with supply at 106.33/105.78.
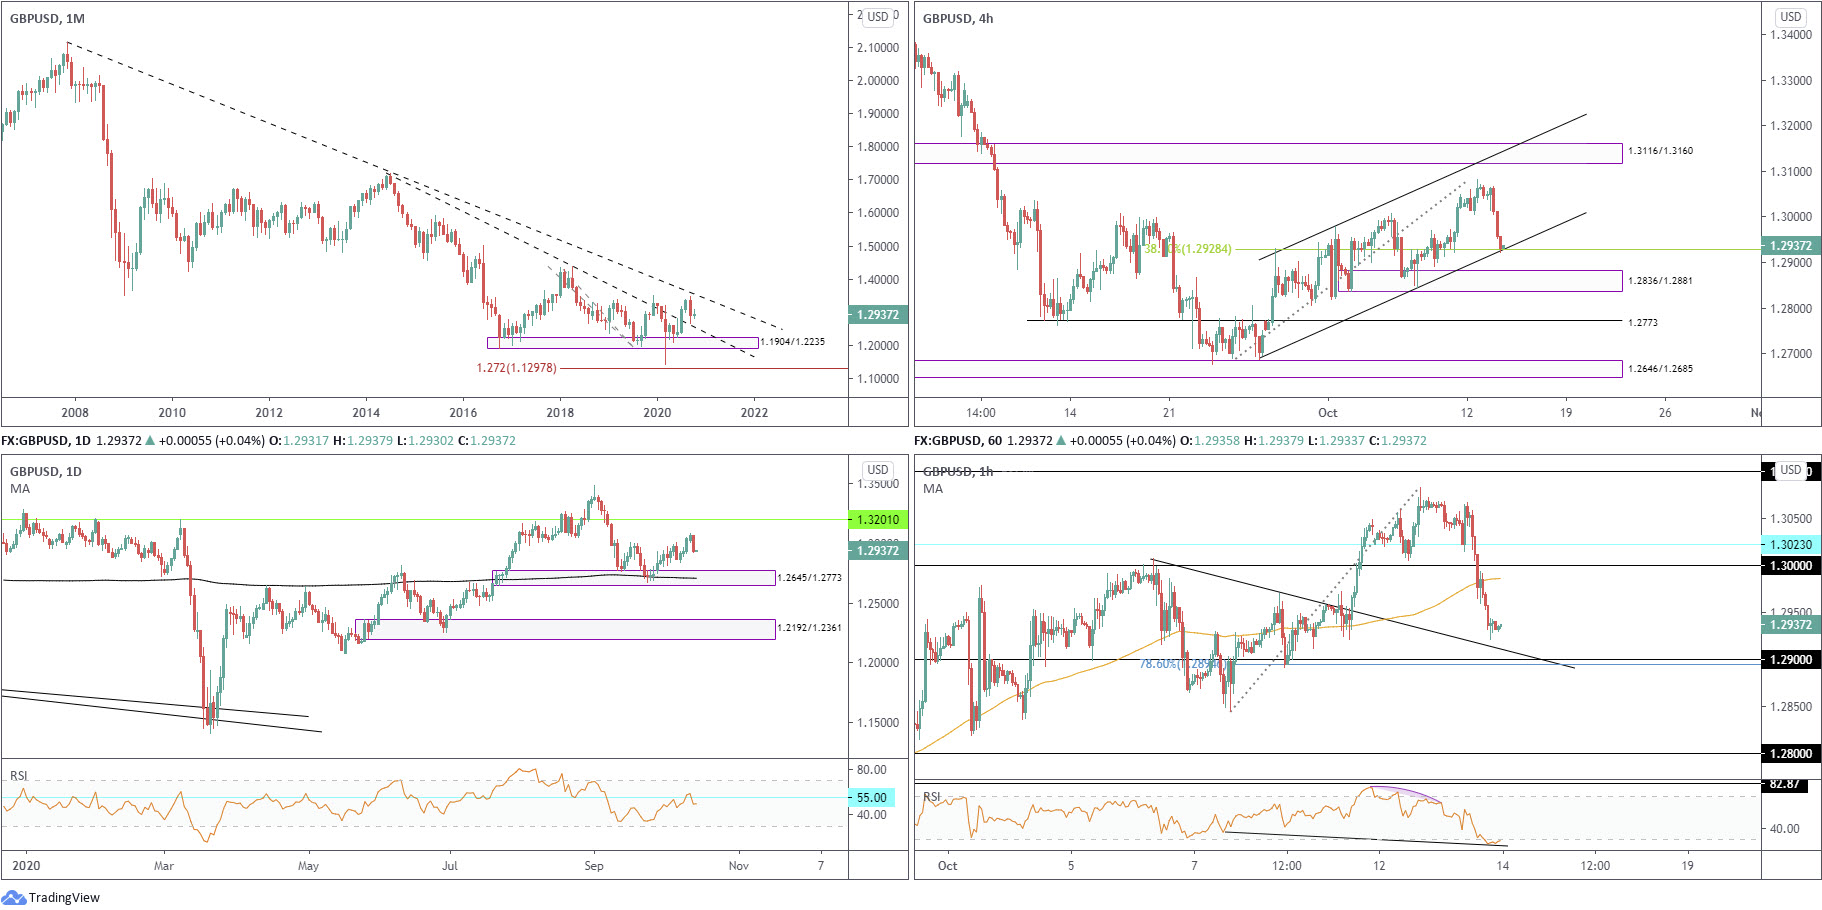
GBP/USD:
Monthly timeframe:
(Technical change on this timeframe is often limited though serves as guidance to potential longer-term moves)
Although leaving trendline resistance taken from 2.1161 unopposed, the month of September sunk 3.4 percent by way of a bearish outside reversal candle. This advertises a potential trendline support (prior resistance – 1.7191) retest.
In terms of trend, the primary trend has faced lower since early 2008, unbroken (as of current price) until 1.4376 gives way – April 2 high 2018.
Daily timeframe:
Demand at 1.2645/1.2773 (and 200-day simple moving average at 1.2708) is an area worth highlighting, due to it effectively being a location where a decision was made to break above the 1.2813 peak (June 10). Another area that draws attention is resistance at 1.3201.
Furthermore, RSI fans will note the value recently met with 55.00 resistance.
H4 timeframe:
Price readers on the H4 timeframe will acknowledge GBP/USD fell sharply Tuesday, pressured by a stronger-than-expected USD rebound. This resulted in the pair testing channel support (1.2687), an ascending line that blends with a 38.2% Fib level from 1.2928.
Failure to hold channel support today may see traders embrace demand at 1.2836/1.2881, a clear drop-base-rally configuration.
H1 timeframe:
After drilling through the widely watched 1.30 level, and taking on the 100-period simple moving average, interesting support is seen surfacing around the 1.29 level (composed of a trendline support [prior resistance – 1.3007] and a 78.6% Fib level at 1.2894). Another factor in favour of a GBP/USD recovery from the 1.29 region is the RSI indicator testing oversold territory and establishing hidden bullish divergence.
Structures of Interest:
While a recovery from H4 channel support is possible, 1.29 on the H1 offers appealing confluence. Should the round number make an entrance, however, interested buyers from here are urged to note the possibility of a whipsaw forming through 1.29 to draw in any buyers residing around the upper border of H4 demand at 1.2836/1.2881.
DISCLAIMER:
The information contained in this material is intended for general advice only. It does not take into account your investment objectives, financial situation or particular needs. FP Markets has made every effort to ensure the accuracy of the information as at the date of publication. FP Markets does not give any warranty or representation as to the material. Examples included in this material are for illustrative purposes only. To the extent permitted by law, FP Markets and its employees shall not be liable for any loss or damage arising in any way (including by way of negligence) from or in connection with any information provided in or omitted from this material. Features of the FP Markets products including applicable fees and charges are outlined in the Product Disclosure Statements available from FP Markets website, www.fpmarkets.com and should be considered before deciding to deal in those products. Derivatives can be risky; losses can exceed your initial payment. FP Markets recommends that you seek independent advice. First Prudential Markets Pty Ltd trading as FP Markets ABN 16 112 600 281, Australian Financial Services License Number 286354.


 Access +10,000 financial
instruments
Access +10,000 financial
instruments