
EUR/USD:
Monthly timeframe:
(Technical change on this timeframe is often limited though serves as guidance to potential longer-term moves)
Following the break of long-term trendline resistance (1.6038) in July, buyers and sellers have since been squaring off around the upper section of supply from 1.1857/1.1352. Technically, although this argues additional upside may be on the horizon, targeting ascending resistance (prior support – 1.1641), September and October fashioning negative months proposes a dip to retest the recently penetrated trendline resistance (support).
The primary downtrend (since July 2008) remains intact until 1.2555 is engulfed (Feb 1 high [2018]).
Daily timeframe:
Partially modified from previous analysis –
The euro’s underperformance over the past six trading sessions out of supply from 1.1872/1.1818 delivers the possibility of addressing support from 1.1553 and a descending support line from 1.2011 in upcoming trade.
Traders will also note the RSI oscillator hovers within a stone’s throw from trendline support (prior resistance).
H4 timeframe:
Following Friday’s 1.1682/1.1716 retest, Monday tested demand at 1.1580/1.1626, an area extended from July of this year.
While the demand exhibits a somewhat large range for the H4 chart, support at 1.1570 is worth noting in case sellers tunnel into the aforesaid demand today.
H1 timeframe:
Monday’s intraday action brought a subdued tone ahead of today’s election. Price spent the session fluctuating between support at 1.1627 and 1.1650 resistance. RSI fans may also note a bullish pennant pattern recently formed, with the value currently attacking the upper edge of the formation.
Overrunning 1.1650 resistance today shines light on supply at 1.1688/1.1678, along with the 1.17 level and supply at 1.1717/1.1701. In case buyers falter off 1.1627, the 1.16 level calls for attention.
Potential direction:
Both monthly and daily timeframes communicate the possibility of a bearish setting, with daily support at 1.1553 targeted.
The technical situation on the lower timeframes, however, demonstrate a pullback could be in store before higher timeframe sellers get their way. H4 demand at 1.1580/1.1626 recently made an entrance. This, together with the H1 RSI value breaking a pennant formation, could lift EUR/USD above 1.1650 resistance today to target the 1.17 level (aligns closely with the next upside target on the H4 – lower edge of supply at 1.1682).

AUD/USD:
Monthly timeframe:
(Technical change on this timeframe is often limited though serves as guidance to potential longer-term moves)
The months of September and October recorded losses, with the latter down by nearly 2 percent. Developing a mild correction, longer-term action is addressing the upper border of demand at 0.7029/0.6664 (prior supply). Structurally speaking, despite recent losses, buyers still have a strong advantage, free to explore as far north as 0.8303/0.8082 in the coming months, a supply zone aligning closely with trendline resistance (prior support – 0.4776).
In terms of trend, though, the primary downtrend (since mid-2011) remains south until breaking 0.8135 (January high [2018]).
Daily timeframe:
Partially modified from previous analysis –
Just when buyers looked as though they’d given up within demand at 0.6964/0.7042, a stronger-than-expected recovery formed Monday, with the day’s candle settling near session highs.
Trendline resistance (0.7413) is seen as a possible target for buyers out of the aforesaid demand, with a break uncovering supply at 0.7345/0.7287, a rally-base-drop formation. Clearing supports, on the other hand, shines light on the 200-day simple moving average at 0.6801 and a neighbouring support level marked at 0.6766.
From the RSI oscillator, we recently twisted lower ahead of 52.00 resistance with the value currently scanning the 40.00 region.
H4 timeframe:
Partially modified from previous analysis –
After reuniting with demand at 0.6972/0.7004 last week (located within daily demand at 0.6964/0.7042, which itself is positioned around the upper boundary of monthly demand from 0.7029/0.6664), buyers stood their ground on Monday.
Resistance continues to stand out at 0.7096, banded together with a 61.8% Fib level at 0.7098. Failure to reach the aforesaid resistances could eventually target support from 0.6923.
H1 timeframe:
The widely watched 0.70 level firmly cemented its position as support Monday, with Asia and London feeling for liquidity south of the round number. US trading observed buyers shift gears and dethrone 0.7050 resistance.
As we begin to transition into today’s Asian session, however, price is struggling to topple the 100-period simple moving average around 0.7053. Though directly above here resistance is seen at 0.7068, with 0.71 noted as the next possible resistance.
Potential direction:
Monthly, daily and H4 timeframes offer demand at the moment. This may place upward pressure on the 100-period simple moving average on the H1, with enough force to overcome H1 resistance at 0.7068. Could this be sufficient to seduce buyers off 0.7050 support to target 0.71 (and H4 resistance at 0.7096)?

USD/JPY:
Monthly timeframe:
(Technical change on this timeframe is often limited though serves as guidance to potential longer-term moves)
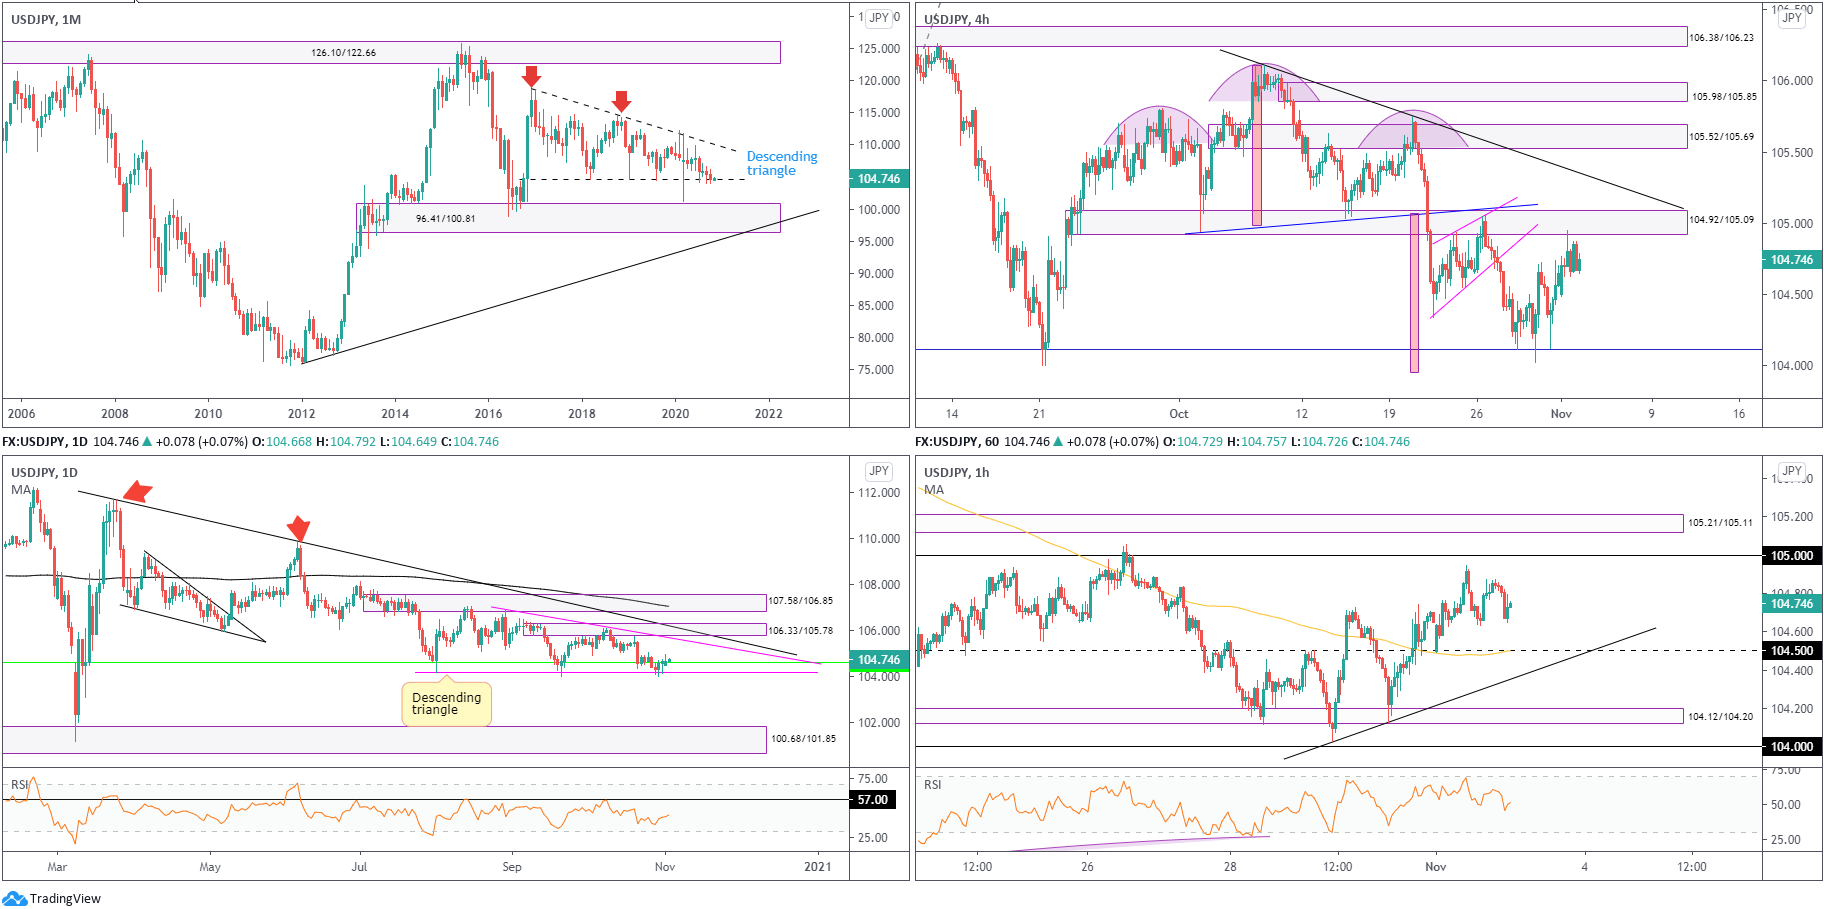
Since kicking off 2017, USD/JPY has been carving out a descending triangle pattern between 118.66/104.62. July 2020 onwards, as you can see though, has had price toying with the lower boundary of the aforesaid pattern. Notably, both September and October traded south, with the latter finishing lower by 0.7 percent.
Areas of interest outside of the triangle can be seen at supply from 126.10/122.66 and demand coming in at 96.41/100.81.
Daily timeframe:
Brought forward from previous analysis –
Since August, daily price has also been in the process of shaping a descending triangle pattern between 106.94/104.18. The lower edge of the monthly descending triangle (green – 104.62) also sits just north of the daily pattern’s lower border.
While breaking beneath the daily and monthly timeframe’s descending triangle supports (monthly currently under pressure) shifts focus back to daily demand at 100.68/101.85, we are seeing signs of recovery off the daily pattern’s lower base right now.
H4 timeframe:
The 161.8% Fib projection level at 104.11 (blue) proved effective support once again last week, enduring an onslaught of bearish attacks. Monday, as you can see, explored higher terrain and crossed paths with supply at 104.92/105.09 (prior demand).
Pursuing a northerly path this week, action that unseats the aforesaid supply, turns light to trendline resistance, taken from the high 106.10.
H1 timeframe:
The week opened with a 104.50 retest, a level joining with the 100-period simple moving average, and cemented a modest bullish tone that took the currency pair to peaks just ahead of the 105 level.
Levels to be aware of, aside from 104.50 and 105, are supply from 105.21/105.11 (prior demand) and trendline support (104.02).
Potential direction:
As monthly and daily price engage with their respective descending triangle supports, an upside push could be on the horizon. Should we retest 104.50 support on the H1 timeframe once again, preferably either joined by the 100-period simple moving average or H1 trendline support, bulls could make a show to try and overrun the 105 hurdle for H1 supply at 105.21/105.11.
GBP/USD:
Monthly timeframe:
(Technical change on this timeframe is often limited though serves as guidance to potential longer-term moves)
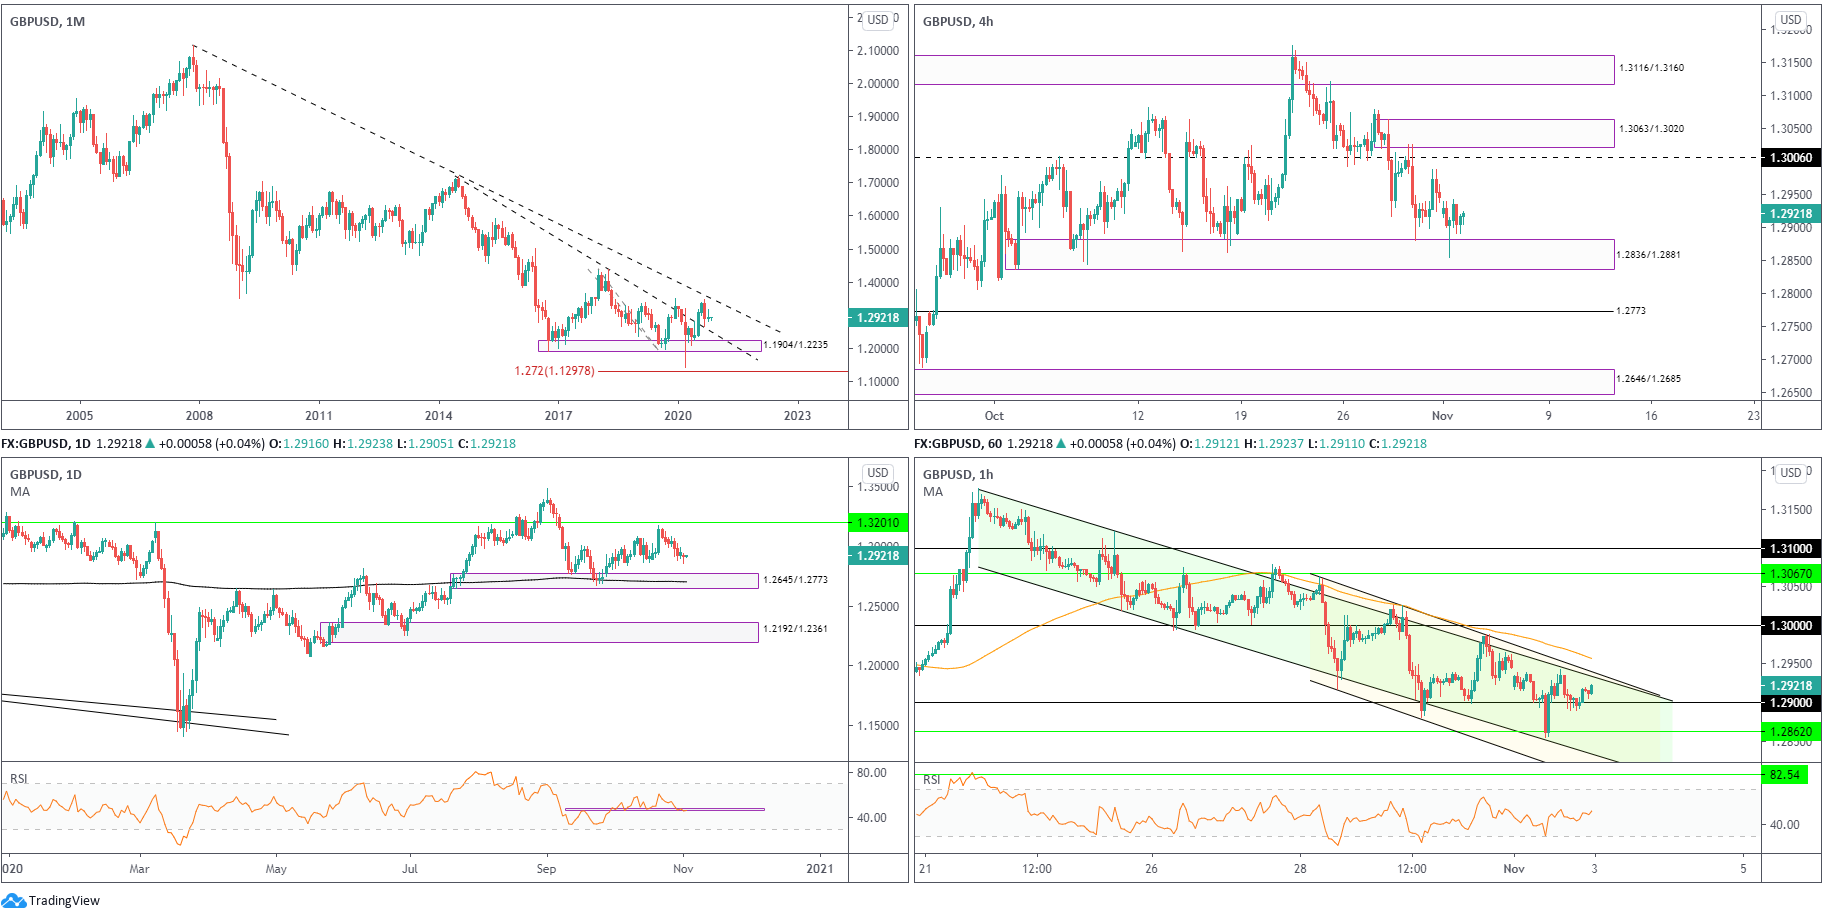
Leaving trendline resistance (2.1161) unopposed, the month of September fell 3.4 percent by way of a bearish outside reversal candle and snapped a three-month winning streak. This, despite a lacklustre October, advertises a possible dip to retest trendline support (prior resistance – 1.7191).
In terms of trend, the primary trend has faced lower since early 2008, unbroken (as of current price) until 1.4376 gives way – April 2 high 2018.
Daily timeframe:
Brought forward from previous analysis –
Last week observed price extend south of resistance at 1.3201, enough to shine light on demand at 1.2645/1.2773 (and a corresponding 200-day simple moving average).
Also noteworthy on this timeframe is the RSI oscillator seen testing 47.00 support.
H4 timeframe:
Partially modified from previous analysis –
Monday established a hammer candlestick configuration, a pattern that spiked into the range of nearby demand at 1.2836/1.2881. Subsequent follow-through was feeble, though price remains above the aforesaid demand area as we head into election day.
Resistance at 1.3006, as well as supply from 1.3063/1.3020, remain relevant points on the chart. Yet, in case buyers lose control, dipping to support at 1.2773 is a possibility.
H1 timeframe:
A nasty two-candle whipsaw through orders at 1.29 occurred heading into the London session on Monday, action that tested support at 1.2862 and missed channel support (1.3019) by a few pips.
Traders, as you can see, are working with two descending channel patterns on the H1 chart (1.3176/1.3019 – 1.3063/1.2916).
As you can see, the pair held 1.29 into the close and is now seen approaching channel resistances.
Potential direction:
Partially modified from previous analysis –
Daily price reveals room to reach for demand at 1.2645/1.2773, alongside monthly price offering a possible dip to retest trendline support.
This could make life difficult for 1.29 buyers, with active sellers potentially residing around the H1 channel resistances.
DISCLAIMER:
The information contained in this material is intended for general advice only. It does not take into account your investment objectives, financial situation or particular needs. FP Markets has made every effort to ensure the accuracy of the information as at the date of publication. FP Markets does not give any warranty or representation as to the material. Examples included in this material are for illustrative purposes only. To the extent permitted by law, FP Markets and its employees shall not be liable for any loss or damage arising in any way (including by way of negligence) from or in connection with any information provided in or omitted from this material. Features of the FP Markets products including applicable fees and charges are outlined in the Product Disclosure Statements available from FP Markets website, www.fpmarkets.com and should be considered before deciding to deal in those products. Derivatives can be risky; losses can exceed your initial payment. FP Markets recommends that you seek independent advice. First Prudential Markets Pty Ltd trading as FP Markets ABN 16 112 600 281, Australian Financial Services License Number 286354.


 Access +10,000 financial
instruments
Access +10,000 financial
instruments