Reading Time: 8 Minutes
Mobile trading with MetaTrader 5 (MT5), software developed by MetaQuotes, enables trading foreign exchange, as well as Contracts for Differences (CFDs) on stocks, commodities, interest rates, as well as other financial instruments. In addition, MT5 allows pricing derived from futures and stock exchanges, from any location at any time, thanks to mobile trading.
To trade mobile, consider downloading MT5 for iOS or Android to install on your smartphone or tablet, allowing you to remain abreast of key financial information. MT5 Trading Platform’s extensive functionality now fits in your hand.
The outstanding amount of accessible analytical tools in the MT5 interface satisfies the majority of the requirements for the modern trader. MT5 also provides the MQL5 development environment and key supplementary services for technical analysis work.
MT5 Mobile
MT5, as noted above, may be loaded on iOS and Android-powered smartphones and tablet computers. From the FP Markets website, download the MetaTrader 5 (MT5) mobile trading app from here.
Mobile applications from MT5 generally offer two-position accounting systems (netting [used with exchange-based markets] and hedging [generally used in foreign exchange]), in addition to market depth, and a considerable number of order types. The mobile application’s built-in technical indicators, economic calendar, and analytical items enable expert technical analysis. Therefore, with MT5 Mobile you can manage your trading account operations (trade operations), view the history of your trades, buy and sell currencies, and trade securities with a single tap on the go.
Because MT5 is user-friendly, you can rapidly adjust how your charts are displayed and store those settings as defaults to guarantee they all appear identically each time you open the platform, either from your desktop or mobile.
Trading Predictions?
MT5 simplifies the development of a trade prediction by allowing you to select multiple indicators and drawing tools simultaneously, based on your trading strategy.
Beginners should ensure a thorough understanding of price movements (think price-action trading), protective stop-loss orders, take-profit orders, historical data, as well as volatility and liquidity. Making trading forecasts, of course, requires effort and education. New Forex traders (and CFD traders) should consider trading with a demo account before moving on to a real-time live trading system. Do your homework before trading.
Predictive analytics and machine learning are two benefits of integrating AI in the Forex market. Predictive analytics uses current trade data and algorithms to forecast changes in the market. Consequently, by letting AI systems create projections and predictions, traders may be able to concentrate more on creating smarter data-backed trading strategies.
Deep learning techniques and data science tools have applications in the financial sector—for example, algorithmic trading, expert advisors, and copy trading. Utilizing trading robots or computer programs to generate trading choices is common in Indian stock markets.
According to research, predictions made using the Premier Stochastic Oscillator (PSO), enhanced by Neural Networks, boasts a high level of accuracy (Zhang, 2021).
Common Forex Indicators Used to Make Trading Predictions
Moving Average Crossover
The Moving Average Crossover is one of the trend predictors that is popular for predicting price movements in the Forex market and other financial markets. This strategy examines instances in which a short-term moving average crosses above or below a longer-term moving average. Day traders typically employ moving averages.
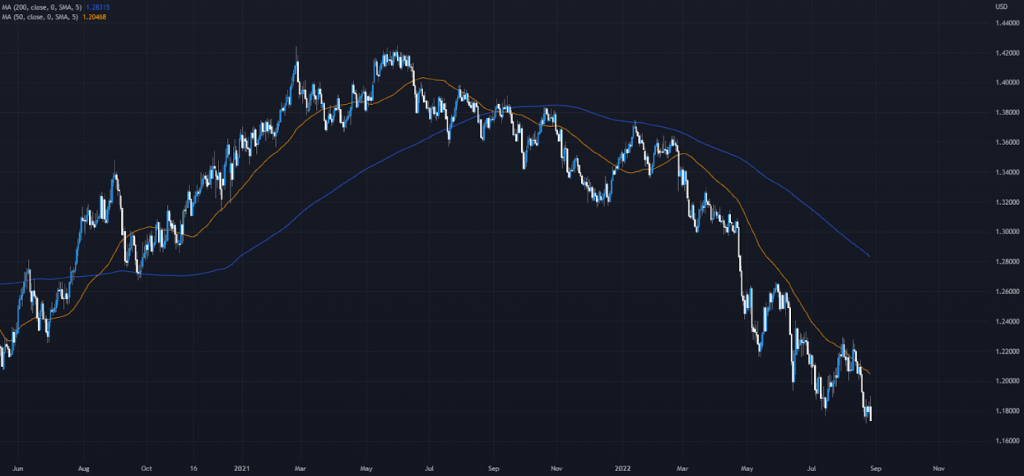
A common longer-term system using moving averages is the combination of the 200-day simple moving average and the 50-day simple moving average. As you can see from figure 1.A, when the 50-day SMA (orange) crosses above the 200-day SMA (blue), this is a buy signal for many traders and investors. Conversely, a 50-day SMA crossing below the 200-day SMA is considered a bearish signal.

Figure 1.A (GBP/USD Daily Chart with the 200/50-Day SMAs Applied)
Fibonacci
Fibonacci is a common trading application, offering horizontal support and resistances in the financial markets (including the Forex market) based on ratios.
The golden ratio of 1.618 is a key component of the Fibonacci tool. In Forex trading, this ratio is used to spot profit-taking opportunities and market reversals. The inverse of the golden ratio is the 61.8%, a common retracement ratio.
The Relative Strength Index
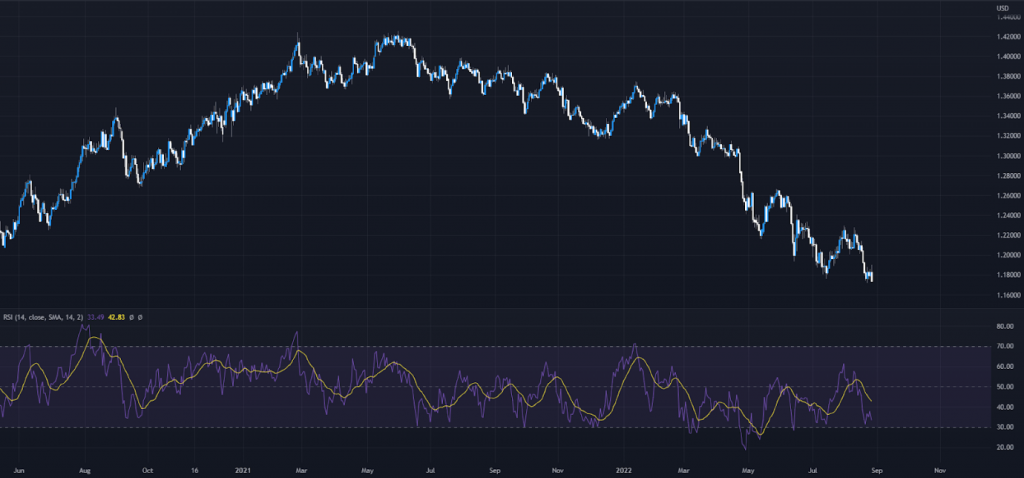
The Relative Strength Index (RSI) is a momentum oscillator fixed between 0 and 100, designed to identify overbought (70.00) and oversold (30.00) signals.
When the price exceeds 70.00 and exits the overbought area, this is considered a bearish signal and portends a downward turn in the market. A positive market reversal is indicated if the price is in a downtrend and the RSI drops below the threshold of 30.00 and exits oversold space.
Other ways of using the RSI are through divergences, the 50.00 centreline, and also failure swings.
Ultimately, traders can use RSI to predict the price behavior of a security.
 Figure 1.B (GBP/USD Daily Chart with the RSI Applied)
Conclusion
Educate yourself before trading with real money and attempting to forecast market direction. Before using any indicators, ensure you completely understand them.
Fortunately, several courses are available through the FP Markets Traders Hub, serving as a portal for new traders to learn and grow.
References
Zhang, D. (2021, August 27th). ResearchGate. Retrieved 2022, from ResearchGate


 Access +10,000 financial
instruments

