
XJO WEEKLY
Price structure: Consolidation
The forward view for a further retracement remains the technical observation for this week. The small range set last week against the reversal bar #3 does not indicate selling pressure. With the close above the October 2021 all-time high level of 7632, support remains strong at this level. Consistent with Trend modelling, consolidations usually last over 3 weeks. A close below the 7540 level will indicate a reversal.
Indicator: Relative Strength 14
Relative Strength remains above the 50 level again as part of the overall directional move higher in price. Only further movements towards the 70 level will remain a bullish signal for further gains; last week, the RSI value moved sideways in line with price consolidation. However, a new high is required over the late Q4-2023 high point. A new divergence signal may develop at this level.
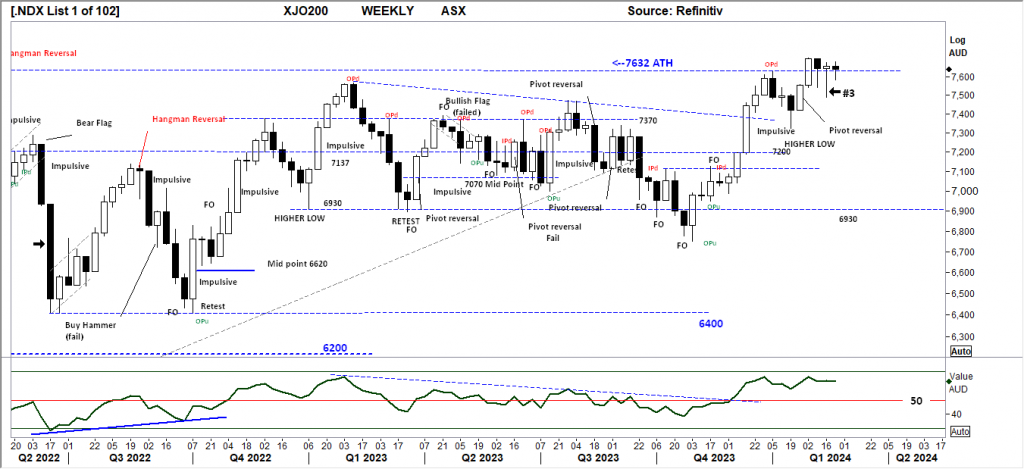
Comments last week: The Weekly range testing lower levels and closing towards the high indicates selling; this type of process can show in Weekly charts 1 or 2 weeks prior to a decline. Q3 2022 shows a hangman reversal following a Bullish fluid movement. With a lower high and Lower Low against the prior week, the structure can set a 3rd lower low back towards the 7400 level or lower. This declining structure will test the buyers’ resolve. Traders should consider further consolidation in the Index value as this Primary Up Trend begins.
XJO DAILY
Price structure: 2nd Retest of the High.
The Daily view of the Index highlights the consolidation taking place above the 7540 level, and the value remaining above the short-term trend line offers a bullish view for further gains. Last Thursday/Friday set a higher low inside this pattern, also marking a 3rd low point, a strong indication the pattern is complete and a further breakout should be expected this week. High volumes at the low indicate strong off-market positioning as the high volumes have not impacted price.
Indicator: Relative Strength 14
The Relative Strength Indicator (14) turned higher into the close on Friday, as the Relative Strength Indicator had a swing to move towards the 50-level following the sell divergence signal discussed 4 weeks ago; the current close heading towards the 70 levels again remains the play for this week. However, this is the level where traders should be looking for a further sell divergence as the RSI is yet to move over the high (70) of 3 weeks ago.
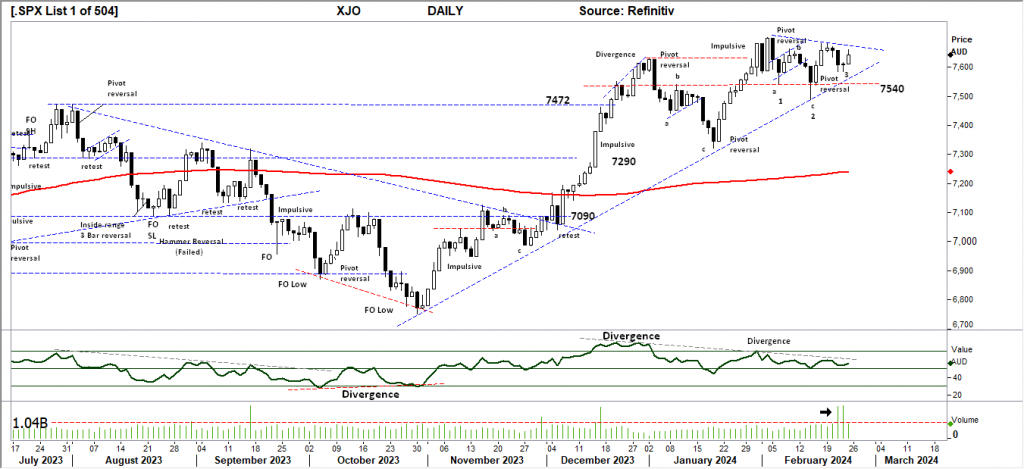
Comments last week: The bear flag discussed last week has played out to test below the 7540 level as a confirmed a, b, c pattern, with the pivot point showing buyers have again lifted the market and set a Bullish follow-on from the pivot point. A continuation pattern, heavy resistance could be encountered on the 2nd of February high of 7700, the point of initial selling during this week. Consistent high volume at the Pivot point indicates buyer interest adding to the view of a short covering event took place at point “c”.
S&P 500 WEEKLY
Price structure: Hangman remains.
The Weekly view shows a strong range high close bar indicating a very bullish move is underway following the lower “retest” of the key support level developing at 5030 points. The index movement is supported by only a handful of dual listed (Nasdaq) stocks in the Index, traders should use caution around being “late buyers”; the Hangman of 2 weeks ago still remains valid as a reversal indicator going forward.
Indicator: Relative Strength Indicator 14
Relative Strength has again turned higher and moved over the 70 level, but to remain a strong momentum signal, the RSI should continue a move over the 70 level with the underlying price advances. In the coming weeks, traders would monitor the RSI for a bearish divergence signal as any Index price consolidation towards the 4818 level may re-assert a bearish RSI signal as the indicator would turn lower towards the 70 level and below.
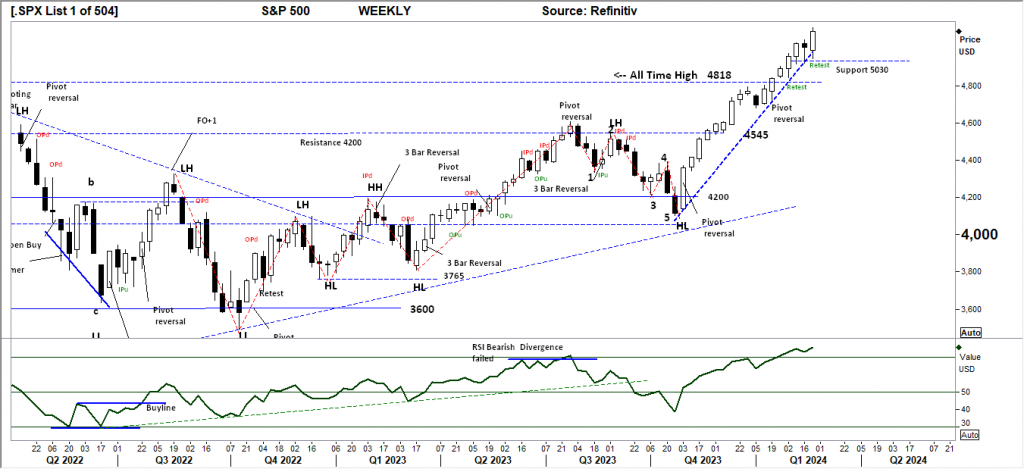
Comments from last week: The S&P has set a Hangman in this Weekly view, with the low being set during the week only for the market to recover towards the high of the week. The low set at 5030 points now becomes interim support for the coming week. The Hangman shown in a Weekly chart has a very high statistical outcome of indicating a reversal 1-2 weeks in advance. On a break of the current short-term trendline, the next key level of support is 4818 points.
SPX DAILY
Price structure: Sell divergence developing.
The good news “GAP” set last Thursday may indicate the “exhaustion” Gap as the Index value extends further away from the 200-day moving average. With price action now testing the short-term trend line, the upward momentum is slowing, with a sharp reversal possible in the Daily chart. Positive price “momentum” is slowing (see RSI notes), suggesting the current price movements are not showing board-based support from the buyers.
Indicator: Relative Strength Indicator 14
The Relative Strength Indicator has moved back below the 70 level, indicating slowing momentum. Although not a signal of overbought, the current second and third movement into this over-70 level is often seen as a level to take profits as seen during July 2023 and December 2023. The potential Sell divergence signal has again developed, with the RSI line setting a new lower high.

Comments from last week: The Daily view highlights the consolidation developing over the previous week. The short trendline being tested during the week will be the pivotal observation for traders this week, as a break of this line may offer an early indication of a price top in place. Given the extended distance current price, movements are from the 200-day moving average, any retracement should first be monitored for a retest of the initial breakout level of 4607 points.
NASDAQ DAILY
Price structure: Sell divergence continues.
The Fake Out (FO) set last Friday is the key observation of an “Island top” developing. High correlation occurrence before a reversal takes place as the last of the buyers enters the market. Profit-taking is now the highest concern for traders in this Primary UP trend. As the Index extends the distance away from the 200-day moving average, the risk of a sharp profit-taking movement remains high.
Indicator: Relative Strength 14
Relative Strength has again moved towards the 50 level, this remains an area to monitor for further exhaustion reversal below the “sell line”. The observance is the overall Relative strength is, again, bullish for now. However, the failed 4th attempt to move over the 70 level is often a signal of exhaustion. The RSI should now be monitored for a further movement lower, indicating a change of momentum; this may provide some early insight into trend failure.
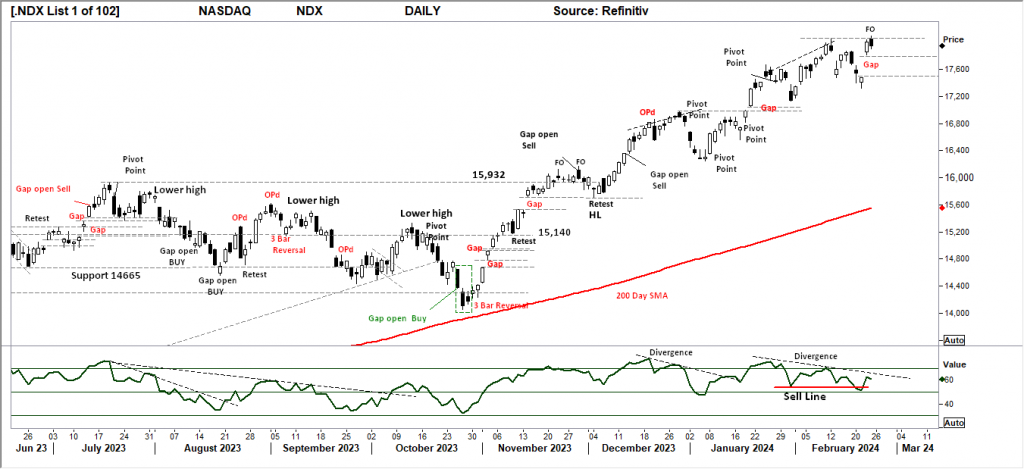
Comments from last week: An exhaustion move is now underway and further upside may be limited until a price retracement ultimately tests the buyer’s strength. Many unresolved “Gaps” remain in the price structure. Following last Tuesday’s opening Gap down, the index has failed to find real buying strength closing lower for the week. The current Earning reports coming to the market remain consistent with a growing economy. As the reporting season comes to completion and stocks are re-rated, a further direction movement has the potential to set new highs.
USD Spot GOLD – DAILY: Early Bullish move.
As discussed last week, gold has moved higher to retest the $2049 level with an OPu outside range now in place from last Friday’s close. Gold remains range bound between $1982.0 and $2049.0 so any breakout higher or lower would be an important observation. Should the price continue over this resistance level a further close over the key $2072 level would be a very bullish indication for further gains this week.
Indicator: Relative Strength 14
The RSI is turning higher from below the key 50 level, with the reversal in price, only a breakout higher will move the indicator higher above the 50 and again higher to the 70 level; the Relative Strength reading below 50 indicates bearish momentum. Long-term traders should continue to monitor this Daily chart for a 5th major yearly top in progress at the $2072.0 level with further declines in the long term.
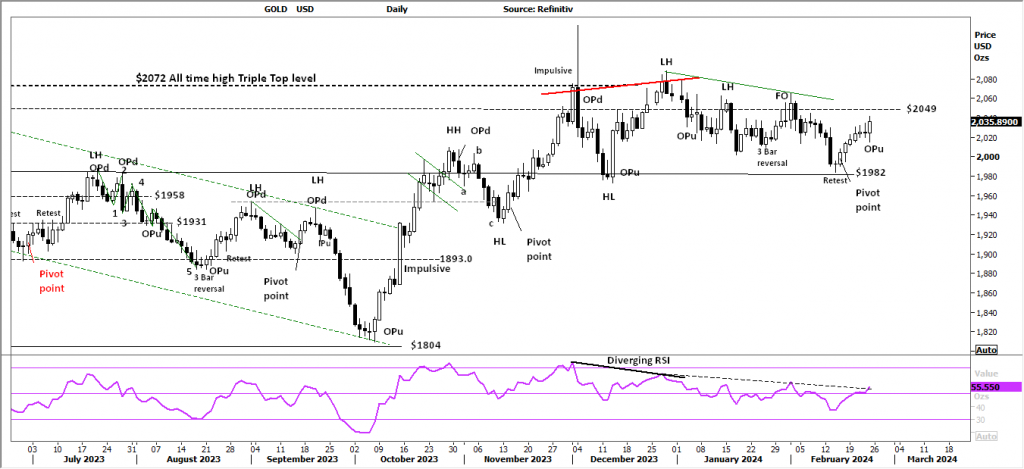
Comments from last week: Gold has again retested the $1982.0 level with immediate buying lifting the price back above the key $2,000 level. With the current price action remaining within a large consolidation zone, the current pivot point reversal has the potential to again retest the $2049-50 resistance level. Should the price continue over this level, a close over the key $2072 level would be a very bullish indication for further gains this week.
SILVER
Price structure: Bullish flag development
During the past week, Silver has again tested the $22.50 level for support with a high-range close set on Friday. The overlapping bars pattern is Bullish with a breakout higher expected. The $24.60 level remains as resistance and a further retest of this level should be expected as part of the large 12-month consolidation taking place. This week a close over $23.50 would give a bullish view for further gains.
Relative Strength 14
Current Relative Strength has turned higher above the 50 level, indicating momentum has turned early Bullish; if the RSI continues higher, the earlier divergence signal will give way to a strong Buy signal. Only a continued move higher would reflect a solid change in the underlying price momentum and should alert to a potential new trend and breakout.
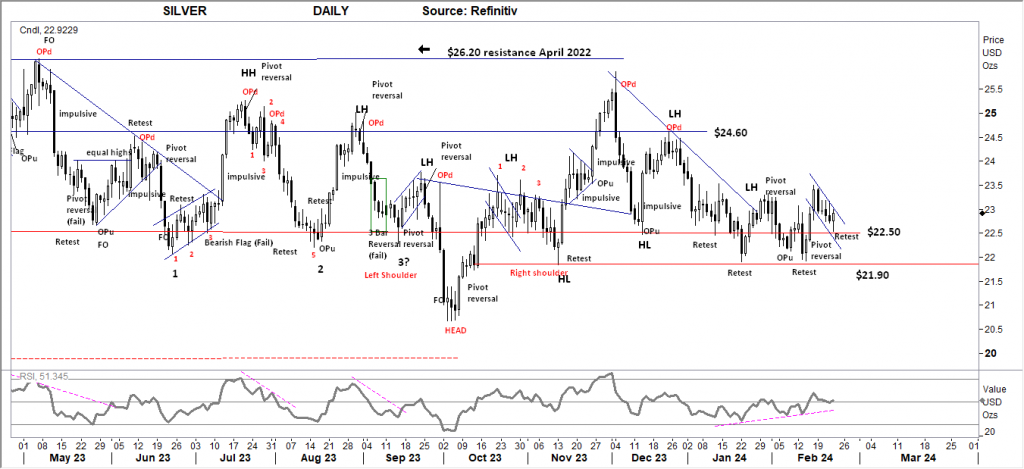
Comments from last week: The two key levels in Silver are support at $21.90 and resistance shown at $24.60 and $26.20. The Silver contract this week closed at a 3-week high ($23.50) in a very bullish move from the $21.90 key support level; some higher levels of resistance remain, and the strong range bars set last Thursday and Friday suggest strong buying and a solid momentum move underway.
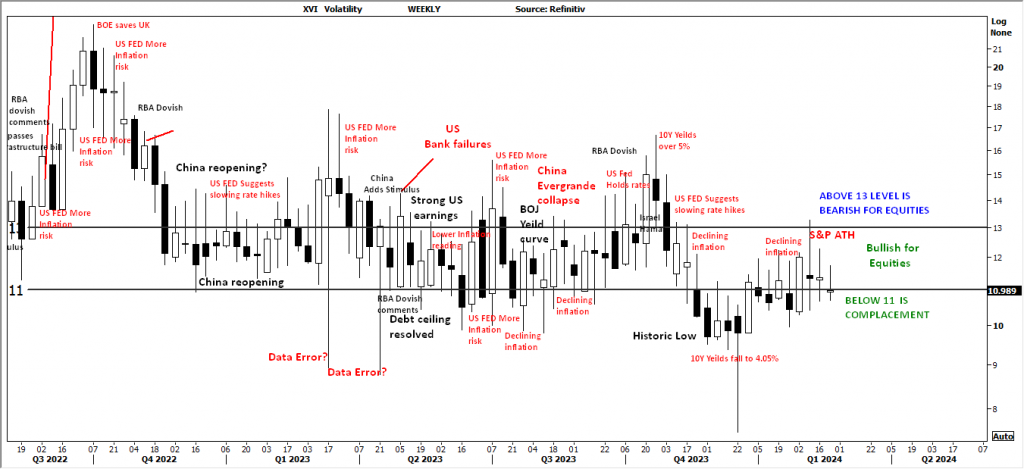
AUSTRALIAN VOLATILITY INDEX: The equities traders compass.
The current volatility closing value has moved to close above the 11 level following a move towards the 13 level.
The closing value indicates the XVI remains within the “bullish” level.
With the indicator moving higher early in the week, the forward pricing of PUT options (insurance) was increasing; this is observed against a rising market, indicating equity price movements may turn bearish as the cost of 3-month (insurance) Put Options is increasing, suggesting the market is moving to a protect profits mode.
For continued support of equities, the XVI should remain subdued below the “13” level.
The cost of 3-month forward PUT options is decreasing from recent elevated levels.
The XVI is the difference between the 3-month forward pricing of ETO Options against the current month.
As markets anticipate events, the forward-priced option volatility changes, hence as forward price changes, this “skew” in pricing is measured in this XVI.
The XVI value works as an inverse correlation to the underlying market.


 Access +10,000 financial
instruments
Access +10,000 financial
instruments