
Market technician’s view of charts that affect Equities.
Consideration for equity traders this week, the Federal Deposit Insurance Corporation (FDIC) is preparing to place First Republic Bank into receivership; this may drag on sentiment in the Australian market as the “Sell in May” phenomenon has the potential to play out. The U.S. debt ceiling crisis is set to reach boiling point between June and August; it promises to be a volatile US
summer for financial markets. The possibility that the Bank of Japan reverses course and starts tightening policy around about the same time means it could get even stickier. With the Australian
market remaining remarkedly robust within the top 100 equities, traders could be in for a bumpy ride in the month of May. Sectors to watch this week are the XFJ Financials, with the potential for the major banks to set a technical base after many years of consolidation; this may lead to a breakout to the high side. And the XMJ Materials Resources continue to show volatility in both directions as the price of Iron Ore stabilises slightly to around US$116.0.
XJO WEEKLY
Price structure: Primary UP trend remains in place.
The XJO has continued a consolidation pattern under the 7370 resistance level, last week’s small range bar has followed the Fake-out (FO). These types of retests of overlapping price ranges, show
currently consolidating sentiment can develop in this case at a level below 7370. The potential for a solid close over 7370 remains with the next target at 7565. Another example of a false breakout low is the retest on the week ending 24th March. With the heavy weighting of the banks and industrials within the Index, this type of Index consolidation will be heavily reflected in the top 20 index components.
Indicator: Relative Strength 14
Relative Strength has remained above the 50 levels (just) as part of the overall change in momentum. Further movements over the key 50 level towards the 70 level will remain very bullish for further gains.
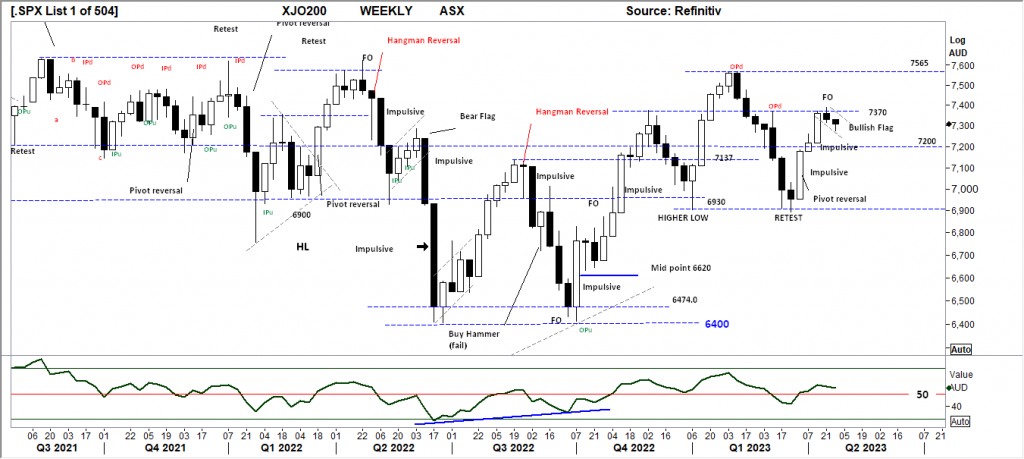
Comments last week: The XJO has continued a consolidation pattern under the 7370 resistance level, last week’s small range bar set a Fake-out (FO) as the Outside period (OPd) high of the week ending 10th of March. These types of retests often trap the breakout trader into a false breakout. Currently, consolidation can develop at this level below 7370. Another example of a false breakout is the retest on the week ending 24th March. With the heavy weighting of the banks and industrials within the Index, this type of Index consolidation will be heavily reflected in the top 20 index components.
XJO DAILY
Price structure: Sentiment remains positive
The daily chart displays the bullish flag developing below the 7370 level, the lower daily shadows indicate buyer support on a daily basis. Short-term traders should look for a change to positive sentiment. Also of note on this chart is the 200-day simple moving average turning higher with the Index value remaining above the average. Sentiment remains positive within the index
components, with the top 20 remaining resilient.
Indicator: Relative Strength 14
The Relative Strength Indicator (14) remains very bullish as the reading over the key 50 levels indicates price momentum remains positive. Fridays turn higher, which is a positive shift in momentum and may improve in the coming days; bearish traders should monitor this for a cross below the key 50 levels.
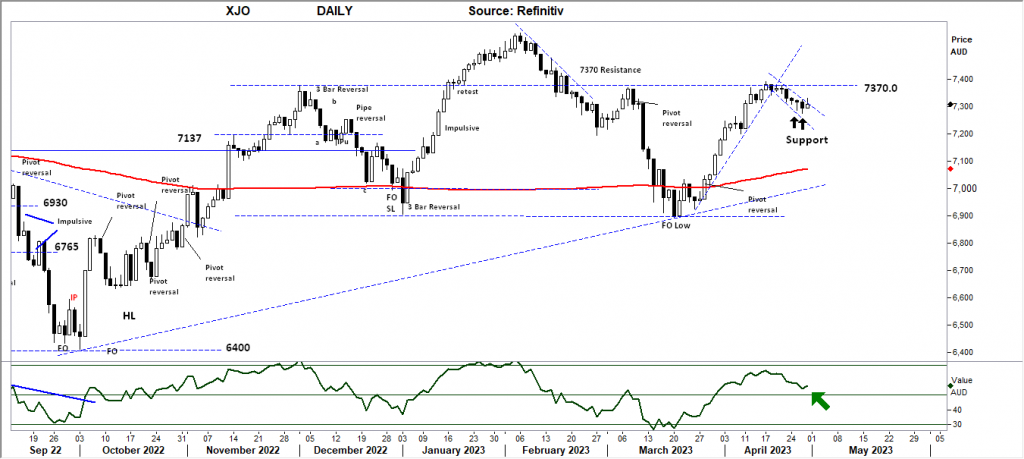
Comments last week: With Daily price consolidation underway, the extended Friday period may result from ETO Option expiry on Thursday and exercise selling on Friday. Of concern is the bearish extended range of Friday; in the coming days, a close over 7375 points would be very bullish for further gains. In the short term, a close over this 7375 resistance could be a key development in the coming days.
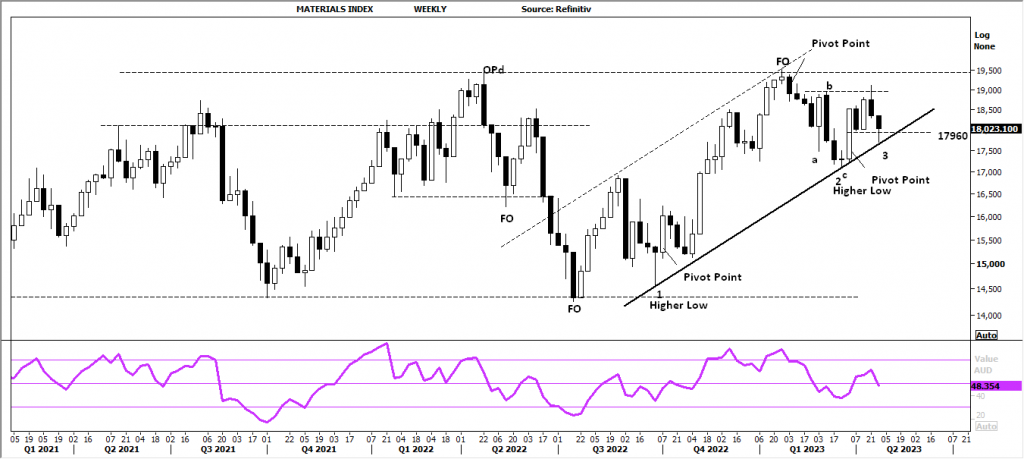
Australian Materials Index XMJ: Looking for the breakout
The Australian materials index XMJ has been busy developing a trading channel, based on this weekly observation, the Index remains in a Primary up trend. Current underlying resource stock
prices also reflect the long consolidation period, with the dividends in the top 5 remaining attractive for long-term holders. The recent movement to find support around 17,000 has set the reversal to push the index higher only to find resistance at 19,500 points; a further close over this level will keep the Index within a strong momentum move.
Immediate support is observed at 17,960 points.
The major resource companies trading within ranges, with the exception of MIN.ax currently pushing below the $75 level. Relative Strength has moved to the key 50 levels, indicating slowing price momentum, this is typical of the RSI during price consolidations, a move below this level would also activate the Stop loss.
S&P 500 WEEKLY
Price structure: Bullish consolidation
The Weekly chart is currently developing a very bullish ascending triangle, with the continuing resistance level of 4200 still in play. The current outside range may pose a short-term resistance
point for Monday-Tuesday. Traders should look for a solid close over this 4200 level as a signal of price strength. With breakout comes retest; for sentiment to remain strong, a retest of the 4200
must provide support.
Indicator: Relative Strength Indicator 14
Relative Strength is travelling over the key 50 levels, but to remain bullish, the RSI should continue to turn higher towards the 70 levels with further underlying price advances.

Comments from last week: Commentary remains the same for this week as the S&P remains within a very narrow trading range, with 4200 showing as resistance and 3600 as support. The recent higher low points above 3765, followed by the 3 bar reversal pattern, remain a bullish development, with further gains expected; a solid WEEKLY close over the 4200 would inflict a solid short-covering rally. As the trend develops, higher resistance levels remain in play at 4545 and above.
S&P 500 DAILY
Price structure: Swing low in place
The bullish flag described last week has initially broken down thru the 4067 level with an immediate reversal to close over the key 4130 level, such is the current volatility. The critical observation is the strong impulsive movements of last Thursday setting a pivot point and Friday following through. Although the Weekly chart (above) resulted in an Outside period, the daily chart suggests further upside in the short term.
Indicator: Relative Strength 14
Relative Strength is above the 50 levels, as momentum remains positive. Further price strength for this index will see the RSI move higher above the key 50 levels, only the RSI rising above the key 50 levels would further confirm bullish price momentum.

Comments from last week: Big picture consolidation remains with a small bullish flag developing within the last five trading days, with the closing price remaining above the now key 4130 level. With earning season underway, this weekly chart will offer the best insight into the overall direction for the next week. At the moment, this chart remains bullish for further gains.
NASDAQ DAILY
Price structure: consolidation and 3 Bar swing low
The Nasdaq produced a new higher low with a key “3 bar reversal” pattern and a small “bear trap” during the past week, with the current bar setting a “fake out” over the 13,200 level, a short-term
the top may be in for the next few days. The underlying primary trend is UP, with the expectation of further gains within the current price structure.
Indicator: Relative Strength 14
The Relative Strength indicator moving back above the 50 level with the current price breakout. This is a strong development but should always be monitored for a decline below the 50 level
indicating an underlying change in momentum.
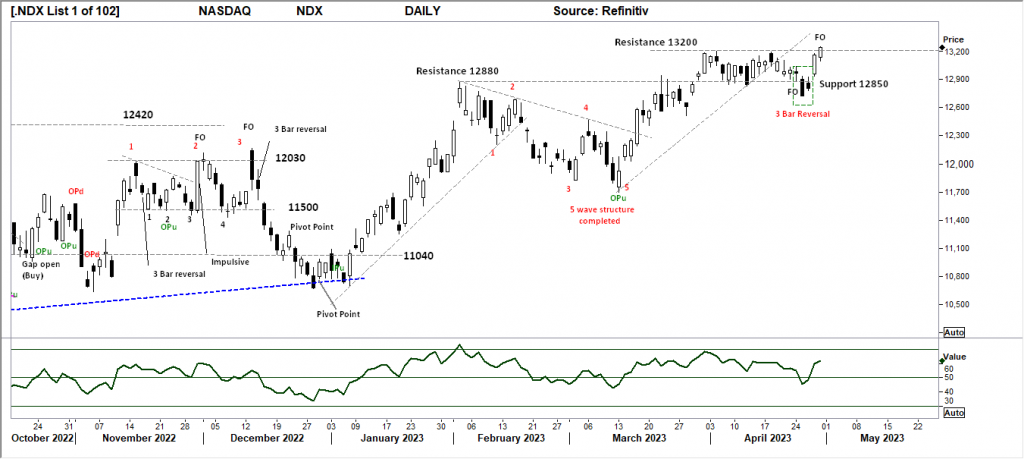
Comments from last week: The Nasdaq is currently testing the recent breakout above 12880 using this level as support and remains within a bullish advance extending back from the December 2022 lows. Further gains above the 13200 level will be seen as confirmation of the current bullish pattern.
USD Spot GOLD – DAILY: Is it a Bull market? Maybe not
Last week again proved the 1982 level as key support following the short price movement below this level. The pivot point bar of 6 weeks ago remains the dominant trading range holding the price
down. The potential is for a short-term top to develop as the current price movement remains below the “midpoint” of the pivot bar as this consolidation had not moved above the $2049 high within the following 6 bars, the structure is now deemed as a bearish setup. Only a closing price towards the $2020 level would negate this view.
Indicator: Relative Strength 14
The RSI declining to the 50 levels and showing a diverging decline against the consolidating price pattern is a normal occurrence in price consolidation patterns. With the RSI at risk of moving below the key 50 levels, traders should monitor this chart for a short-term top in play.

Comments from last week: Last week again proved the 1982 level as key support following the short price movement below this level. The pivot point bar of 6 weeks ago remains the dominant trading range holding the price down. The potential is for a short-term top to develop as the current price movement remains below the “midpoint” of the pivot bar as this consolidation had not moved above the $2049 high within the following 6 bars, the structure is now deemed as a bearish setup. Only a closing price towards the $2020 level would negate this view.
SILVER DAILY
Price structure: Bull market – Maybe
Commentary around Silver remains the same as last week; following the OPd top bar, the price of Silver has begun a consolidation phase above the $24.40 level. The $24.61 low set on 19/4 will
remain the key support bar in the coming days. This consolidation phase remains bullish for further gains until a close below $24.40 is followed by further lower closes. Resistance remains
at $26.20; a price close to this level would be bullish.
Relative Strength 14
Current Relative Strength has turned lower from over the 70 levels; the current movement is moving towards the 50-level, RSI turning lower reflects the underlying upward momentum decreasing but remaining positive above the 50 level. A continuing move below the 70 and 50 levels and lower would be a bearish signal in the short term.

Comments from last week: Following the OPd top bar, the price of Silver has begun a consolidation phase above the $24.40 level. The $24.61 low set on 19/4 will remain the key support bar in the coming days. This consolidation phase remains bullish for further gains. Resistance remains at $26.20; a price close over this level would be a very bullish development.
AUSTRALIAN VOLATILITY INDEX
The equities traders friend.
The current volatility remains below the important 13 levels. While volatility remains at this level, equities sentiment remains mildly bullish.
The volatility reading increased last week and remains below the 13-level, indicating that the forward pricing of PUT options is declining.
In general, lower consolidating commodities and equity prices or consolidation of equity prices is indicated as the reading remains above the 13 levels.
The XVI should remain subdued below the “13” level for continued support of equities.
The cost of 3-month forward PUT options is decreasing from recent elevated levels.
The XVI is the difference between the 3-month forward pricing of ETO Options against the current month.
As markets anticipate events, the forward-priced option volatility changes; hence as forward price changes, this “skew” in pricing is measured in this XVI.
The XVI value works as an inverse observation of the underlying market.

IMPORTANT DISCLAIMER
The information in this report is of a general nature only. It is not personal financial product advice. It does not consider your objectives, financial situation, or needs. You should therefore consider the appropriateness of this general information in light of these. The Australian School of Technical Analysis (www.astatrading.com) recommend that you refer to the Product Disclosure Statements of any financial products discussed in this report before making any investment decisions. ASTA accepts no responsibility for your actions and recommends contacting a licensed advisor before acting on any information in this general information report.


 Access +10,000 financial
instruments
Access +10,000 financial
instruments