
XJO WEEKLY
Price structure: Consolidation
The impulsive move of 2 weeks ago remains unchallenged with last weeks small range remaining at the high of the previous impulsive bar. Resistance remains at 7200, a closing breakout over this level would be very bullish for further gains. The key support level remains at 6930. With the current close over the late June high a bullish continuation could be expected in the coming weeks.
Indicator: Relative Strength 14
Relative Strength has closed above the 50 level as part of the overall change in momentum. Price momentum has turned significantly to the upside indicated by the rising RSI, a further movement over the key 50 level towards the 70 level would be very bullish.
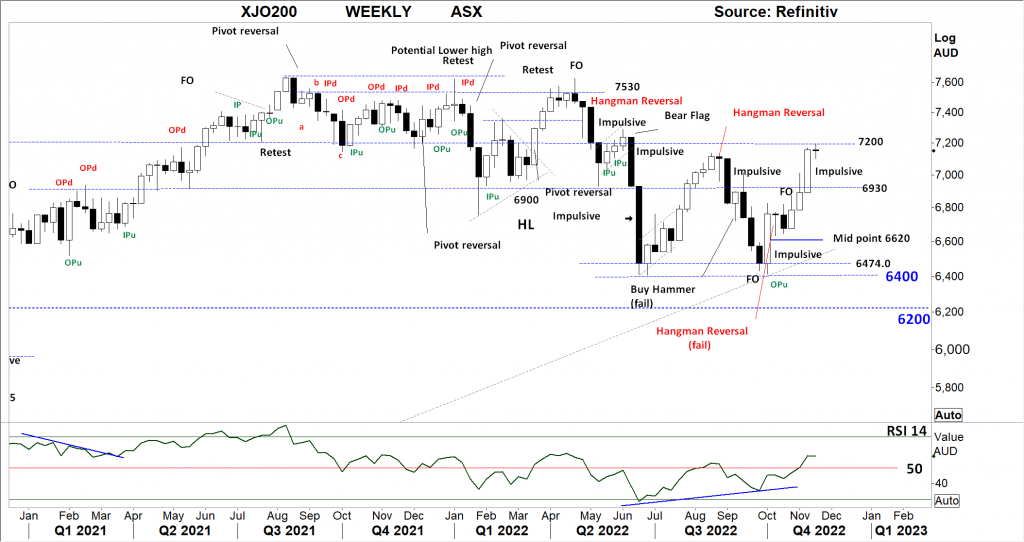
Comments from last week: With a clear break away from the 6930 level, the 7200 level remains as resistance this week. The very strong range can be indicative for further gains. With a strong price movement from the 6400 low area this current movement higher is regarded as corrective. Resistance at 7200 is regarded as significant, a decline from this level must find early support to indicate a new UP trend may be developing.
XJO DAILY
Price structure: Coming out of a base.
Inline with the weekly comments the current price action in the Daily chart is bullish for further gains with a close remaining over the 7130 level. Continued movement will target 7370 resistance. The Daily movement is currently trending, traders would look for a reversal pattern to indicate a loss of positive sentiment.
Indicator: Relative Strength 14
The Relative Strength Indicator (14) reflecting the underlying price momentum has moved higher over the 50-level indicating a change in momentum. Relative Strength is moving in sync with the daily action of the market and does offer a trading signal as momentum is currently shifting to the upside. Early momentum failure would be indicated with a closing price again below the 7130 level.
Indicator: VOLUME
Volumes continue to decline in this small congestion area, this is a continuing bullish development. High volume over 1Bil indicates fresh money flow and remains very supportive for further gains. Only DAILY volumes over 1Bil on a Daily basis would indicate strong new money buying.
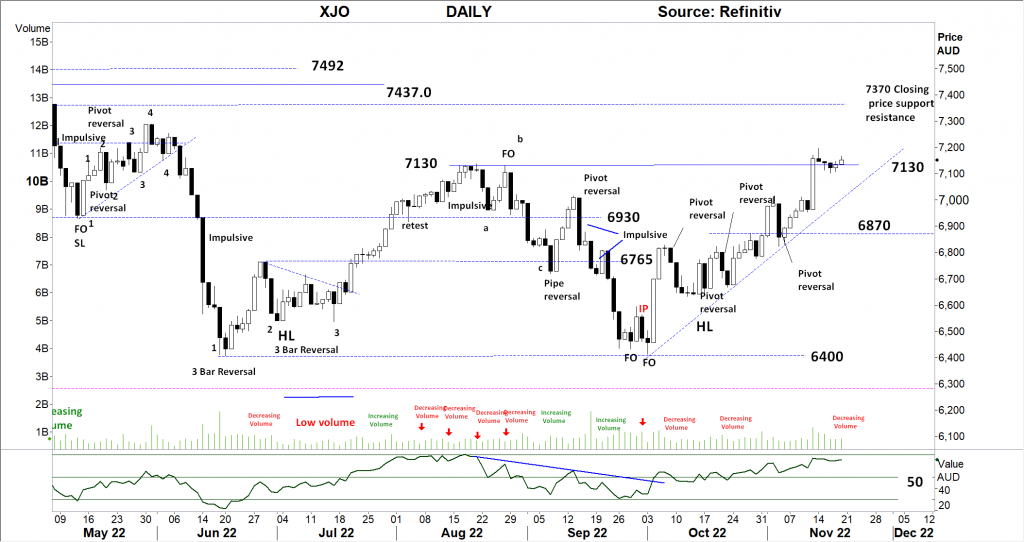
Comments from last week: The impulsive movement last Friday closing above the Daily resistance level of 7130 is an important development for the bullish case to retest the 7437 resistance level being the initial breakdown level during May 2022. Not shown, the Index has now regained the 200 day moving average an important level for buyer to monitor.
S&P 500 WEEKLY
Price structure:
The small range bar last week indicates the market is in balance, with the very important level of 4050 remaining as resistance. A breakout from the trendline would be significant for the bulls, next important resistance is 4200.
Indicator: Relative Strength Indicator 14
Relative Strength has set a new higher low and currently moving over the key 50 level (just) indicating positive momentum. To remain bullish the RSI should remain over the 50 level during this current price advance.
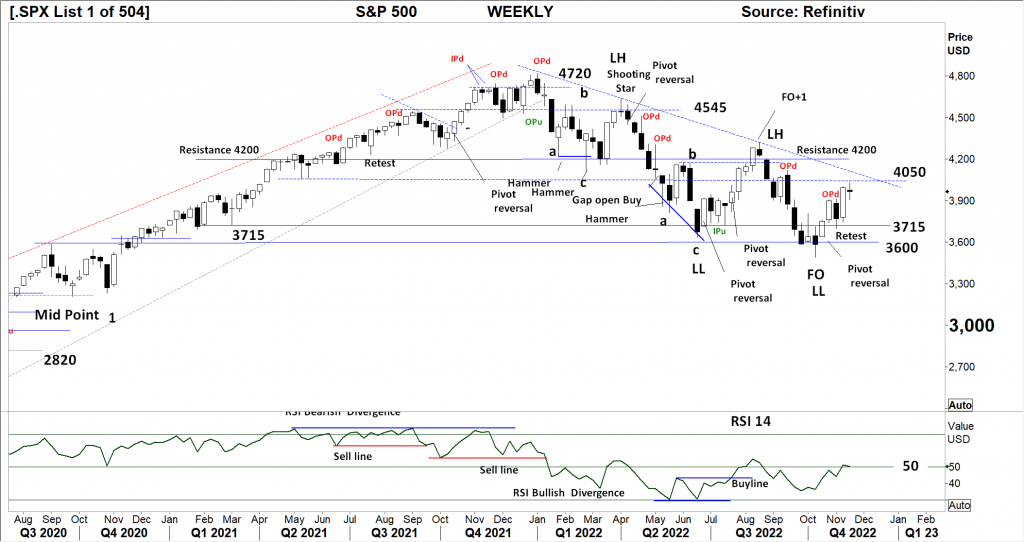
Comments from last week: The S&P 500 remains with a Primary down trend, the current successful retest of the 3715 support level is an important confirmation for the buyers with this week closing over the OPd high. The current past 4 week remains a retracement inside the current down trend. Last weeks strong range low to high suggest further gains for the coming week, to remain bullish a close over the 4050 level is required.
S&P 500 DAILY
Price structure: Confirmed bullish structure.
Last Friday set a new buy pivot as the index test the 200 day moving average and retraces to test 3940 also testing the October high. This pattern remains very bullish for a further advance as price action this week following the Friday pivot point has the potential to retest the 200 day average. With the Daily trend developing higher price could be expected.
Indicator: Relative Strength 14
Relative Strength has turned higher and moving over the 50 level, a very strong indication of immediate improving momentum. Further price weakness for this index will see the RSI move lower below the key 50 level.
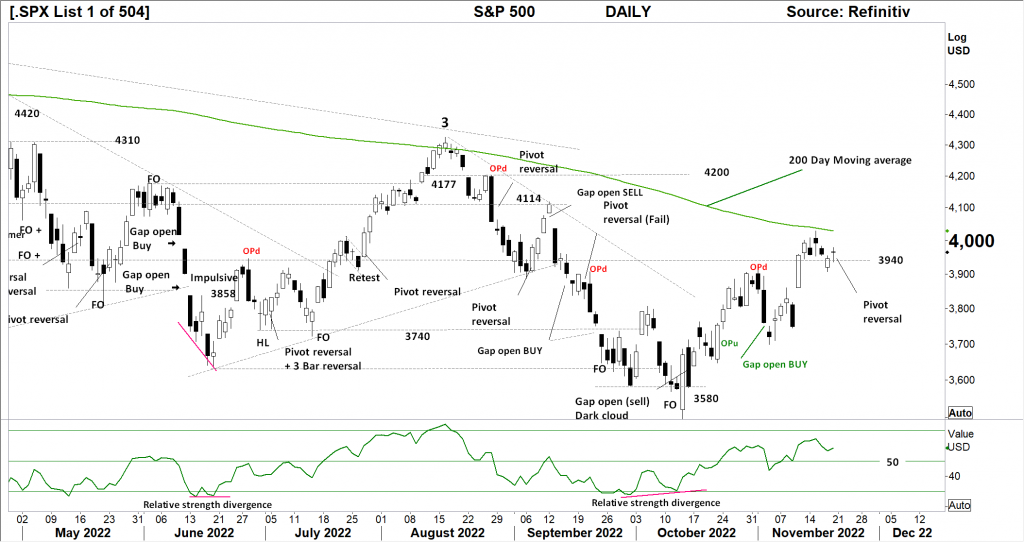
Comments from last week: The higher low indicated last week has played out with a strong price gain over the 3940 level, this remains very bullish for further gains, with the next significant daily target shown at 4200. The 200-day moving average may provide some resistance in the coming days and should be monitored for a closing price above the indicator level.
NASDAQ DAILY
Price structure: Base continues to build
Trend strength in the Nasdaq remains weaker than the S&P 500, although a small 3 bar reversal pattern is present an immediate follow through is required to confirm the set up.
12400 remains the current price target as this trend develops. A close look at the individual bar shows lower shadows remain. prevalent as the Index moves from the October lows.
Indicator: Relative Strength 14
The Relative Strength Indicator moving back above the 50 level but moving sideways in line with the current price decline back to retest the October high area around 11,600. RSI turning higher would indicate improving positive momentum.
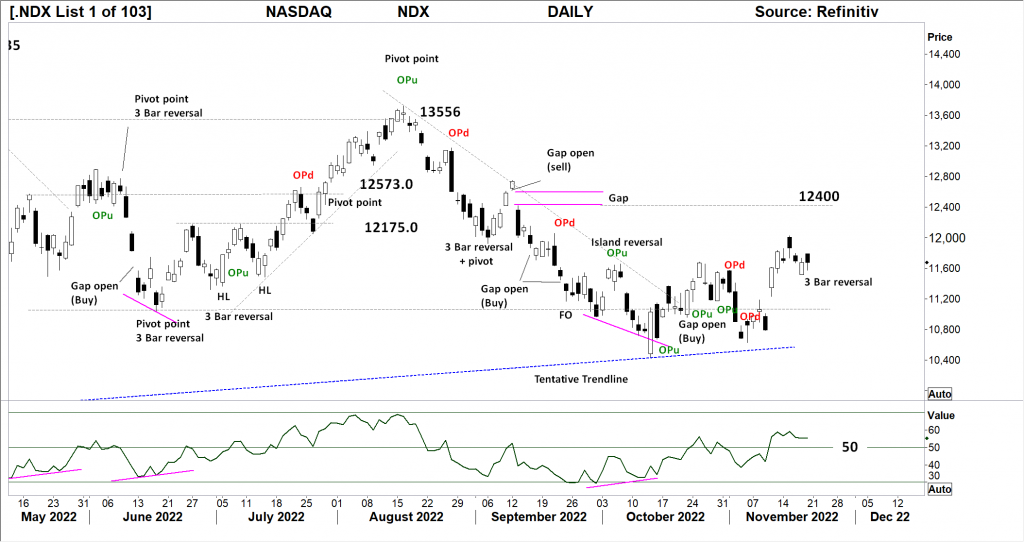
Comments from last week: The last OPd has confirmed the trendline, current price gaps up from this low area are breakaway gaps and should be regarded as bullish for further gains. The next significant price target remains the “gap” at 12400. Current daily price trend is UP.
USD Spot GOLD – DAILY: Is it a Bull market? Yes
A very strong price rally, failing to make the $1804 level has Gold retracing back towards the $1730. A good development for a trending action should this lower level hold and price rallies this will affirm a developing trend. This is a significant development for Gold price structure following the 3 spike low pattern.
Indicator: Relative Strength 14
The RSI moving above the 50 level and rolling lower indicates a swing in momentum direction. A positive observation going forward is for the RSI to remain above the 50 level. (Price consolidation would naturally see the RSI drift back too around the 50 level. A strong movement either way will show the next directional move.)
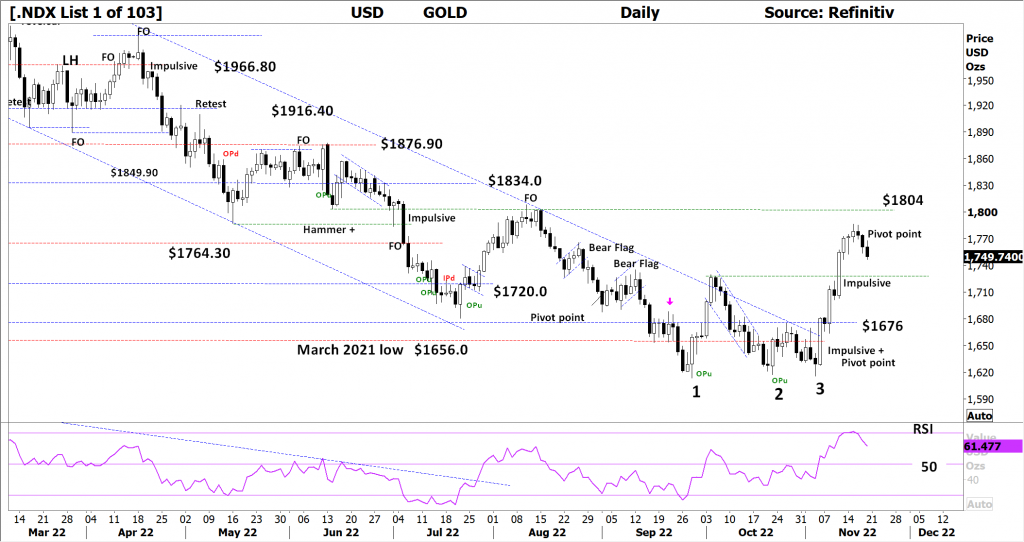
Comments from last week: With the current very strong breakout movement taking shape following the 3 spike low pattern the next target remains the $1804 resistance level as price clears the $1740 level. By definition Gold is yet to set a Primary up trend with the current movement being a “corrective” move against the Primary down trend.
SILVER DAILY
Price structure: Bull market? – Almost.
The structural trend pattern in Silver is more advanced than the Gold pattern with current price movements retesting the breakout level od $20.80. This is an important support level for Silver to hold in the coming week. The Silver chart has the 3 spike low pattern similar to Gold indicating the base pattern is in and complete.
Relative Strength 14:
Current Relative Strength is rising sharply with the current movement ticking higher towards the 70-level, RSI turning higher again would reflect the underlying momentum again increasing and remaining positive. A continuing move above the 70 level and higher would be very bullish signal in the short term. Price consolidation results in the Relative Strength turning back towards the 50 level.
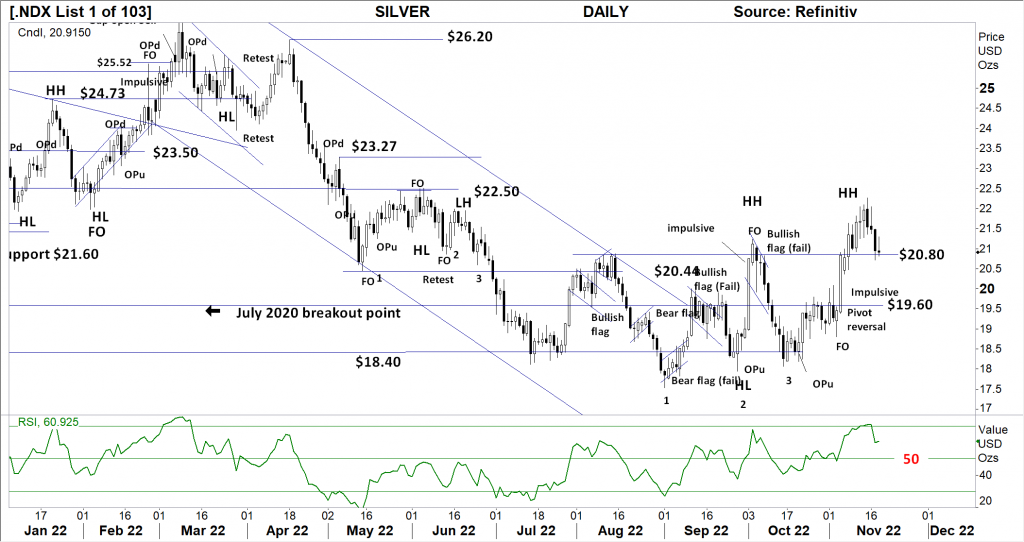
Comments from last week: Silver has been the early mover from two months ago setting the “higher low” the current follow through higher is losing momentum as the market sets a higher high with an indecision bar with the open/ close almost equal. An important retest of the $20.80 level is probable as the current up trend develops, support at this level would be very bullish for further gains over the next few trading weeks into the xmas period.
AUD GOLD DAILY
Price structure: Consolidation remains
Australian dollar Gold continues to consolidate above the $2580 level with a bullish flag developing following the resistance point of $2676. Overall price remains within a large consolidation zone from March 2022 to the current period.
Indicator Relative Strength 14:
Relative Strength has turned lower in line with the price action following the rise from below the 50 level. Overall, momentum has now turned Bullish. A continued movement above the 50 level would be a strong positive for further price gains.
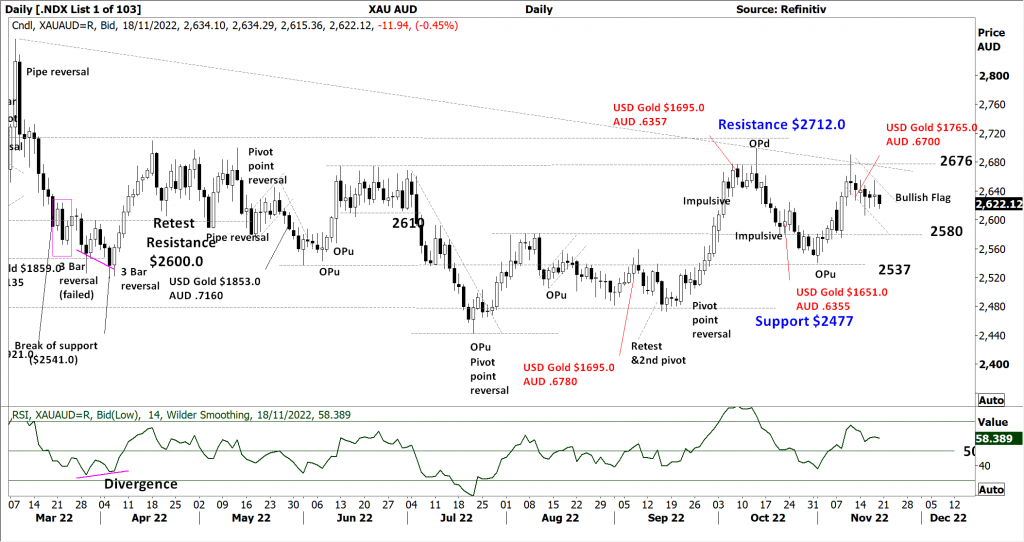
Comments from last week: Price resistance again at the $2676 level, not a great signal for further immediate gains. Australian gold producers may see some price weakness in the coming week. The AUDXAU price remains within a large consolidation zone below $2712 and above $2477. Further price gains over the resistance level would send a very bullish signal to local producers and offer further price gains for the trader.
DAILY COPPER
Price structure: Potential breakout.
The Monday gap down and follow through fast rejection of higher prices without finding support at the $3.80 highlights the base building volatility at times found in the metals. The key observation is price remains within the base pattern, a break lower from the $3.47 level would be very bearish.
Indicator: Relative Strength 14
Current reading has swung from below the 30-level to again turn higher as downward momentum has stopped , however the current reading has not remained above the key 50 level. The key now, is for the RSI to swung back above the 50 level as a reflection of ongoing price gain momentum.
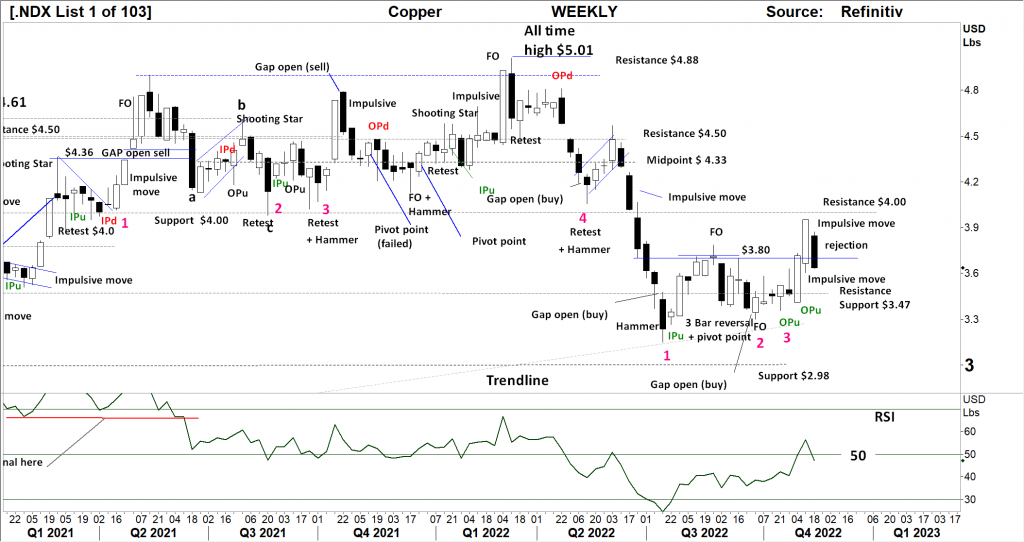
Comments from last week: Copper has set a classic 3 spike low pattern confirmed this week with the strong breakout above the $3.80 level. Current price movements indicate a test of the $4.00 resistance level is underway. This will remain a strong positive for local copper players OZL and S32. A further break over the $4.0 level could be expected as an extension to the current strong low to high impulsive price range.
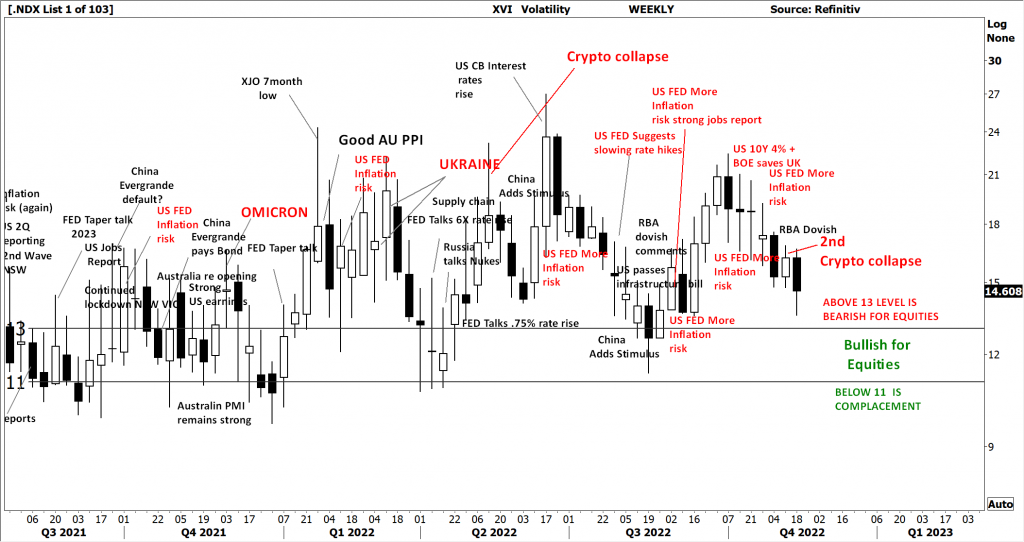
AUSTRALIAN VOLATILITY INDEX
Volatility reading has moved slightly lower from last week and remains above the 13 level indicating forward pricing of PUT options is weaker. In general, lower to consolidating commodities prices and equity prices or consolidation of equity prices is indicated as the reading remains above the 13 level.
For continued support of equities, the XVI should move below the “13” level.
The cost of 3month forward PUT options is decreasing from recent elevated levels.
The XVI is the difference between 3-month forward pricing of ETO Options against current month.
As markets anticipate events, the forward priced option volatility changes, hence as forward price changes, this “skew” in pricing is measured in this XVI.
The XVI value works as an inverse observation to the underlying market.
USD DOLLAR INDEX
Price structure: Setting a lower low
The Daily chart indicates a secondary market is developing in the DXY above the 105.80 level following the strong momentum decline out of 110.75 and subsequent break of the trendline. The USD Index remains in a primary down trend with 104 as the primary target on further weakness.
Indicator: Relative Strength 14
The Relative Strength has turned lower in line with price movements indicating further consolidation as the current reading is now below the 30 level. This will move lower to sideways should price decline, only a continued reading back above 30 and then the 50 level would indicate a change price momentum.
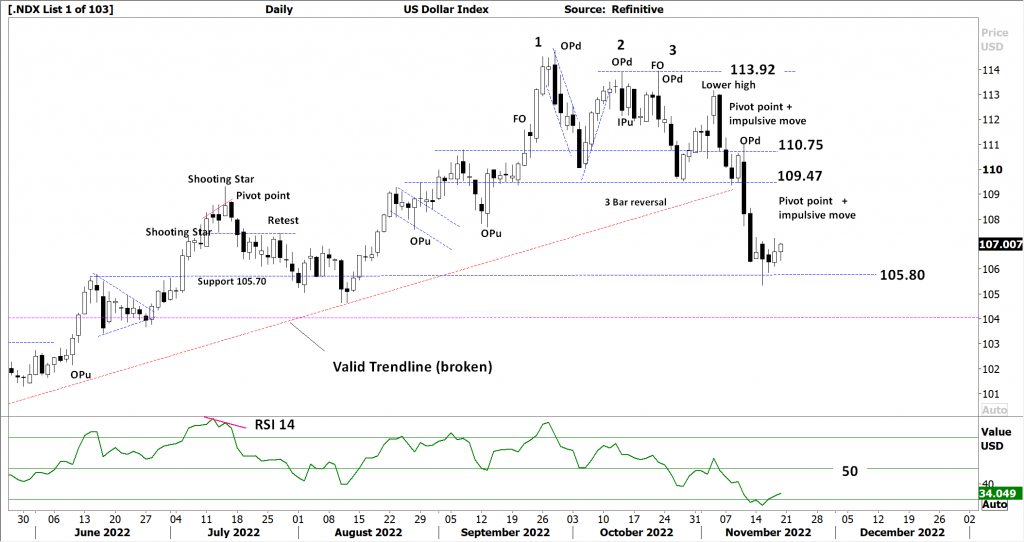
Comments from last week: From the current OPd and last Fridays impulsive price movement, the DXUY has now further confirmed a Primary down trend is underway. The current movement can be regarded as a capitulation move lower. Strong price momentum may not find support at the highlighted levels, however the significant support level of 104 remains.
WTI – CRUDE OIL
Price structure: Full Bull Market remains-just.
This commodity is highly news driven around supply -demand. A significant price breakdown from the $84.25 level shows the Price movement starting to “trend” lower. $75.20 remains key support on any further weakness. The lower shadow of the current bar is indicating late week support. Price remains within a consolidation zone between $75.20 and $94.0
Indicator: Relative Strength 14
The RSI running around the 50 level is a result of consolidation as upward momentum slows, recent price reversal has resulted in a sharp movement below the key level of 50 signalling decreasing price momentum. Developing Consolidation with a mixture of advance and declines sets the RSI up to continue a move around the 50 level.
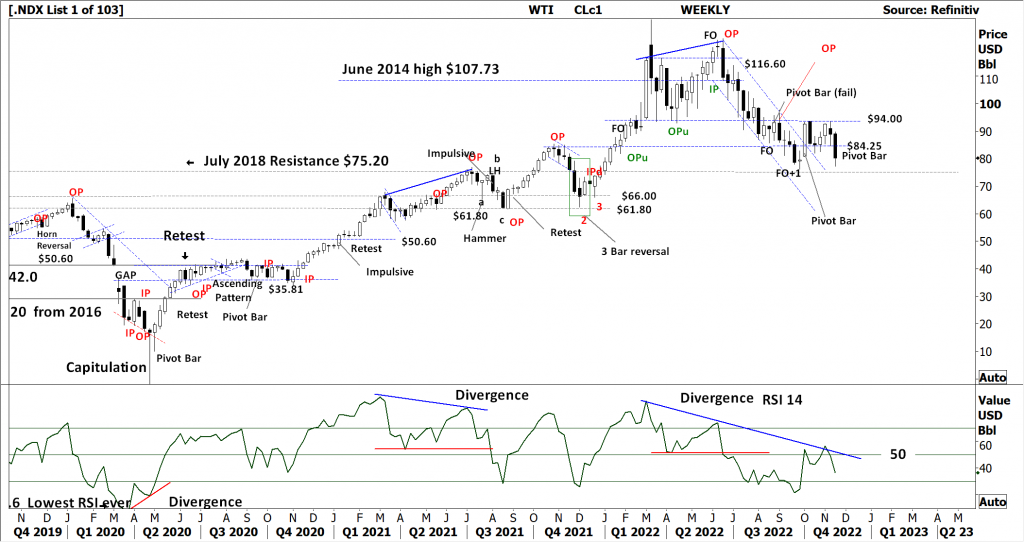 Comments from Last week: Price consolidation continues between the $84.254 and $94.0 level. A close over the $94.0
level would be a bullish signal indicating buyers. A close below this accumulation area would send a very bearish signal with
the potential to retest the $75.20 level.


 Access +10,000 financial
instruments
Access +10,000 financial
instruments