
XJO WEEKLY
Price structure: Primary trend remains
This current retracement with the price moving below the 7200 level has set up the index for further declines. It is important to note the Index remains in a bullish phase recently taking out the 7137 high. This current retracement is retesting this breakout level. In the short term, a breakdown below this level in the coming week will set up a bearish picture for further declines towards 6930.
Indicator: Relative Strength 14
Relative Strength has closed and remained above the 50 levels as part of the overall change in momentum. Price momentum has turned sideways further movements over this key 50 level towards the 70 levels would be very bullish.
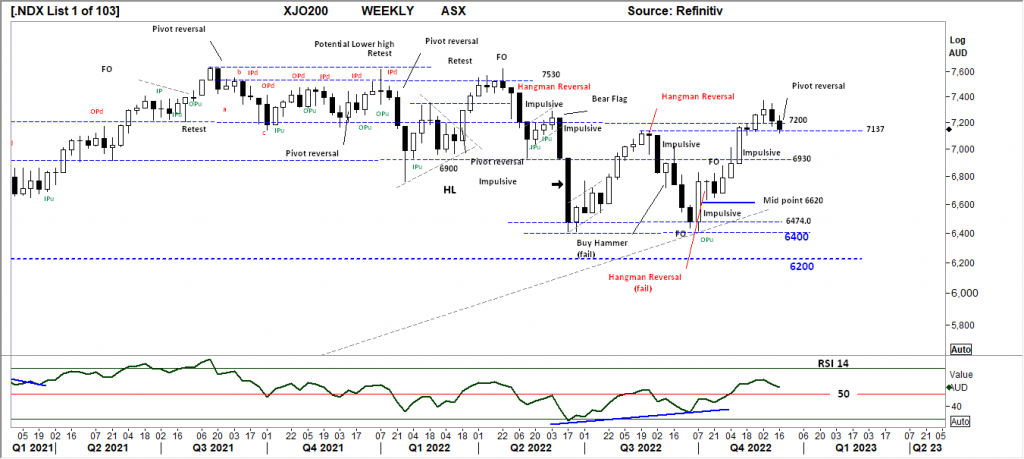
Comments from last week: The current retest of the 7200 level remains positive for further gains with the weekly close remaining above this important level. A close below this level on a weekly basis will ensure further selling with the 6930-level coming back into play. However, the primary movement remains UP with 7530 the current prime price target.
XJO DAILY
Price structure: Breakout failure
The potential for an a, b, c type of price decline (bullish) remains with the close above the Daily Support -resistance level of 7137. Last week saw the break of the short-term trendline as the daily chart has turned neutral to bearish with the potential to retest the 6870 level and the 6930 (weekly) level of support. The Daily trend is now Down.
Indicator: Relative Strength 14
The Relative Strength Indicator (14) reflecting the underlying strong price momentum has moved lower from the 50-level indicating weakening momentum the turn lower should be monitored for further declines. Relative Strength is moving in sync with the daily action of the market and does not offer a trading signal overall as momentum is currently shifting to the upside. Early momentum failure would be indicated with a closing price again below the 7137 level and a place to monitor for bearish divergence signals.
Indicator: VOLUME
Volume has remained static in line with historical average volumes. The high-volume day last Friday from Options expiry does not indicate a bearish volume bar. Only DAILY volumes over 1Bil on a Daily basis would indicate strong new money buying.

Comments from last week: Last week’s commentary has set the scene for further gains in the Index value (positive sentiment) last Friday’s close has set a new 3-bar bullish reversal signal. The inside day set on Friday shows the market coming into balance, potentially before a new rise takes place. A daily close below the 7200 level would be a bearish signal. The Daily trend remains UP with 7437 as the primary target.
S&P 500 WEEKLY
Price structure: Bearish trend
Rejection at the down trendline with an OPd (outside down close) had the index move higher outside of the trendline the immediate price rejection now sets up a strong reversal signal for further declines towards the 3715 level following this large range high to low bar. The Primary trend remains down.
Indicator: Relative Strength Indicator 14
Relative Strength has set a new lower high and has currently moved below the key 50 levels (just) indicating negative momentum. To remain bullish the RSI should return over the 50 levels during any further price advances.
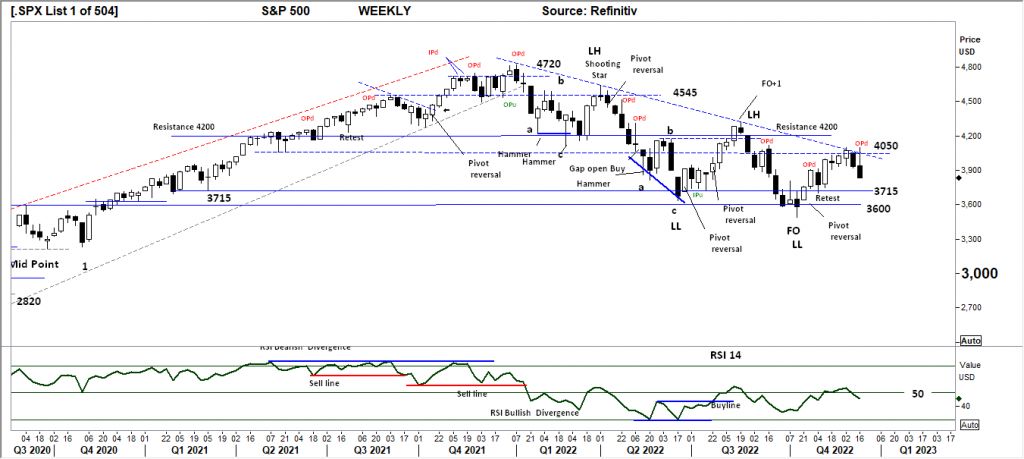
Comments from last week: The down trendline remains the key observation going forward this week, price action has not convincingly shown rejection at this point with the close of the week well off the low. The underlying Primary trend remains down, a breakout of the trendline would send a significant signal to the Bullish that a further test of the 4200 level is underway. A significant short cover would ensue.
S&P 500 DAILY
Price structure: Bearish
The Daily view of the S&P shows the final FO (Fake Out) at the trendline, the whole topping pattern is now complete with 4 significant high points now following thru with a breakdown below the 3940 level (see last week’s notes below) this breakdown also moves price below the short term trendline and the 200 days moving average. The Gap at 3818 is being closed and markets often close breakaway gaps, this may be the case in the coming week, traders would monitor the price action for a reversal at this level.
Indicator: Relative Strength 14
Relative Strength has moved below the 50 levels, momentum has turned negative. Further price weakness for this index will see the RSI turn to move lower below the key 50 levels and further confirm the negative price momentum.

Comments from last week: The later week 3 small range bars are setting up a bearish flag pattern, the Daily 3940 level is the key line to cross to indicate a bearish signal. The 3 spike highs in the background offer a key observation of a primary top in place, with the current price movement also below the 200-day moving average and the key 4028 level, this consolidation area will offer the trade direction with a breakout on either side with 3940 the key support level and 4100 the key resistance level.
NASDAQ DAILY
Price structure: Breakout failure
The 3 highs now identified in the Daily Nasdaq set up the top pattern now confirmed with the price moving below the 11,500 putting the current price decline on track to close the Gap at 11,040. This will be the level to monitor for a price reversal. Failure to hold the 11,040 level puts the Index on course to retest the long-term trendline of circa 10,800 points.
Indicator: Relative Strength 14
The Relative Strength Indicator moving back below the 50 levels with the current price decline back to retest the October low area around 11,040. RSI turning higher would
indicate improving positive momentum.

Comments from last week: The Nasdaq daily chart also displays the 3 short bars set later last week. However, this group also contain a bullish pivot point. The Nasdaq has clearly set up a consolidation zone with 11500 as support and 12,000 as resistance. Breakouts from this type of consolidation are usually a very sharp directional movement, the support resistance levels with remain the key observation in the coming week.
USD Spot GOLD
DAILY: Is it a Bull market? Maybe not
The price structure in the USD Gold chart is developing into a Bearish Wedge pattern, last week also saw a bearish pivot point reversal set in place. The current price risk is high with a strong potential for the Gold price chart to enter into a consolidation zone below the $1804 level and above the $1727 level. A price close to below the lower pattern line will confirm this scenario.
Indicator: Relative Strength 14
The RSI moving above the 50 levels and turning higher indicates a swing in momentum direction, a full bearish divergence signal is now in place as the market set a new closing high with the RSI setting a lower high.
(Price consolidation would naturally see the RSI drift back to around the 50 levels. A strong movement, either way will show the next directional move.)
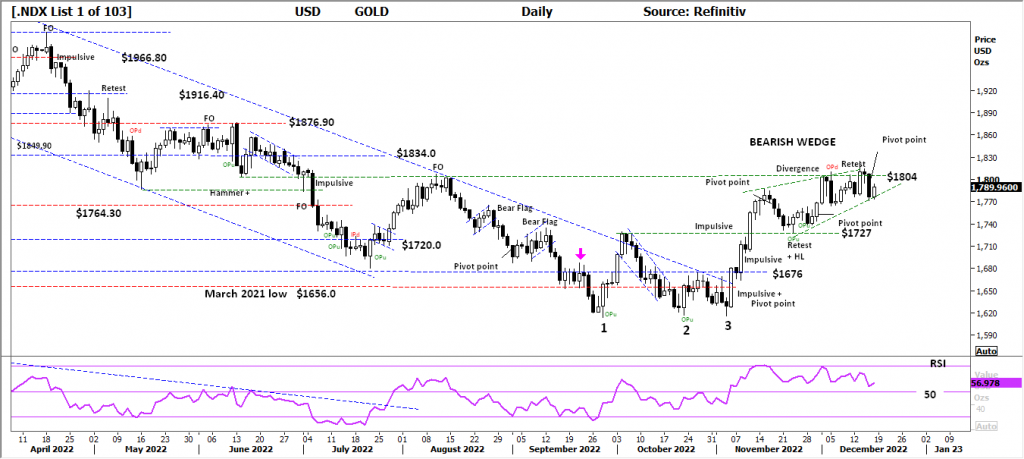
Comments from last week: The $1804 resistance level remains in place with the retest last Friday following the OPd set earlier in the week. The overall picture for Gold remains very bullish within the current primary UP trend. Several resistance levels remain in place at $1834.0 and $1876.0. Current consolidation above $1770.0 remains positive for sentiment.
SILVER DAILY
Price structure: Bull market – Maybe
Last week’s price action saw a retest of towards the $22.50 level following the breakout above $23.25. This current advance from $20.80 is also developing into a bearish wedge pattern. A breakdown below the “hammer” will confirm this pattern.
Indicator: Relative Strength 14
Current Relative Strength is rising sharply over the 70 levels however the current movement is lower towards the 50-level, RSI turning lower reflects the underlying momentum again decreasing but remains positive above the 50 levels. A continuing move above the 50 level and higher would be a very bullish signal in the short term.
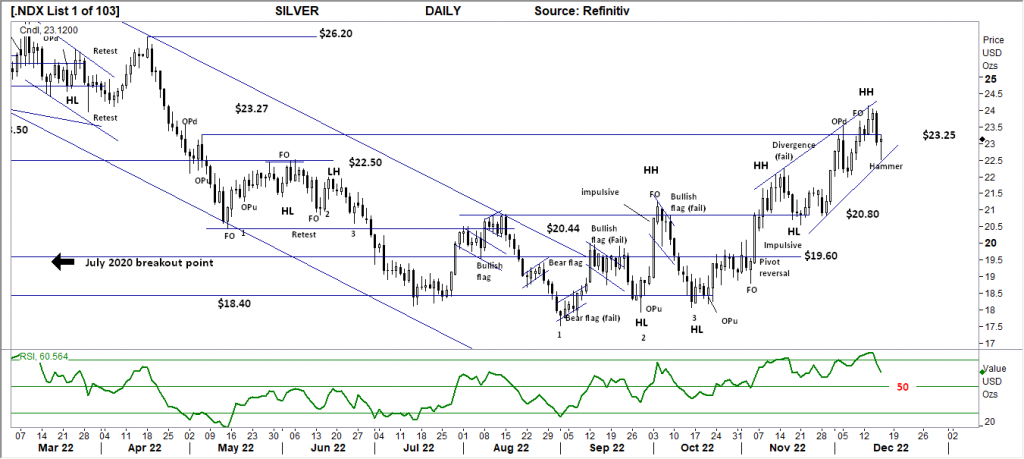
Comments from last week: The Daily chart of silver is setting up a bearish reversal pattern with last Friday’s Fake Out (FO) setting up the potential for a sharp reversal to retest the $22.50 level. Overall the Primary trend remains up, with an early-stage developing consolidation pattern confirmed with a daily close below the $23.25 level.
AUD GOLD DAILY
Price structure: Consolidation remains
Last week sees a very bullish move in the AUD Gold price towards the resistance level of $2712 but more importantly above the downtrend pattern line and the $2676 level. This is very bullish for local producers selling Gold in $AUD terms. NCM, NST, EVN.
Indicator Relative Strength 14
Relative Strength has turned higher in line with the price action following the rise from below the 50 levels. Overall, momentum has now turned higher. A continued movement above the 50 levels would be a strong positive for further price gains.
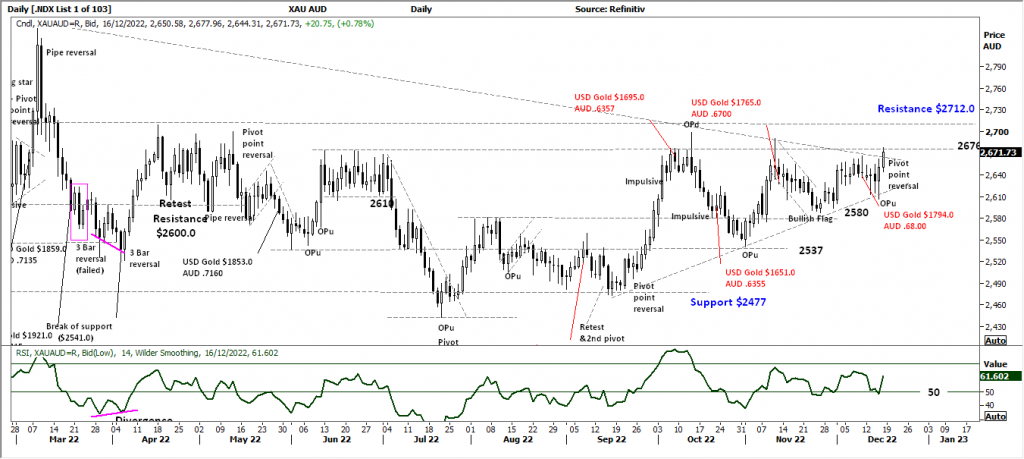
Comments from last week: With the Australian dollar, strength comes to a weaker gold price in AUD$ terms, the daily chart indicates the continuing pennant development with $2676 remaining as resistance and the $2580 level as support. These current levels remain positive for local producers and well ahead of the current $1100.0 average cost of production. The overall chart structure remains more bullish than bearish and should provide strong positive sentiment for local producers.
DAILY COPPER
Price structure: Potential breakout
Rejection again below the $4.00 level with a bearish OPd (Outside Period down close) leaves Copper within the consolidation area above $3.80 and below the $4.0 level. No bullish signal is being provided while the price remains below the $4.0 level.
Indicator: Relative Strength 14
The current reading has swung from below the 50-level to again turn lower as downward momentum has returned, however, the current reading could remain above the key 50 levels indicating positive momentum. The key now is for the RSI to swing back towards the 70 levels as a reflection of ongoing price gains and momentum.
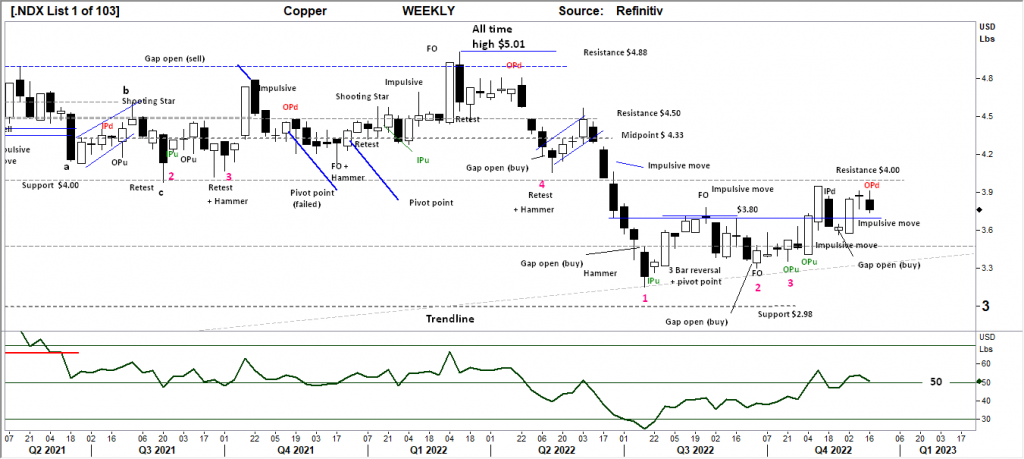
Comments from last week: The Hangman weekly bar for copper indicates again the market is in balance, but importantly above the $3.80 level and cautiously below the $4.0 level. A breakout over $4.0 would be very bullish for further gains. The key observation in this chart is the impulsive price movement bars showing bullish intent closing at the high of the range.
AUSTRALIAN VOLATILITY INDEX
Volatility reading moved lower last week and retraced and now continues to remain below the 13-level indicating forward pricing of PUT options is weaker. This is very good for equities during this week.
In general, lower consolidating commodities prices and equity prices or consolidation of equity prices is indicated as the reading remains above the 13 levels.
For continued support of equities, the XVI should move below the “13” level.
The cost of 3-month forward PUT options is decreasing from recent elevated levels.
The XVI is the difference between the 3-month forward pricing of ETO Options against the current month.
As markets anticipate events, the forward-priced option volatility changes, hence as forward price changes, this “skew” in pricing is measured in this XVI.
The XVI value works as an inverse observation of the underlying market.

USD DOLLAR INDEX
Price structure: Setting a lower low
The current price movements consolidating above the 104 level remain constructive for a bullish wedge pattern. Last Friday’s small breakout of the pattern has the potential to retest the 105.80 level in the short term.
Indicator: Relative Strength 14
The Relative Strength has turned higher in line with price movements indicating further gains as the current reading is now above the 30 level and displaying a bullish divergence signal. This will move higher to sideways should the price advance, with only a continued reading above 30 and then the 50 levels would indicate a change in price momentum.

Comments from last week: The US continues the downward trend with the retest of the 104 level complete. Current price action indicates a consolidation area is beginning to build below the 105.80 resistance and above the 104.0 support level, a breakout, either way, will give some short-term direction.
WTI – CRUDE OIL
Price structure: Primary downtrend. This commodity is highly news driven around supply-demand.
The price of the WTI contract has moved into balance with last week’s inside range. It should be observed price has returned to the historical consolidation area above the $60, level and below the $85 level set during 2021. The WTI contract remains in a primary downtrend. The US Government has stated it intends to refill the reserves, this news may well provide a price support level above $75.0.
Indicator: Relative Strength 14
The RSI turning below the 50 level is a result of upward momentum slowing, recent price reversal has resulted in a sharp movement below the key level of 50 signalling decreasing price momentum. The indicator moving below the 30 levels would now be monitored for a bullish divergence signal.

Comments from last week: Last week saw the breakdown below the important $75.20 level with a very strong directional range towards the $66.00 level and back into the Q3 and Q4 2021 consolidation area. The Primary trend for WTI is now down.


 Access +10,000 financial
instruments
Access +10,000 financial
instruments