
XJO WEEKLY Price structure:
The low range movement of the week again retested towards the Mid-Point support level of 6620 following the hangman reversal bar 2 weeks ago. A secondary movement above a key
Indicator: Relative strength 14:
Relative strength has again closed below the 50 level as part of the overall decline in relative strength. Price momentum turns negative on the lower side of 50. However, should Relative strength move and close above the key 50 level a sign of improving price momentum would prevail.

Comments from Last week: The “midpoint” support level at 6620 was tested during the week. The high close following a intra-week decline sets up another “hangman reversal” bar. The primary trend is down a further movement below the midpoint would give first warning of a move too or below 6400, this would further confirm that trend in place.
XJO DAILY Price structure:
Last Thursdays pivot point has not broken to the downside of the low at 6650 described in the prior week. The highlight of this type of consolidation is the short range down days when compared to the recent longer up day movements. A movement over the 6850 level will place the daily chart into an up trend.
Indicator: Relative strength 14:
The Relative strength Indicator (14) reflecting the underlying price momentum has moved higher to the 50-level indicating a change in momentum. Relative strength is moving in sync with the daily action of the market and does not offer any trading signal other than indicating momentum is currently shifting to the upside.
Indicator: VOLUME:
Friday low volume bar was developed on a shorter retracement bar. However again last Friday set one of the lowest volume bars for the week, indicating a lack of conviction for further buying.
Only volumes over 1Bil on a Daily basis would indicate strong new money buying.
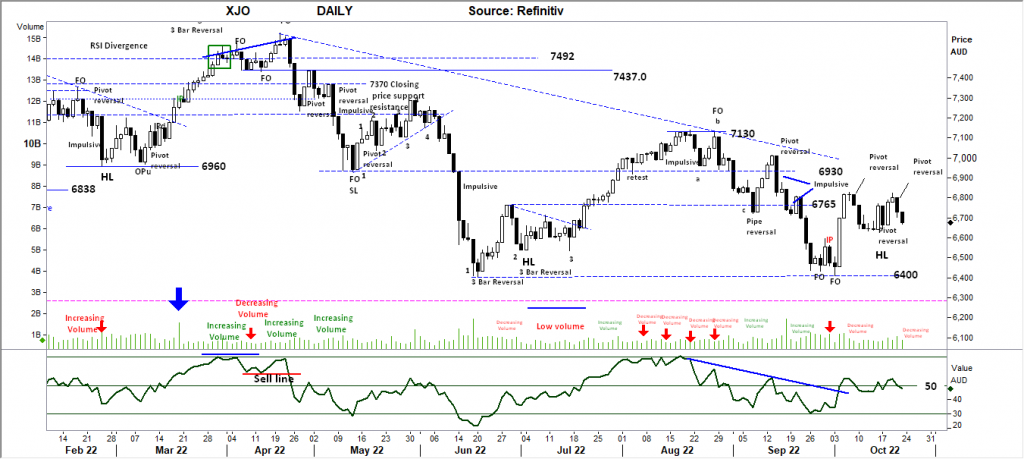
Comments from Last week: A closing price over 6772.0 this week would confirm the current pivot point in place as a new daily trend. Resistance at 6765 is now in play the first close should be over this level to give any hint of a continued bullish developing. The Daily trend remains in line with the Weekly trend- Down.
S&P 500 WEEKLY Price structure:With a Weekly pivot point in place and a close over the key level of 3715, a relief rally may follow. First significant resistance is shown at 4050. The Primary movement remains to the
downside, a resulting bear market rally may push higher from the current pivot point, a breakthrough the 4200 would put the market into a “corrective” movement (up).
Indicator: Relative strength Indicator 14.
The reading below the 50 level, last week the indicator turned higher, indicating a change in momentum, this week may ultimately continue the momentum move higher. A continuing movement towards and over the 50 level would be a very strong short term bullish signal. Positive momentum requires a reading above the key level of 50 to give a momentum buy signal.

Comments from Last week: Key support is developing around the 3600 level within the current Primary down trend. On a seasonal basis the last 2 weeks of October can be very bullish, a closing price over the 3715 level would confirm this statistic. Last weeks low has set a FO (fake out) against the end of September closing low.
S&P 500 DAILY Price structure: Developing bullish structure.
Last Friday indicated a strong outside range upward movement (OPu) following the small flag pattern. The Daily now displays a higher low point above the earlier Fake out low, this is
a very bullish setup.
Indicator: Relative strength 14:
Relative strength has turned higher but remaining below the 50 level, still a very strong indication of immediate improving momentum. A slight bullish divergence signal has shown, the current swing over the internal high point would provides the swing buy signal. Further price weakness for this index will see the RSI move lower.
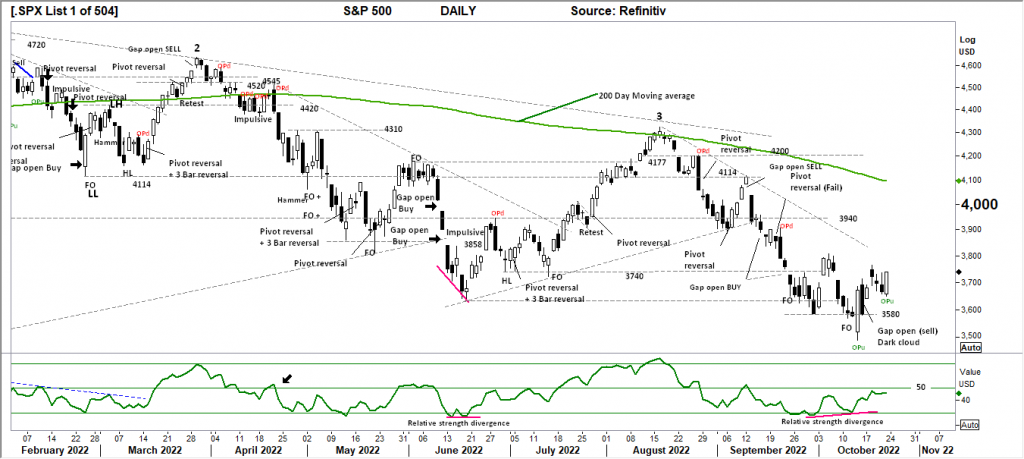
Comments from Last week Last Friday’s trading has set up a dark cloud cover, usually a bearish trading signal for further declines. With the final closing price confirming the current closing price support level of 3580 the next price movement will offer direction for the coming days. An immediate close below the 3580 level would bring further Stop Loss selling with a retest of the OPu low at 3491.0. Daily trend remains down.
NASDAQ DAILY Price structure: Base building
The Daily NDX provided a gap open buy signal last Friday and a clear close outside of the short down trendline. Following the earlier divergence signal the Index is setting a higher low point, follow through higher over 11,500 is required to complete a trending movement. The real observation is the base pattern over the past 4 weeks with last Friday showing the highest close in 2 weeks.
Indicator: Relative strength 14:
The Relative strength indicator moving back towards the 50 level a signal of improving momentum. With a strong divergence signal in the recent background a continuing move higher could be
expected.

Comments from Last week: As with the S&P, the Nasdaq has also set a dark cloud cover bar at the close of Friday following the OP range bar, usually a bullish reversal . The key level to hold this week is 10,440, the OP low. A reversal close above the 11,000 would setup the potential to fill the Gap showing in the 11,500-point area. Primary tend remains down.
USD Spot GOLD – DAILY: Is it a Bull market? No
History shows the OPu (Outside period up close) appearing at major swing points, USD Gold has again post an OPu, suggesting the only trade is to be long in the coming week. The low price set at the OPu is a higher low than the late September low. Lokk for a closing price above the $1676 level to confirm this momentum shift to the upside.
Indicator: Relative Strength 14:
Price momentum is again working higher as the OPu sets a strong range, the RSI moving below the 50 level and rising indicates a swing in momentum direction. (Price consolidation would naturally see the RSI drift back too around the 50 level. A strong movement either way will show the next directional move.)

Comments from Last week: The Bullish flag pattern observed last week is at the point of failure, a break of the low at $1613.60 would signal a continuation of the down trend and negate the potential for an inverse Head and Shoulder pattern reversal.
To get bullish on this metal a close over the key level of $1656 is the first requirement.
SILVER DAILY Price structure: Bull market? – No.
Last week saw a higher closing price following the OPu of 2 weeks ago and further confirmation of support along the $18.40 that began in July. Significant resistance remains between $20.0 and $20.40, however with the base build now outside of the downward channel, optimism for further upside is now in place. See RSI note.
Relative strength 14:
Current Relative strength is rolling sideways (again) with the movement remaining below the 50-level, RSI turning higher again would reflect the underlying momentum again turning positive.
A continuing move above the 50 level and higher would be very bullish signal in the short term. Price consolidation results in the relative strength turning towards the 50 level.
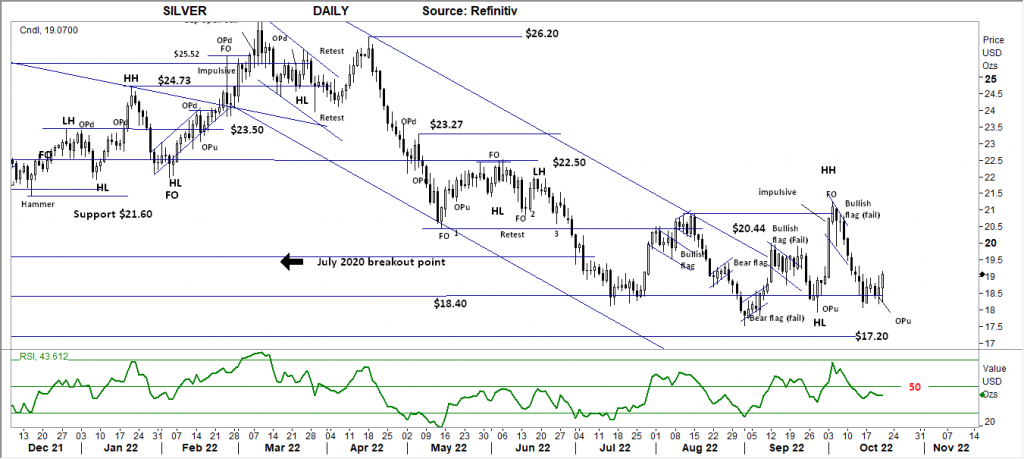
Comments from last week:
Last Friday Silver broke the last line of defence by closing below the $18.40 support level. The large range bar has the potential to follow through lower and again retest the $17.20 level as the Primary down trend reasserts itself. At this point it should be acknowledged Silver may be building a wider base pattern from the lows set during July 2022.
AUD GOLD DAILY Price structure: Breakout.
Last week saw support set at the old resistance level of $2580, to see a rally from this level US$ Gold needs to rally or the AUD$ is required to decline. The sideways channel continues.
Indicator Relative strength 14:
Relative strength has turned higher from above the 50 level to move above the 70 level and rolled over as consolidation takes place, this remains a positive for price momentum and remains a strong indication for further advances.
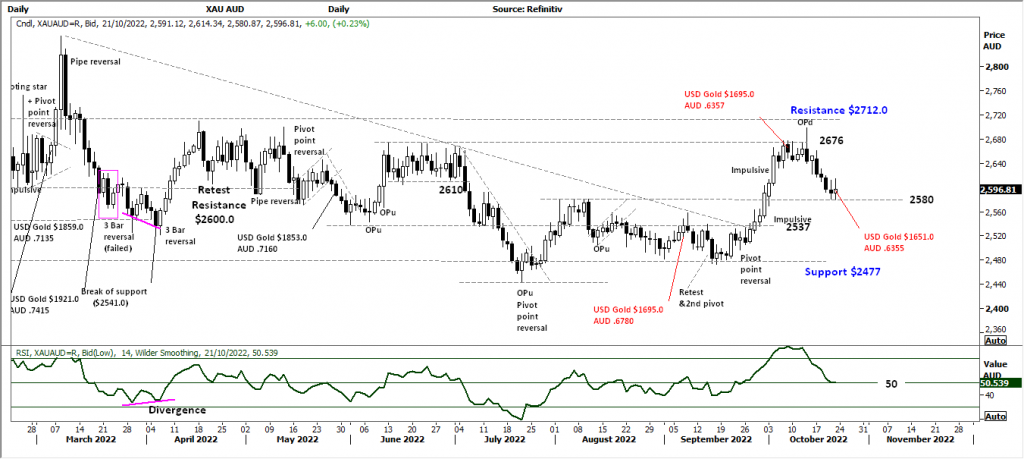
Comments from Last week: AUD Gold retesting towards the $2712 level with the OPd range bar has seen immediate rejection. Friday’s bar is bullish for the potential to again retest the highs. The overall observation is the AUD Gold price remains within a large trading range with $2712 as resistance and $2477 the support level. This will be a good outcome for Australian producers should the breakout continue over $2676 and further over resistance of $2712.
DAILY Price structure: Consolidation.
The highest close in 4 weeks. The sideways movement in Copper is continuing to develop into a secondary consolidation. The OPu set on Friday with e closing price above the $3.47 level is a good signal for further gains. The $3.80 level remains significant resistance.
Indicator: Relative strength 14:
Current reading has swung from below the 30-level to again turn sideways to higher as downward momentum has slowed, however the current reading remains below the key 50 level. The key now, is for the RSI to swung back above the 50 level as a reflection of ongoing price gains. A sharp cross of the 50 level is required to offer a strong buy signal.

Comments from Last week: Price consolidation below the $3.47 resistance level, adds to the view Copper may be building a support base above the current trendline with this week’s inside range bar. Copper has yet to confirm a “higher low” in place following the Gap open buy signal.
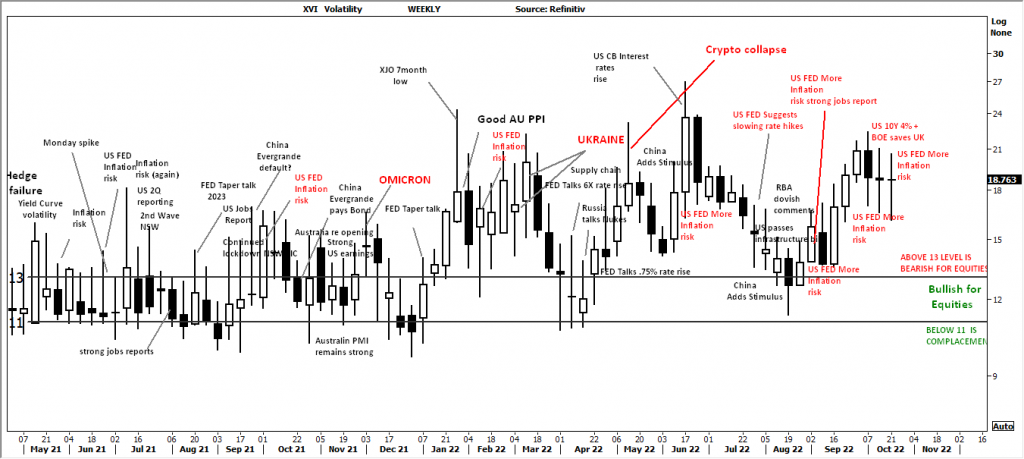
AUSTRALIAN VOLATILITY INDEX:
Volatility reading has moved slightly lower from last week but remains above the 13 level indicating forward pricing of PUT options remains strong. In general, lower equity prices or consolidation of equity prices is indicated as the reading remains above the 13 level.
For continued support of equities, the XVI should move below the “13” level.
The cost of 3month forward PUT options is decreasing from recent elevated levels.
The XVI is the difference between 3-month forward pricing of ETO Options against current month. As markets anticipate events, the forward priced option volatility changes, hence as forward price changes, this “skew” in pricing is measured in this XVI. The XVI value works as an inverse observation to the underlying market.
USD DOLLAR INDEX Price structure: Setting a lower high
The USD Index is setting a resistance level at 113.92 and retesting the up trendline. The now 3 rd OPd is again a bearish signal for further declines, a break below the 110.75 level would put the 109.47 level in play, a further close below this level will confirm a down trend in place.
Indicator: Relative strength 14:
The Relative strength has turned sideways in line with price movements indicating further consolidation as the current reading is below the 70 level. This will move lower to sideways should price decline, only a continued reading back above the 70 level would indicate continuing strong price momentum.
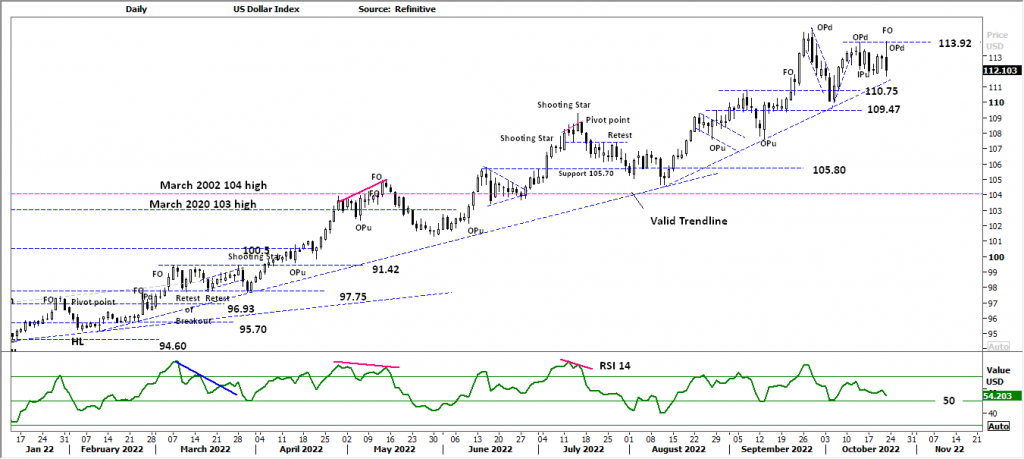
Comments from Last week: The OPd range bar sets a new resistance level of 113.92 as the first observation point for this week’s developments. The OP is often the marker of a turning point, a down trend can only be confirmed with a breakdown below the last higher low point circa 110.0 on observation would also be a break of the up-trend line and the first signal of real weakness.
WTI – CRUDE OIL, Price structure: Full Bull Market remains-just.
This commodity is highly news driven around supply -demand.
Rejection at $94.0 with support at $84.25, the WTI contract price continues to consolidate above $84.25. a strong close below the $84.25 would target the next key support level at $75.20 and signal a Primary down trend in place.
Indicator: Relative strength 14:
The RSI running below the 50 is a result of strong price declines as upward momentum slows, recent price reversal has resulted in a sharp movement over the key level of 50 signalling increasing positive price momentum. This current move lower is indicating the loss of positive momentum. (Consolidation)


 Access +10,000 financial
instruments
Access +10,000 financial
instruments