
Charts: Trading View
(Italics: Previous Analysis Due to Limited Price Change)
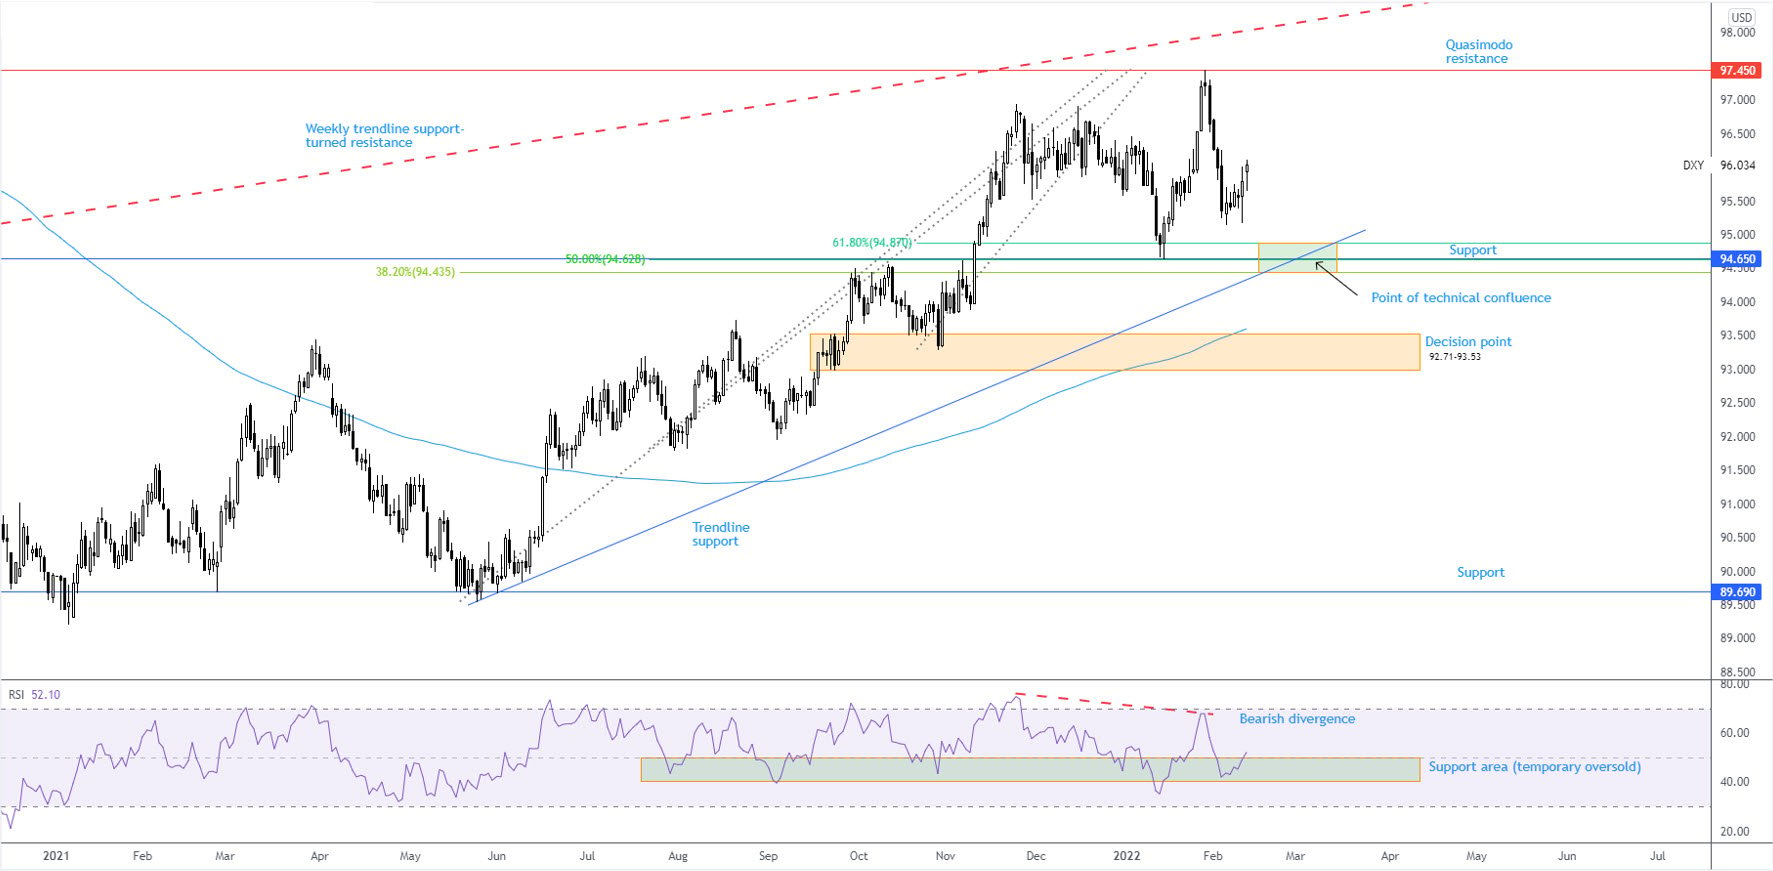
US Dollar Index (Daily Timeframe):
The US dollar, according to the US dollar index (USDX), managed to eke out a modest gain last week, adding 0.6 percent.
Technical structure to be mindful of is Quasimodo resistance at 97.45, located south of the weekly timeframe’s trendline support-turned resistance, taken from the low 78.90. To the downside, attention remains on support from 94.65 this week. The additional observation here, of course, is the gathering of Fibonacci retracement ratios (50.0% is not a Fibonacci level) between 94.44 and 94.87 (green), coupled with trendline support, extended from the low 89.54.
Trend studies reveal a well-defined upward trend since price made contact with support from 89.69 in May (2021), shaped through a series of higher highs and higher lows. The weekly timeframe, nonetheless, shows a long-term range since 2015, fluctuating between 103.82 and 88.25. Rupturing daily support at 94.44-94.87 will, by extension, engulf the 94.63 14th January low and signal an early trend reversal to the downside. Continuation selling, movement overthrowing noted supports, also re-opens the risk of a return to a decision point at 92.71-93.53, an area nearby the 200-day simple moving average at 93.60.
From the relative strength index (RSI), a popular gauge of momentum, the indicator dropped in on support between 40.00 and 50.00 in recent trading, following bearish divergence ahead of overbought territory heading into February. 40.00-50.00 has been centre stage since August 2021, a common view in upward trending markets. Consequently, 40.00-50.00 will likely remain on the watchlists for many traders this week.
Recognising upside strength since 2021, a dip-buying theme could emerge at support from 94.44-94.87 in light of technical confluence present in this area.
EUR/USD:
Against the US dollar, Europe’s single currency wrapped up the week 0.9 percent lower and trimmed a small portion of the prior week’s 2.7 percent advance.
According to trend, a decisive downside bias has been in play since topping at $1.2350 at the beginning of January (2021) on the weekly timeframe. This is reinforced by a trendline support breach, drawn from the low $1.0636, and the break of the $1.1602 November 2020 low (circled).
Fading the lower side of weekly resistance at $1.1473-1.1583 last week, therefore, should not surprise—an active S/R since late 2017. While a break higher may eventually direct the technical spotlight towards weekly supply at $1.1981-1.1848, navigating south is the more likely channel, given the trend. This could have the unit target as far south as weekly Quasimodo support from $1.0778.
A closer examination of price action on the daily timeframe shows early February breached trendline resistance, drawn from the high $1.2254. Although considered a bullish indication, the $1.1483 14th January peak (marked key watch) withstood two upside attempts of late and price remains under its 200-day simple moving average at $1.1661. Most technicians would require a breach of $1.1483 (in addition to the trendline resistance break) to help ‘confirm’ an early trend reversal. Defending $1.1483 has thrown support back in the mix at $1.1369-1.1309, which intersects closely with the recently breached trendline resistance (possible support if tested). A move beyond noted supports signals prime support at $1.1161-1.1199 could be targeted. Momentum studies on the daily chart, by way of the relative strength index (RSI), saw the indicator’s value round off ahead of resistance from 63.66 and test the 50.00 centreline last week. Running below here signals momentum to the downside is gaining traction.
Across the page on the H4 timeframe, last week run into the 61.8% Fibonacci retracement at $1.1475 (green)—provided a technical ceiling since mid-January and is plotted south of resistance at $1.1530. Subsequent movement witnessed Friday slip below support from $1.1386-1.1355, action perhaps clearing the technical runway to prime support at $1.1262-1.1304.
Lower on the curve, price action on the H1 timeframe tumbled beneath two Quasimodo support levels at $1.1346 and $1.1365, both of which now stand in as possible resistance. Support appears thin until $1.13, joined closely by prime support at $1.1264-1.1294, as well as a 100% Fibonacci projection from $1.1291 and a 50% retracement at $1.1308 (green line).
Medium term:
The reaction from weekly resistance at $1.1473-1.1583, in addition to the immediate trend facing lower, has drawn the currency pair into daily support at $1.1369-1.1309 and also placed price on the doorstep of daily trendline resistance-turned support. As underlined above, breaking below here highlights daily prime support at $1.1161-1.1199.
Short term:
Recognising weekly price rejecting resistance at $1.1473-1.1583 and H4 tunnelling through support at $1.1386-1.1355, this perhaps clears the rubble for the H1 to respect resistance at $1.1365-1.1346 this week and test H1 prime support at $1.1264-1.1294 (housed within H4 prime support at $1.1262-1.1304). The caveat, of course, is daily price testing support.

AUD/USD:
Despite ending the week off best levels, the Australian dollar squeezed out a second week in the green versus the US dollar, rising 0.8 percent.
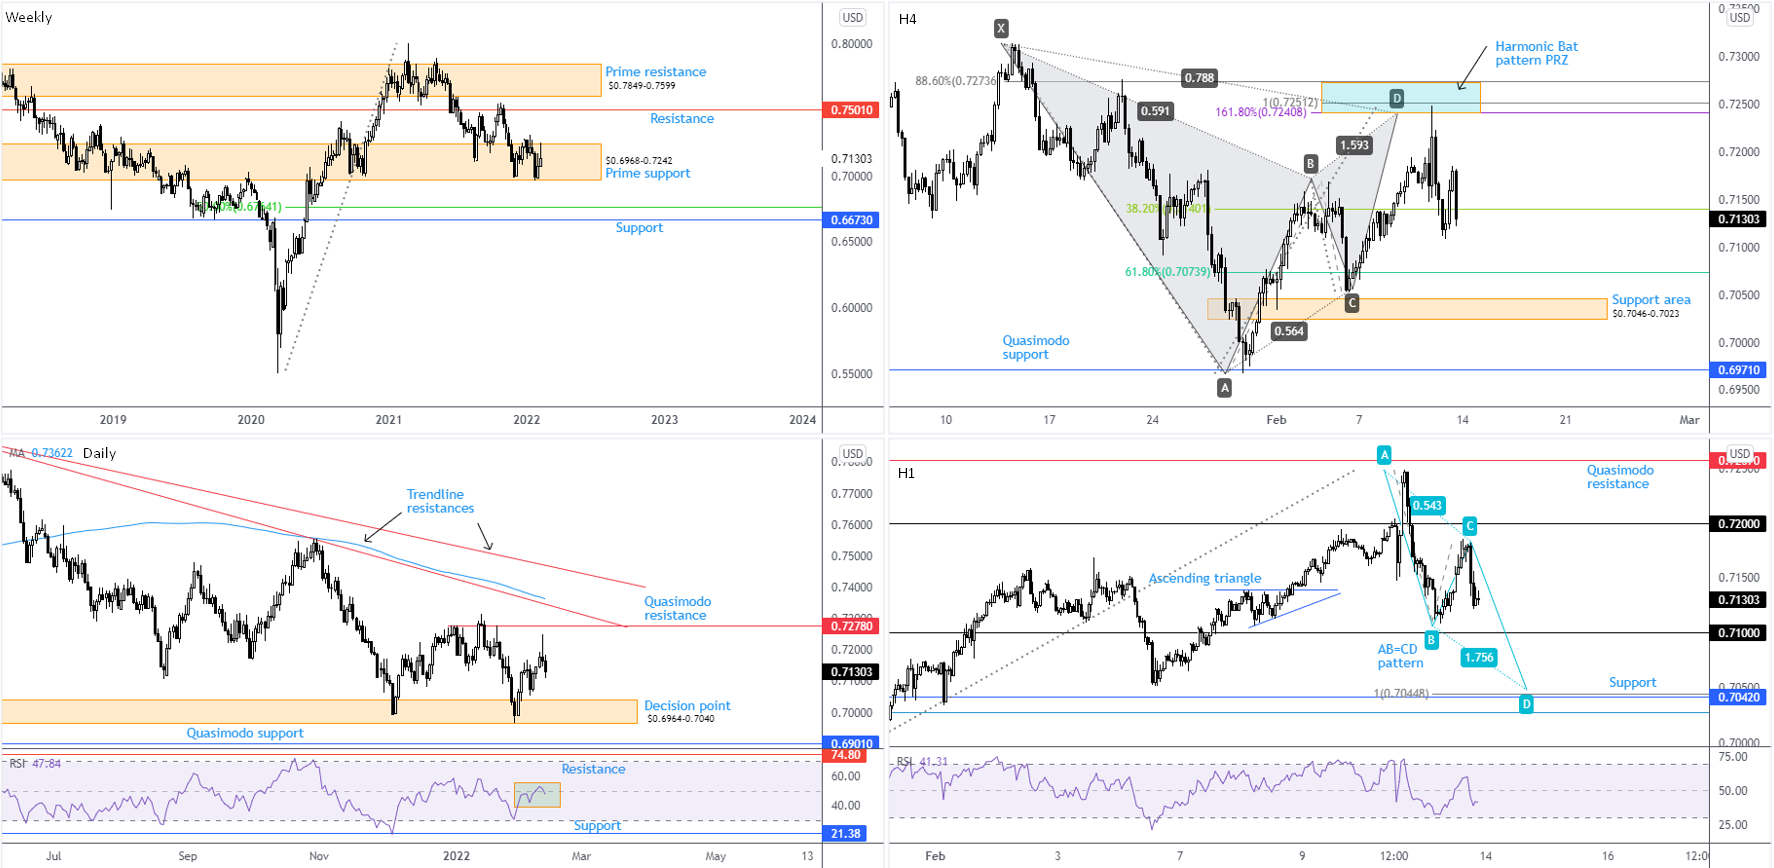
Longer term—the monthly timeframe—has portrayed a downtrend since August 2011, suggesting the 12.6 percent correction from mid-Feb tops at $0.8007 (2021) may be the start of a bearish phase, and not a correction to the 2021 advance from pandemic lows of $0.5506.
The somewhat beleaguered prime support at $0.6968-0.7242 remains front and centre on the weekly timeframe. Buyers finding grip within the noted zone over the coming weeks casts attention towards resistance at $0.7501, whereas sellers regaining consciousness seats support at $0.6673 and the 50% retracement at $0.6764 in the frame.
Out of the daily timeframe, price remains comfortable under its 200-day simple moving average, currently flirting with $0.7362. Structurally, Quasimodo resistance resides at $0.7278, shadowed closely by two trendline resistances, drawn from highs of $0.8007 and $0.7891. Downstream, a familiar decision point is nearby at $0.6964-0.7040, set above Quasimodo support from $0.6901. It may also interest some traders to note that the relative strength index (RSI) journeyed above the 50.00 centreline during last week. Assuming the value secures position above here, this highlights positive momentum (average gains exceeding average losses).
Working our way down to the H4 timeframe, Thursday shook hands with a harmonic Bat pattern’s PRZ between $0.7274 and $0.7241. The 38.2% Fibonacci retracement level at $0.7140 and the 61.8% Fibonacci retracement at $0.7074 (both derived from legs A-D) stand in as profit objectives from the harmonic formation. $0.7140, as you can see, welcomed price on Friday. The absence of strong buying opens the door to $0.7074 this week, followed by a support area from $0.7046-0.7023.
From the H1 chart, Friday established a top ahead of $0.72 during US hours and is poised to reconnect with $0.71. Interestingly, slicing under the latter unlocks support at $0.7042 which aligns with a 100% Fibonacci projection at $0.7045 (AB=CD structure), and a neighbouring 78.6% Fibonacci retracement at $0.7027 (blue line).
Medium term:
The trend in this market, coupled with subdued buying out of prime support from $0.6968-0.7242, suggests a bearish showing could form from daily Quasimodo resistance at $0.7278 if tested this week. Overall, downside targets are seen at the daily decision point at $0.6964-0.7040 and daily Quasimodo support from $0.6901.
Short term:
In line with higher timeframes, the H4 timeframe implies a test of the 61.8% Fibonacci retracement at $0.7074 and possibly H4 support from $0.7046-0.7023. What’s interesting is the $0.7042 H1 support dovetails with the noted H4 support zone, which also brings a H1 AB=CD formation to the table (100% Fibonacci projection at $0.7045).
Therefore, a break beneath $0.71 could be on the cards early week on the H1, targeting $0.7042ish.
USD/JPY:
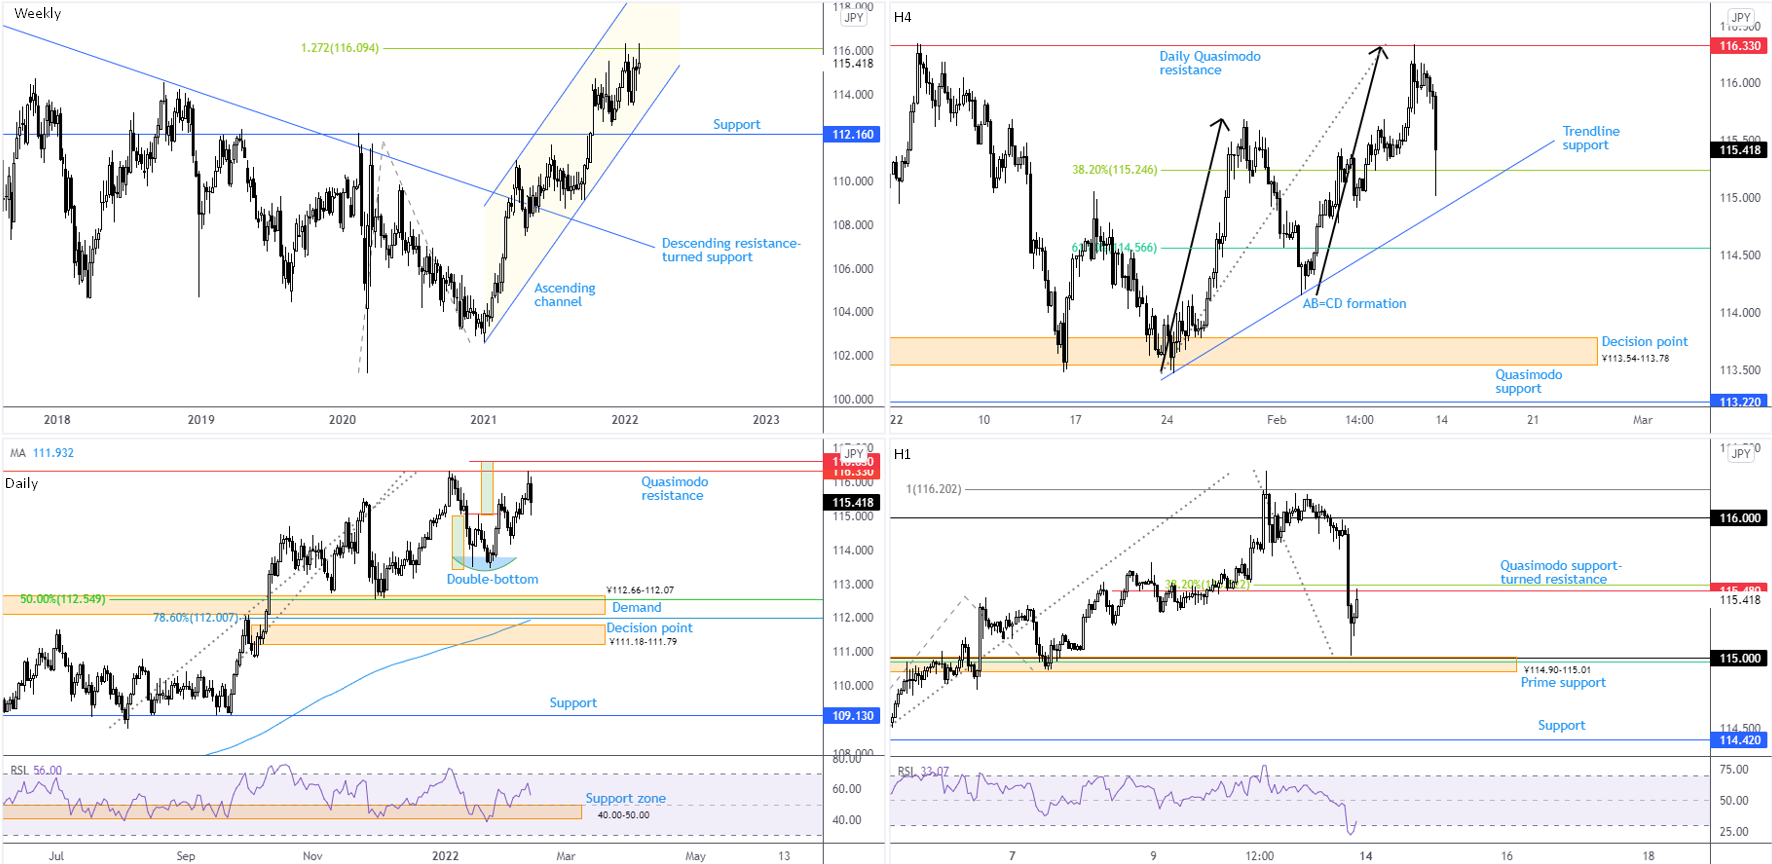
USD/JPY failed to gain acceptance around the 2022 high ¥116.35 and, much like AUD/USD, finished the week off best levels. Candlestick enthusiasts are likely to brand last week’s weekly candle a shooting star, communicating a bearish signal.
Regarding trend, the currency pair has been stepping higher since early 2021. In line with this, the overall longer-term trend has been climbing since 2012. The 21.5 percent correction from June 2015 to June 2016 provided a dip-buying opportunity, as did the subsequent 14.8 percent correction from December 2016 to pandemic lows formed early March 2020. A test of the weekly timeframe’s channel support, drawn from the low ¥102.59, therefore, is structure longer-term traders are likely monitoring.
The daily timeframe’s double-bottom pattern’s (¥113.48) profit objective came within reach of being tested last week at ¥116.63. As you can see, the second half of the week, topped at Quasimodo resistance from ¥116.33. Extending Friday’s 0.47% decline this week positions demand back in the frame at ¥112.66-112.07, an area not only in the company of a 78.6% Fibonacci retracement at ¥112.00 and a 50% retracement from ¥112.55, but also coordinating closely with weekly channel support underlined above. Note the relative strength index (RSI) recently recoiled from support between 40.00 and 50.00 (a ‘temporary’ oversold range since 10th May—common view in trending markets). This suggests positive momentum until overbought levels are tested.
A combination of daily Quasimodo resistance (¥116.33) and a H4 AB=CD bearish structure (black arrows) greeted price on Thursday and triggered aggressive selling on Friday to a 38.2% Fibonacci retracement at ¥115.25. Note that 38.2% and 61.8% Fibonacci retracements (derived from legs A-D) are often employed as AB=CD profit objectives. Consequently, price dropping in on the 61.8% Fibonacci retracement at ¥114.57 is an option this week, should trendline support cede ground, taken from the low ¥113.47.
Lower down on the H1 timeframe, following an earlier retest of ¥116, Friday spiked to within a pip of ¥115 and prime support at ¥114.90-115.01 (houses a 61.8% Fibonacci retracement at ¥114.98 [green line]) and settled at Quasimodo support-turned resistance from ¥115.48 (located under a 38.2% Fibonacci retracement at ¥115.52). Below prime support exposes support at ¥114.20. Friday’s abrupt selling also forced the H1 RSI to record oversold conditions.
Medium term:
The overall trend in this market favours buyers at the moment. Weekly channel support and daily demand from ¥112.66-112.07, therefore, deliver possible dip-buying structure to watch over the coming weeks.
Short term
H1 Quasimodo support-turned resistance from ¥115.48 and the nearby 38.2% Fibonacci retracement at ¥115.52 serve as immediate resistance early week. Overthrowing noted resistances signals short-term strength to the upside, with the expectation for an approach back to ¥116.
Additionally, prime support on the H1 at ¥114.90-115.01 is a key base to note should ¥115.48 hold, and given it aligns closely with H4 trendline support buyers could be drawn to this area this week.
GBP/USD:
Unable to realise direction around the prior week’s upper range ($1.3628), GBP/USD left behind a muted close last week (+0.15 percent).
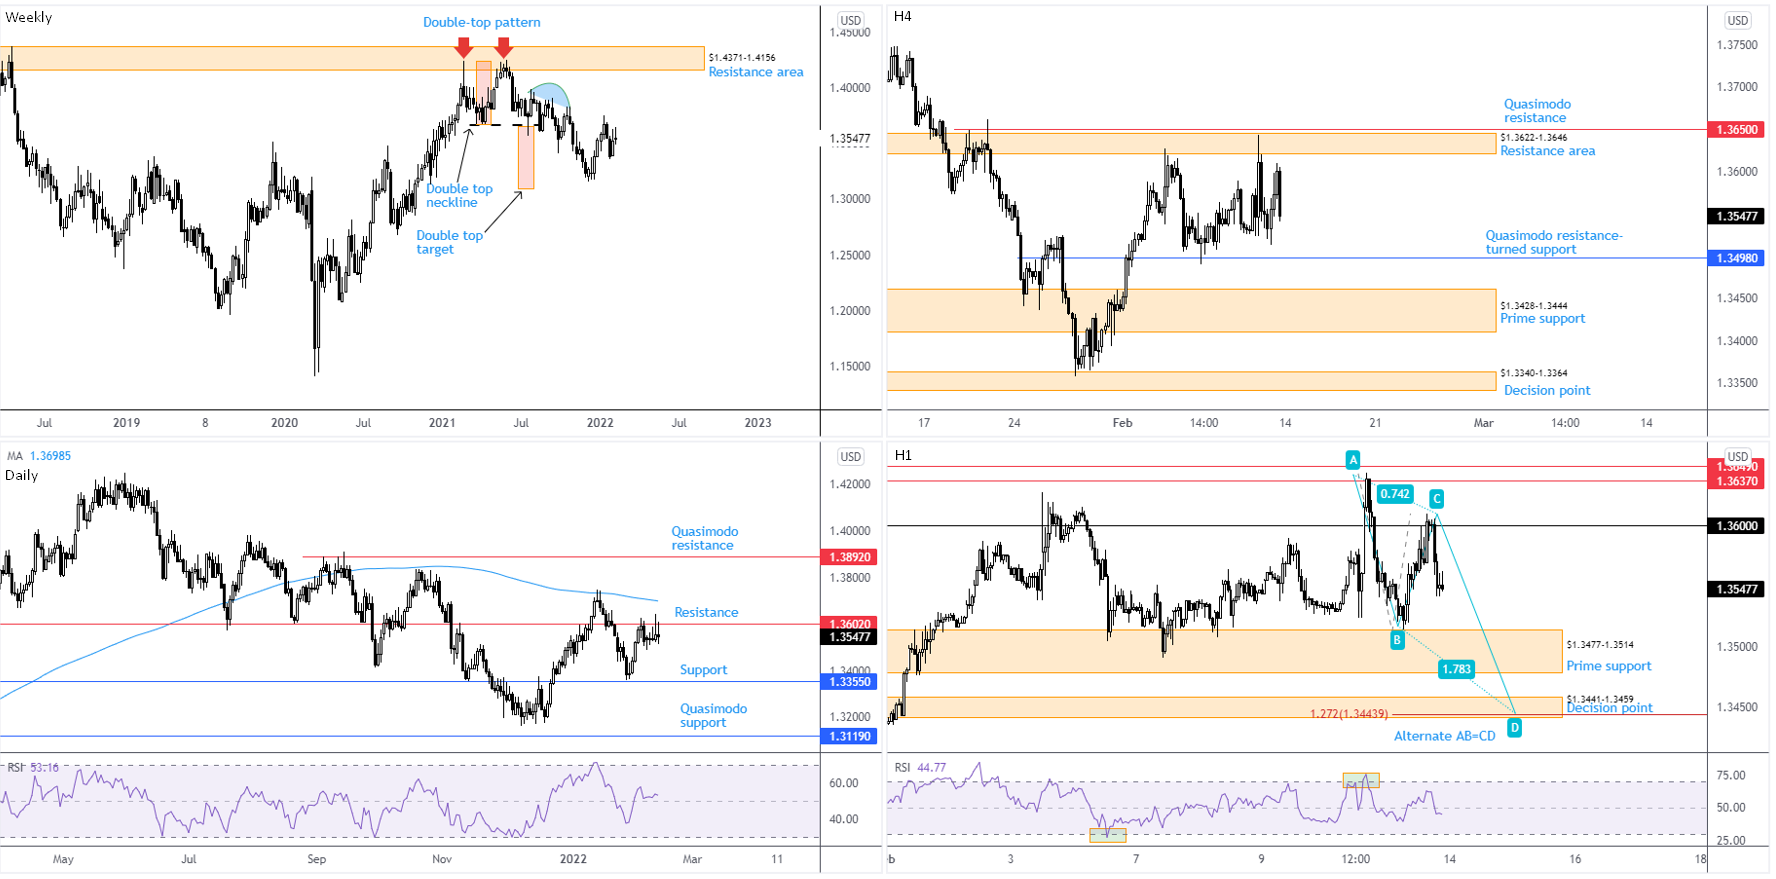
Trend direction in this market is interesting. Longer term (check monthly timeframe), we have been southbound since late 2007 tops at $2.1161. As a result, the move from pandemic lows in March 2020 may be a pullback within the larger downtrend. This places a question mark on the 7.5 percent ‘correction’ from February 2021 to December 2021; it may in fact be the beginning of a longer-term push to the downside and not a dip-buying scenario.
Nevertheless, technical structure visible on the weekly timeframe consists of resistance at $1.4371-1.4156 (potential compressed supply appears between $1.3983 and $1.3834 [blue arc]) and a double-top pattern’s ($1.4241) profit objective at $1.3090 (red boxes).
Daily resistance has taken the spotlight in recent days at $1.3602, organised under the 200-day simple moving average, circling $1.3699. Weakness from here shines light on support at $1.3355, with follow-through downside perhaps throwing Quasimodo support into the mix at $1.3119. Of note, the aforementioned support shares chart space with the weekly timeframe’s double-top pattern’s profit objective at $1.3090. In terms of momentum, the relative strength index (RSI) remains just above its 50.00 centreline, informing traders average gains are exceeding average losses at the moment: positive momentum.
Attention on the H4 timeframe is largely focussed on resistance at $1.3622-1.3646—set under Quasimodo resistance at $1.3650—and Quasimodo resistance-turned support at $1.3498. Of particular importance is also prime support located at $1.3428-1.3444. This is a fresh zone that’s in good shape, placed to take advantage of ‘sell-stop momentum’ beneath $1.3498.
From the H1 timeframe, Friday retested the underside of $1.36 and unshackled the possibility of bringing in prime support at $1.3477-1.3514 (surrounds H4 Quasimodo support-turned resistance at $1.3498). However, as this prime zone has been tested, it could be fragile. Consequently, this throws the decision point at $1.3441-1.3459 in the mix, along with an ‘alternate’ AB=CD formation at $1.3444 (a 1.272% Fibonacci projection). What’s technically interesting is the H1 decision point shares space with the H4 prime support mentioned above at $1.3428-1.3444.
Medium term:
Daily resistance remaining active at $1.3602 indicates a bearish setting this week. Still, traders are urged to note the 200-day simple moving average at $1.3699 in the event buyers make a push.
Overall, though, daily support at $1.3355 calls for attention to the downside.
Short term
Chart studies imply a continuation lower until reaching H4 prime support at $1.3428-1.3444 and the H1 decision point at $1.3441-1.3459. This is due to daily resistance maintaining position at $1.3602 and H4 Quasimodo resistance-turned support at $1.3498 (and H1 prime support at $1.3477-1.3514) already being tested.
DISCLAIMER:
The information contained in this material is intended for general advice only. It does not take into account your investment objectives, financial situation or particular needs. FP Markets has made every effort to ensure the accuracy of the information as at the date of publication. FP Markets does not give any warranty or representation as to the material. Examples included in this material are for illustrative purposes only. To the extent permitted by law, FP Markets and its employees shall not be liable for any loss or damage arising in any way (including by way of negligence) from or in connection with any information provided in or omitted from this material. Features of the FP Markets products including applicable fees and charges are outlined in the Product Disclosure Statements available from FP Markets website, www.fpmarkets.com and should be considered before deciding to deal in those products. Derivatives can be risky; losses can exceed your initial payment. FP Markets recommends that you seek independent advice. First Prudential Markets Pty Ltd trading as FP Markets ABN 16 112 600 281, Australian Financial Services License Number 286354.


 Access +10,000 financial
instruments
Access +10,000 financial
instruments