Your weekly outlook of technical patterns and structure.
The Research Team scans the financial markets for you, highlighting clear and actionable technical structures.
Forex: Long-Term Bearish Pennant Pattern Nearing Breaking Point on AUD/USD
Monthly Timeframe –
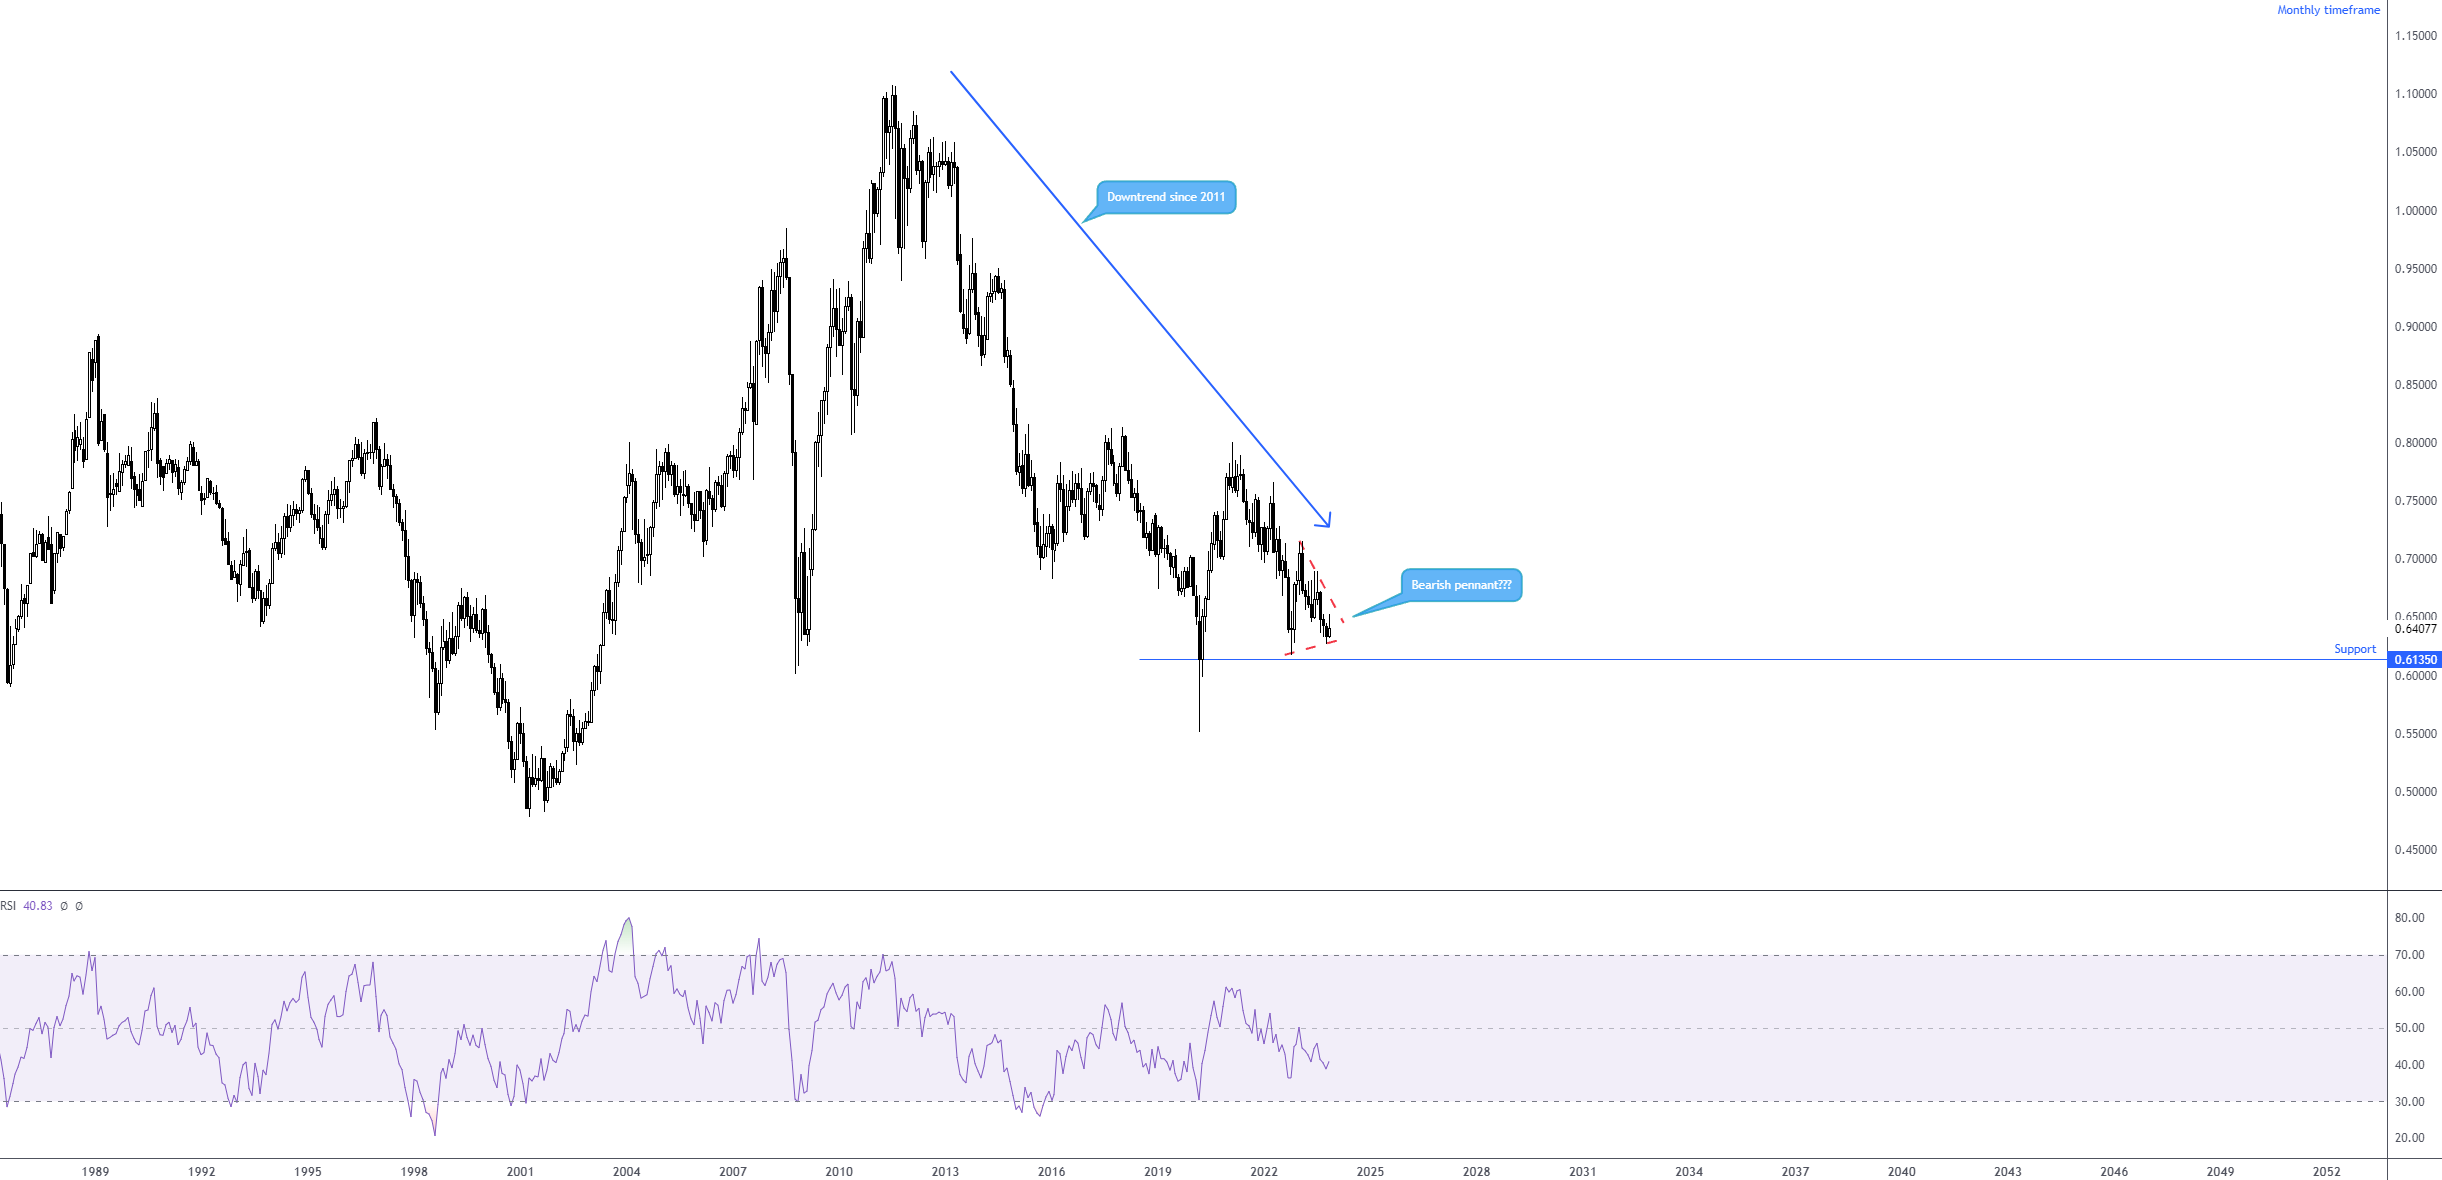
Albeit more of a longer-term structure, price action on the monthly timeframe of AUD/USD has been busy carving out a potential bearish pennant pattern since September 2022 between $0.6169 and $0.7142. Having seen this market exhibit a downtrend since 2011, a breakout beyond the pattern’s technical structure unearths the possibility of further underperformance and exposes monthly support at $0.6135.
 Commodities: ‘Alternate’ AB=CD Formation for XAU/USD, Anyone?
Daily Timeframe –
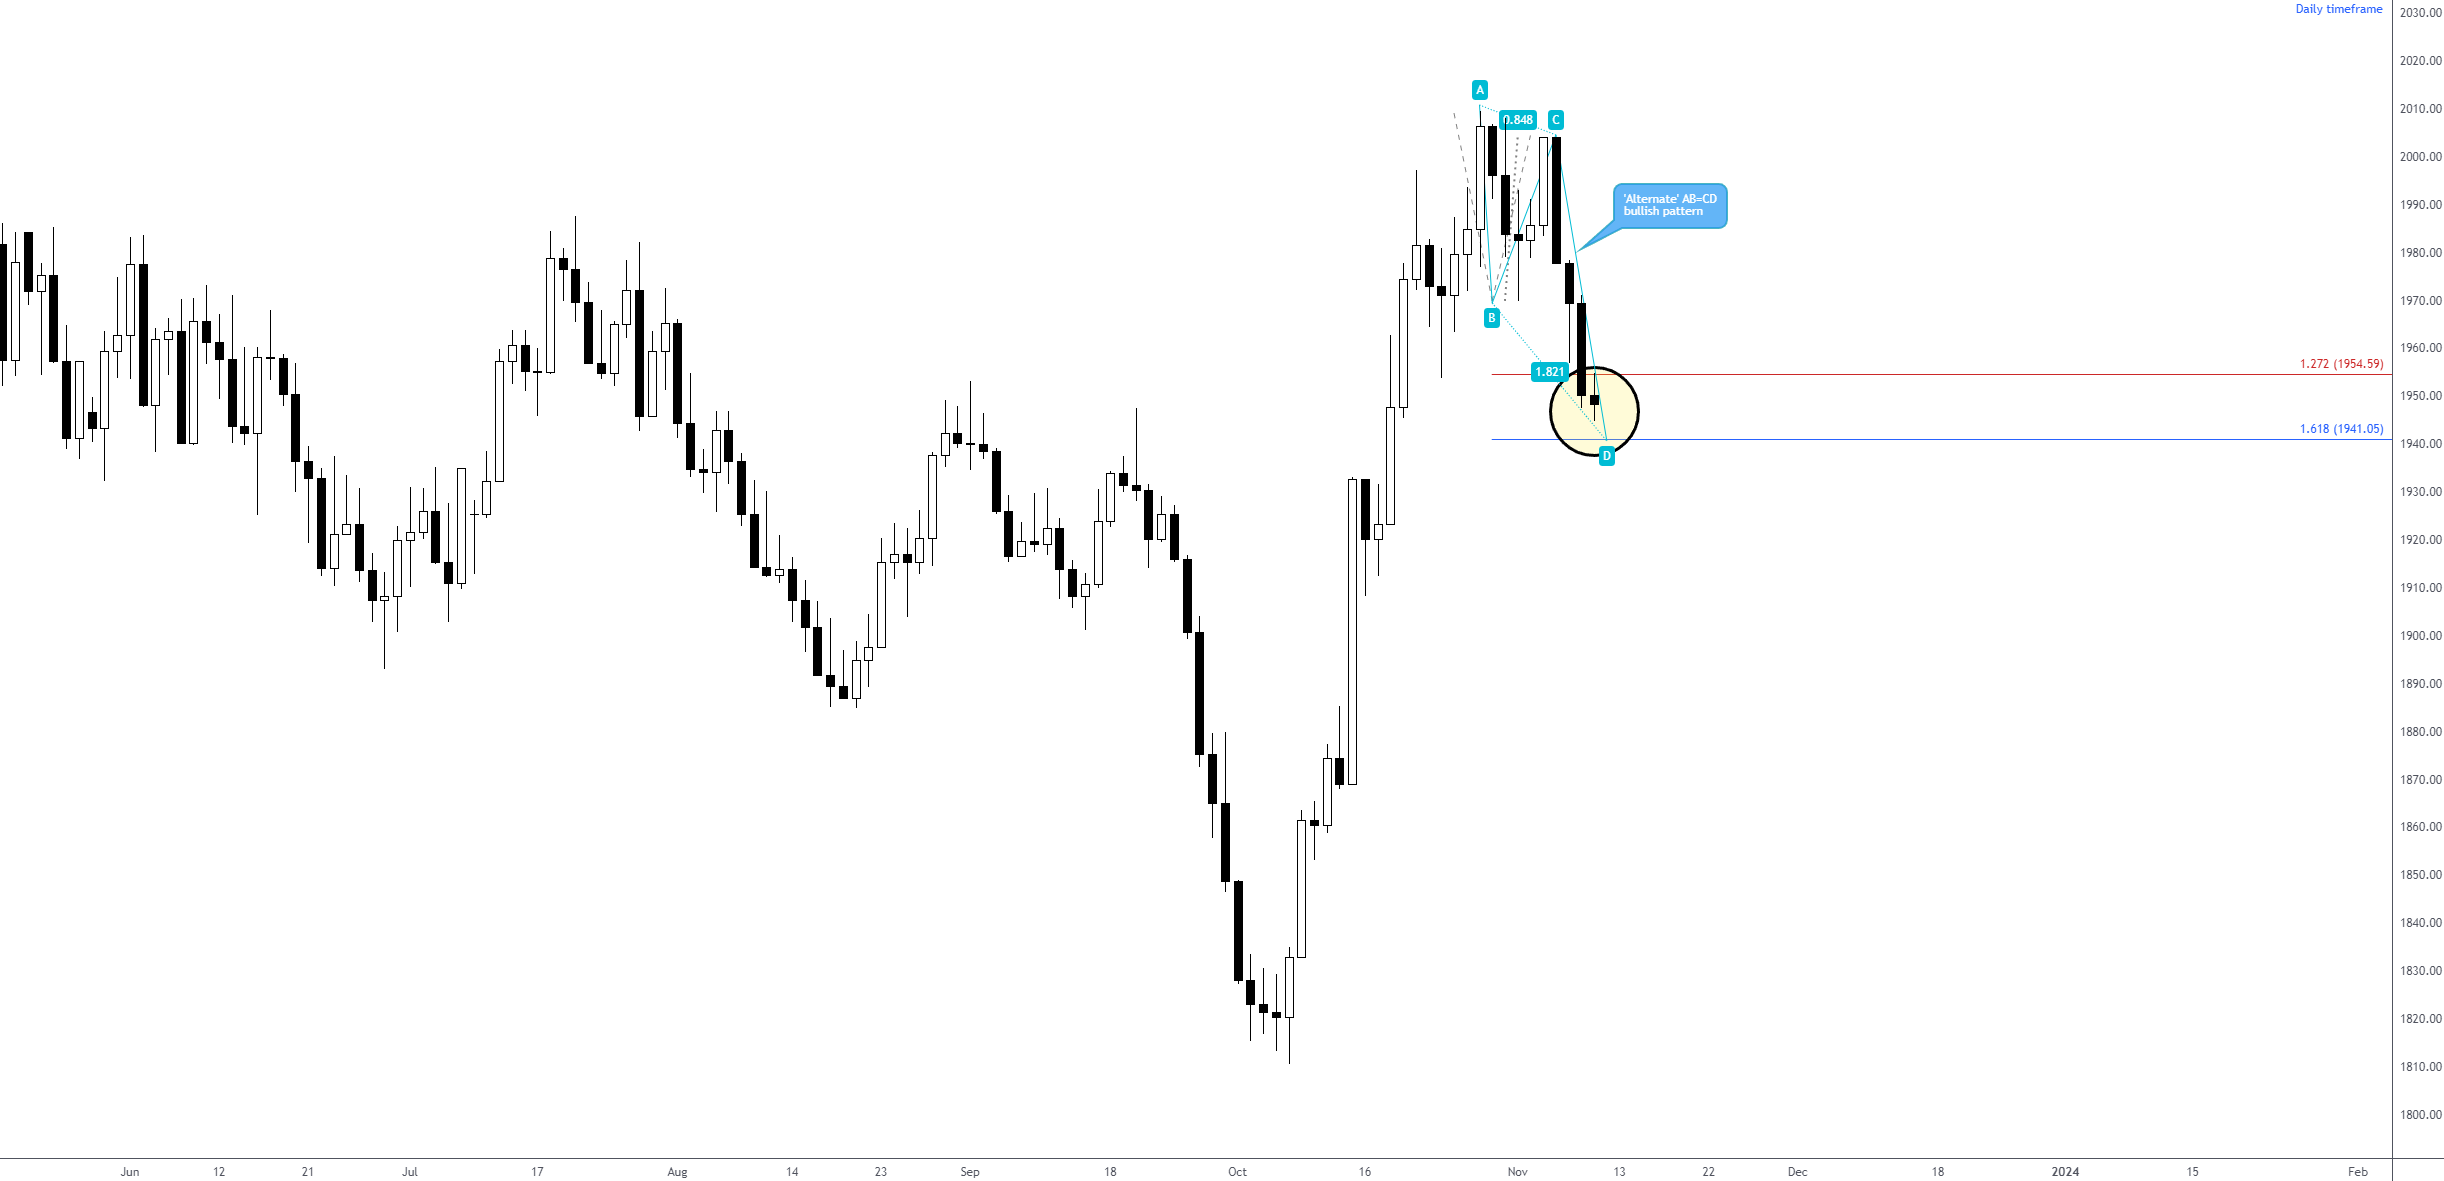
From the daily timeframe of spot gold in $ terms (XAU/USD), you will note that the precious metal has formed what is referred to as an ‘alternate’ AB=CD bullish pattern. This delivers a support area between the 1.618% and 1.272% Fibonacci projection ratios at (in this case) $1,941 and $1,954, respectively.
Should a rebound unfold from the aforementioned support area, traders/investors tend to organise their take-profit objectives using the 38.2% and 61.8% Fibonacci retracement ratios derived from legs A and D.
 Equities: Breakout Buyers in Control on the S&P 500?
Daily Timeframe –
Having noted room to continue navigating higher terrain on the monthly and weekly timeframes (weekly resistance is not expected until 4,595), price action on the daily timeframe helped reaffirm this bullish presence by rupturing resistance at 4,363 and clearing the way north to at least October tops at 4,393 and perhaps resistance coming in at 4,473.
 Cryptocurrency: BTC/USD Nearing Resistance
Weekly Timeframe –
From the weekly timeframe of BTC/USD, bulls are firmly in the driving seat for the time being. After clearing offers around resistance at $35,060, a level which could now offer support, the major cryptocurrency is seen fast approaching resistance at $38,523. You will also note that this level is accompanied by a channel resistance taken from the high of $31,050, and the Relative Strength Index (RSI) recently entered overbought space (≥ 70.00).
As a result, further buying is possible in the short term, though technical headwinds are close by and may inspire profit-taking and fresh short positions.
DISCLAIMER: The information contained in this material is intended for general advice only. It does not consider your investment objectives, financial situation or particular needs. FP Markets has made every effort to ensure the accuracy of the information as at the date of publication. FP Markets does not give any warranty or representation as to the material. Examples included in this material are for illustrative purposes only. To the extent permitted by law, FP Markets and its employees shall not be liable for any loss or damage arising in any way (including by way of negligence) from or in connection with any information provided in or omitted from this material. Features of the FP Markets products including applicable fees and charges are outlined in the Product Disclosure Statements available from FP Markets website, www.fpmarkets.com and should be considered before deciding to deal in those products. Derivatives can be risky; losses can exceed your initial payment. FP Markets recommends that you seek independent advice. First Prudential Markets Pty Ltd trading as FP Markets ABN 16 112 600 281, Australian Financial Services License Number 286354.


 Access +10,000 financial
instruments

