
Your weekly outlook of technical patterns and structure.
The Research Team scans the financial markets for you, highlighting clear and actionable technical structures.
Forex: AUD/USD Testing Lower Perimeter of Descending Triangle
Daily Timeframe –
The daily chart of AUD/USD is seen testing the grit of the lower boundary of a descending triangle at $0.6364 after manoeuvring beneath support at $0.6401 (now marked resistance). Should the lower limit of the triangle give way, given that this formation is often viewed as a continuation pattern, this could encourage breakout selling towards support at $0.6126.
Also worth noting is that the AUD/USD currency pair has been trending lower since pencilling in a top at $0.7158 at the beginning of February.
 Commodities: WTI Oil Eyeing $100?
Daily Timeframe –
The price of WTI oil continues to navigate higher and recently ventured north of resistance at $93.62. With this level poised to potentially deliver support, further outperformance could be seen in this market, targeting resistance at $98.28, closely shadowed by the $100 psychological level.
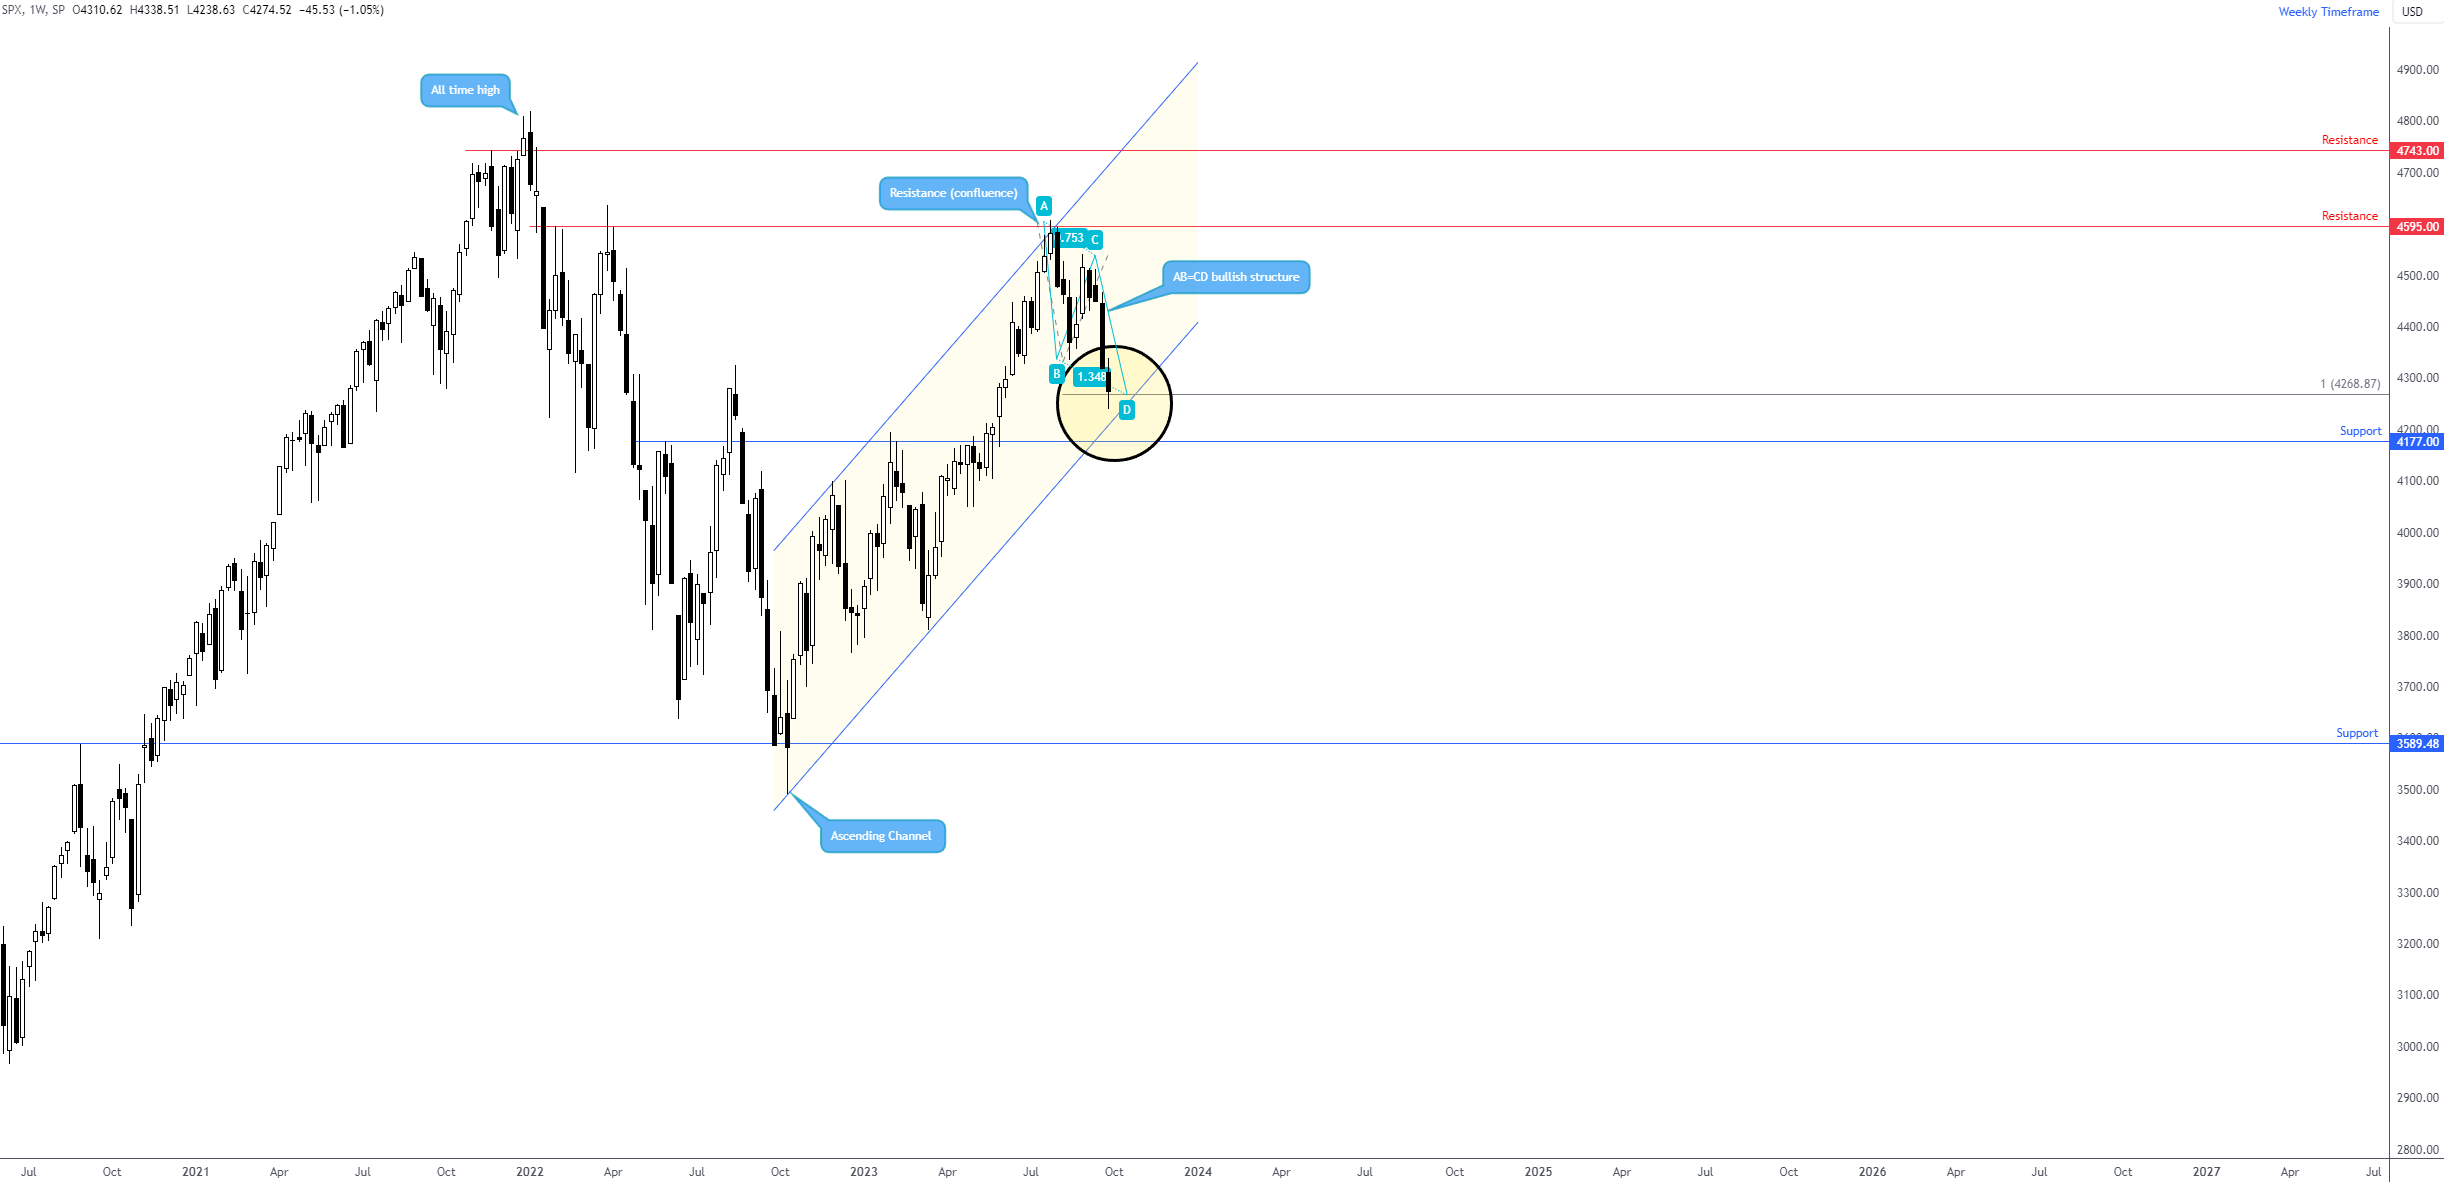
 Equities: AB=CD and Channel Support Combination for the S&P 500
Weekly Timeframe –
This week has landed the S&P 500 on the doorstep of an AB=CD bullish pattern at 4,268 (represented by a 100% projection ratio), complemented by channel support from the low of 3,491. Should buyers step in at this point, it is common to see traders/investors set take-profit targets based on the 38.2% and 61.8% Fibonacci retracement ratios derived from legs A-D.
 Cryptocurrency: ETH/USD Descending Triangle, Anyone?
Daily Timeframe –
Price action on the daily chart of ETH/USD is seen forming a descending triangle pattern, made up between $1,542 and $1,744. In the event price action holds the retest of the descending line, aided by the Relative Strength Index (RSI) nearing the lower side of its 50.00 centreline, this could spark a sell-off in ETH/USD and eventually see a breakout lower of the descending triangle. Given these are generally viewed as continuation patterns, this could further prompt selling.
 Charts: Trading View
DISCLAIMER: The information contained in this material is intended for general advice only. It does not consider your investment objectives, financial situation or particular needs. FP Markets has made every effort to ensure the accuracy of the information as at the date of publication. FP Markets does not give any warranty or representation as to the material. Examples included in this material are for illustrative purposes only. To the extent permitted by law, FP Markets and its employees shall not be liable for any loss or damage arising in any way (including by way of negligence) from or in connection with any information provided in or omitted from this material. Features of the FP Markets products including applicable fees and charges are outlined in the Product Disclosure Statements available from FP Markets website, www.fpmarkets.com and should be considered before deciding to deal in those products. Derivatives can be risky; losses can exceed your initial payment. FP Markets recommends that you seek independent advice. First Prudential Markets Pty Ltd trading as FP Markets ABN 16 112 600 281, Australian Financial Services License Number 286354.


 Access +10,000 financial
instruments
Access +10,000 financial
instruments