
Your weekly review of technical patterns and structure.
The research team scans the financial markets for you, highlighting clear and actionable technical structures.
Forex: GBP/USD to Whipsaw North of $1.25?
H4 Timeframe –
Short-term price action on the GBP/USD currency pair is testing the underside of the $1.25 handle. Directly above, however, resistance resides at $1.2538. With buy-stops likely located above $1.25 (set by breakout buyers and protective stop-loss orders from those short $1.25), a whipsaw beyond the round number into $1.2538 resistance could be seen, a move that may encourage short-term selling.
 Commodities: WTI Oil Downside Continuation?
Daily Timeframe –
The daily timeframe of WTI ended nearly 4.0% lower yesterday, consequently filling the upside gap that unfolded in early April and shaking hands with a decision point at $72.63-$74.36.
This market has been in a downtrend since late 2022, and a break of the aforementioned decision point could mean a test of the $64.35 March low and a possible continuation lower.
 Equities: Dow Testing Support
Daily Timeframe –
The Dow Jones Industrial Average concluded Wednesday testing support at 33,263, which happens to be closely accompanied by a 38.2% Fibonacci retracement ratio at 33,071 and a 50-day simple moving average at 33,070. Although this area provides a potential floor to work with today/tomorrow, do bear in mind that a spike to pull in support at 32,901 could also be seen before buyers attempt to push higher.
 Cryptocurrency: XRP/USD Challenging AB=CD Structure
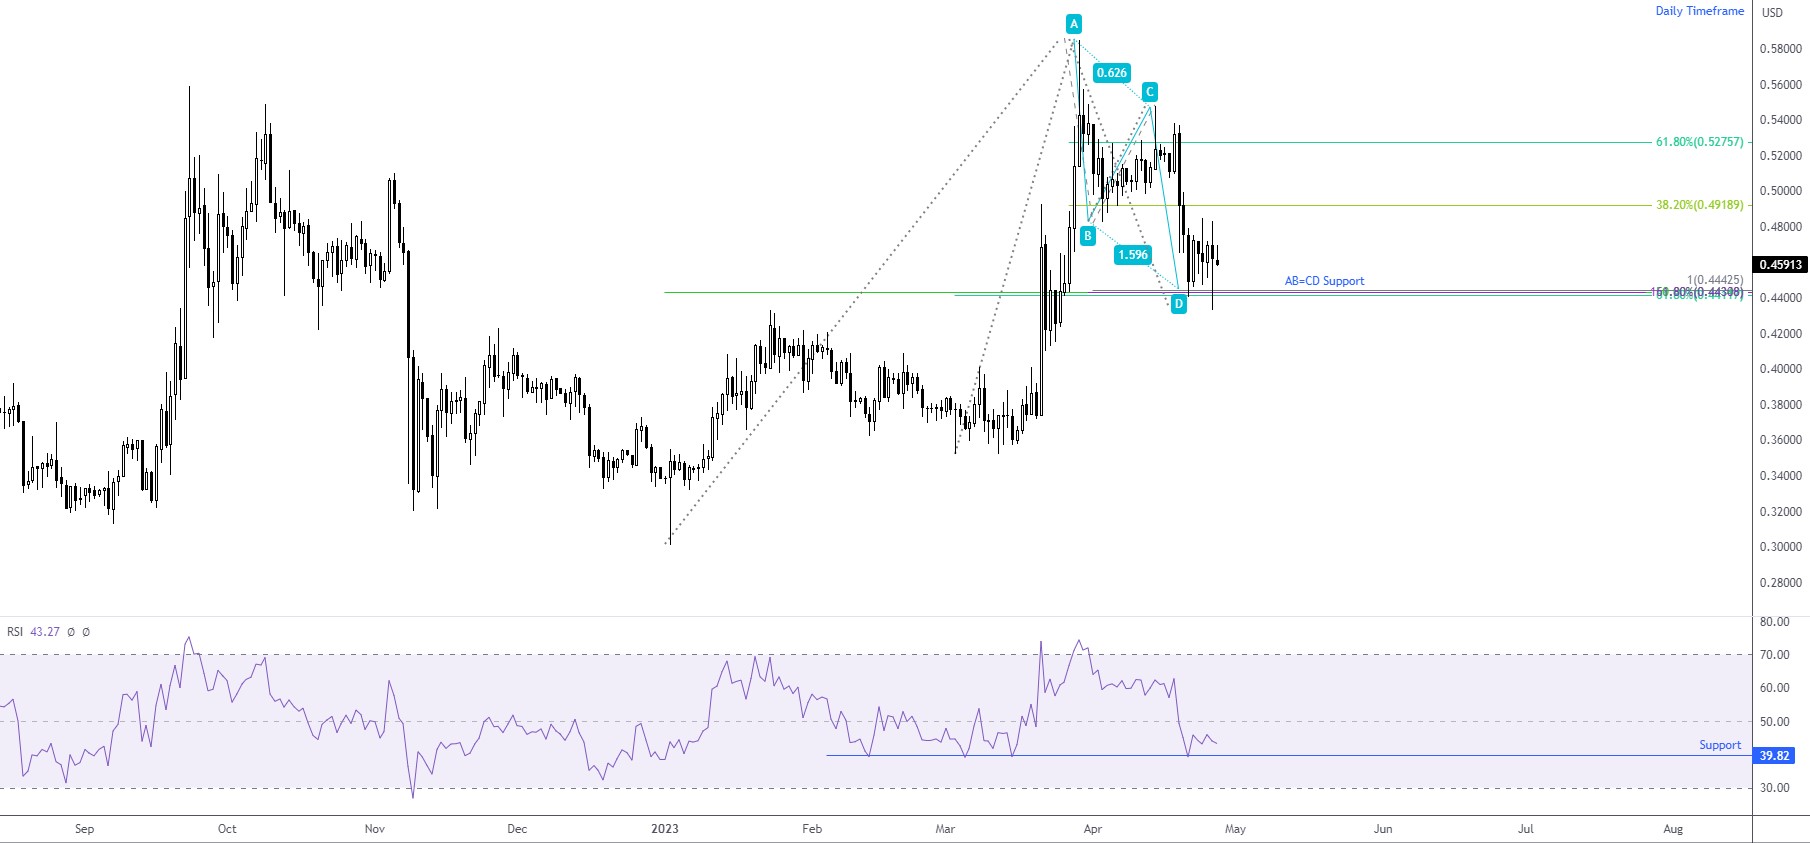
Daily Timeframe –
As evident from the daily timeframe of XRP/USD, price action recently crossed swords with AB=CD support around $0.44425, an area complemented by several additional Fibonacci ratios (commonly referred to as a Fibonacci Cluster) and indicator support taken from the Relative Strength Index (RSI) at 39.82.
Common upside targets can be found from the 38.2% and 61.8% Fibonacci retracement ratios at $0.49189 and $0.52757, respectively, derived from legs A-D.
 Charts: TradingView
DISCLAIMER: The information contained in this material is intended for general advice only. It does not consider your investment objectives, financial situation or particular needs. FP Markets has made every effort to ensure the accuracy of the information as at the date of publication. FP Markets does not give any warranty or representation as to the material. Examples included in this material are for illustrative purposes only. To the extent permitted by law, FP Markets and its employees shall not be liable for any loss or damage arising in any way (including by way of negligence) from or in connection with any information provided in or omitted from this material. Features of the FP Markets products including applicable fees and charges are outlined in the Product Disclosure Statements available from FP Markets website, www.fpmarkets.com and should be considered before deciding to deal in those products. Derivatives can be risky; losses can exceed your initial payment. FP Markets recommends that you seek independent advice. First Prudential Markets Pty Ltd trading as FP Markets ABN 16 112 600 281, Australian Financial Services License Number 286354.


 Access +10,000 financial
instruments
Access +10,000 financial
instruments