
Your weekly outlook of technical patterns and structure.
The Research Team scans the financial markets for you, highlighting clear and actionable technical structures.
Forex: Dollar Index Rangebound Between Key Levels
Daily Timeframe –
From the daily timeframe of the US Dollar index (a geometric-average weighted value of the USD against six major currencies), buyers and sellers are battling for position between not only support and resistance at 102.92 and 103.62, respectively, but also the 50-day Simple Moving Average (SMA) at 102.83 and the 200-day SMA at 103.49.
Although price action recently chalked up a fresh higher high following a higher low (indicating an early uptrend), we have also seen a Death Cross form (50-day SMA crossing beneath the 200-day SMA to signal a potential longer-term downtrend). In light of the Relative Strength Index (RSI) offering up hidden negative divergence, a breakout lower could be on the table, a move perhaps opening the door to support between 101.44 and 101.77.
 Commodities: WTI Oil Approaching AB=CD Resistance
Daily Timeframe –
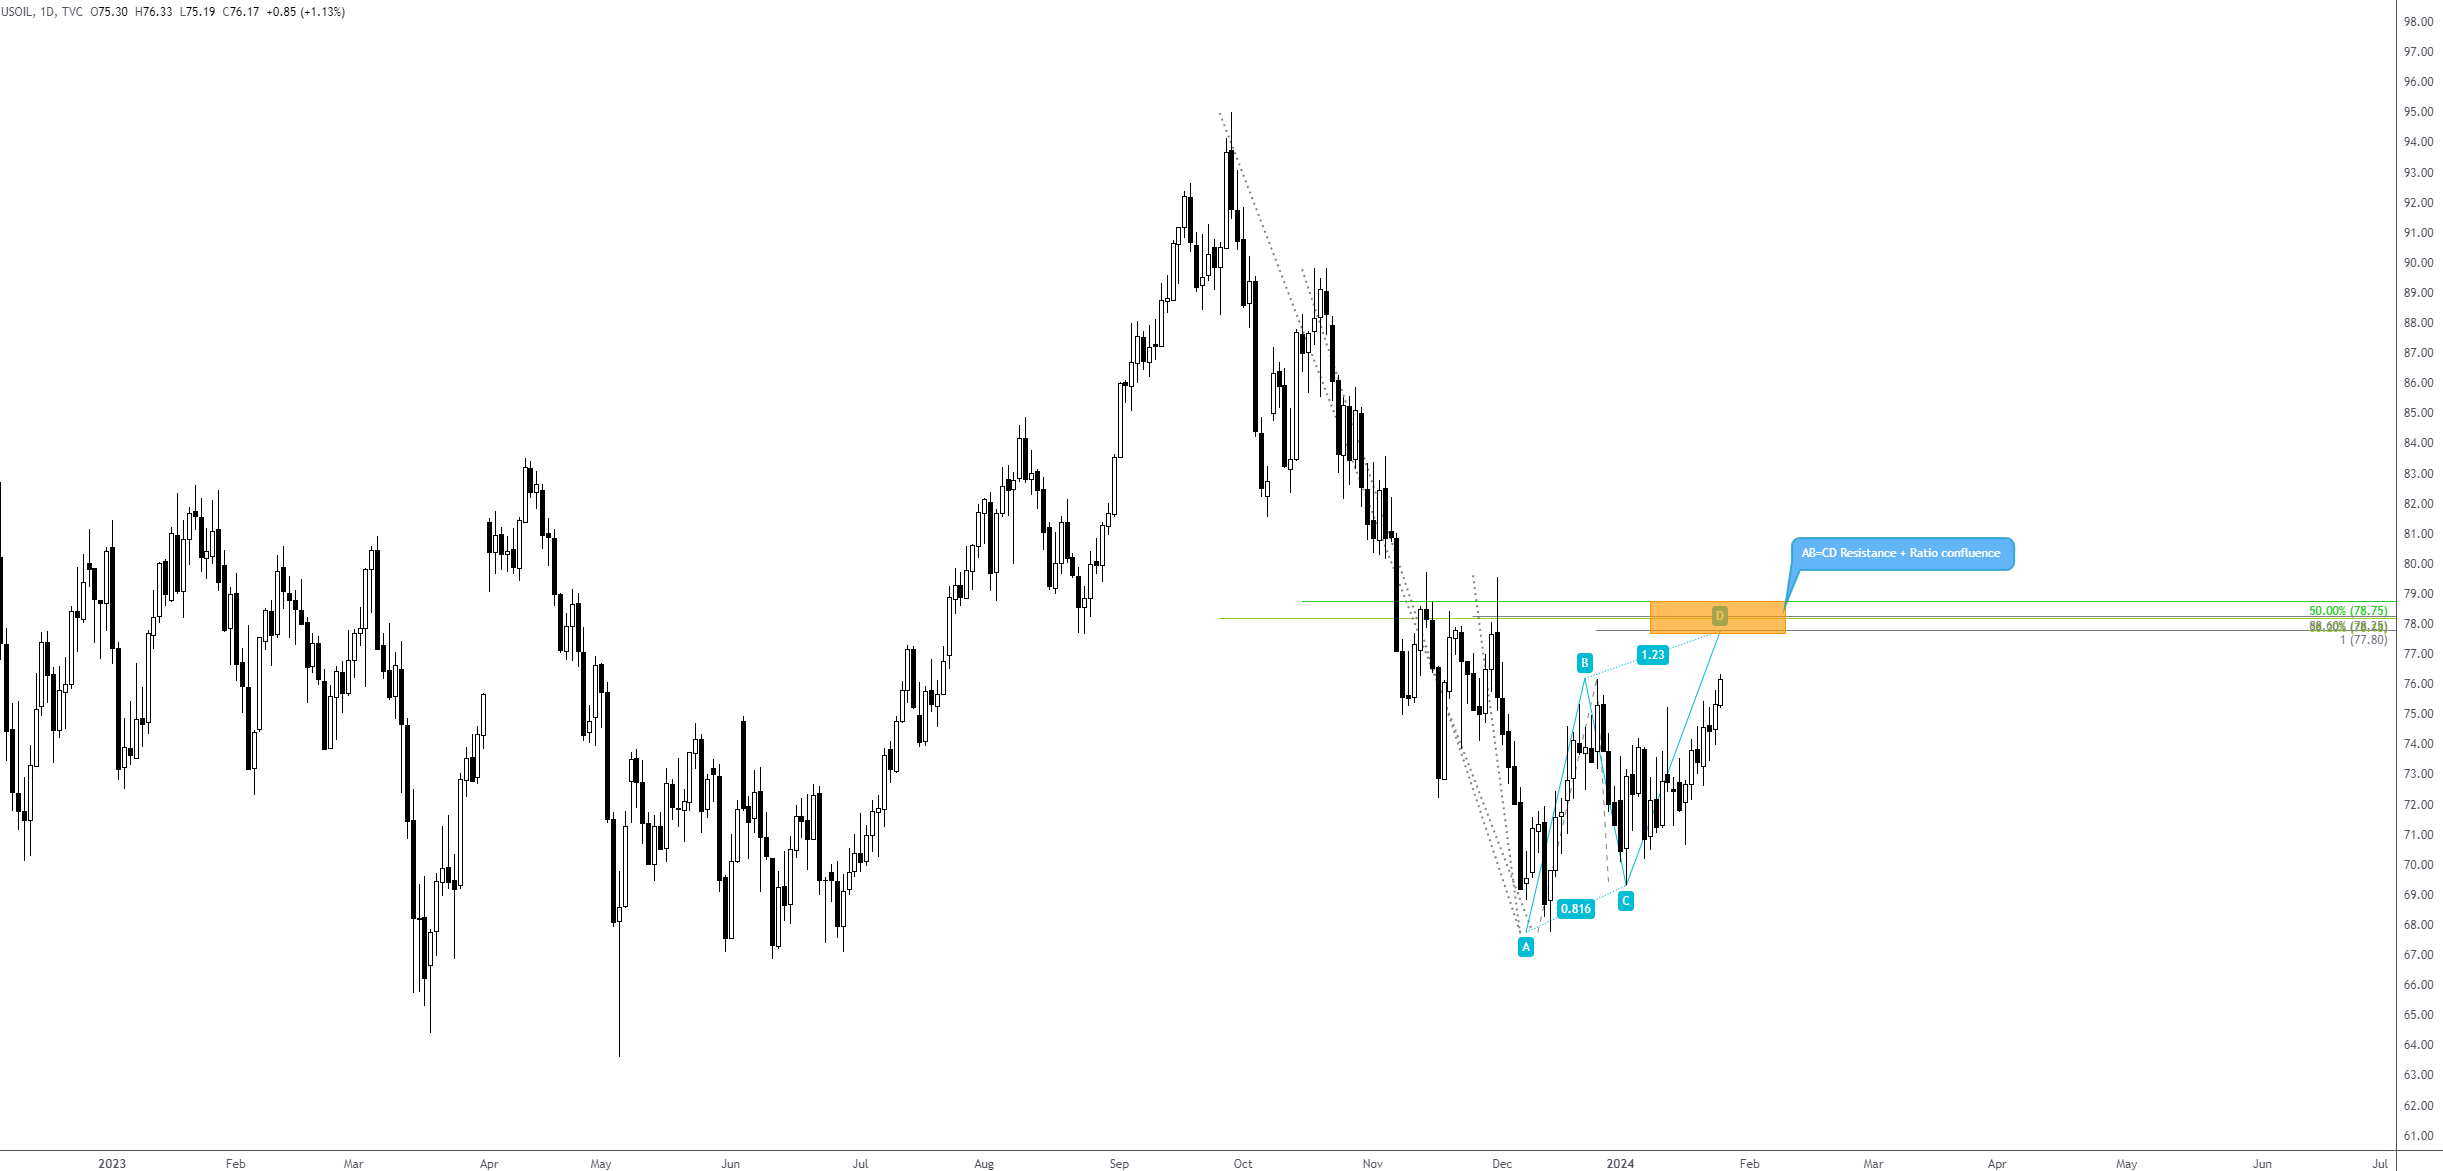
As evident from the daily timeframe of WTI oil, the unit has been trending lower since topping at $94.99 in late September 2023, shaped by a series of lower lows and lower highs.
What’s technically interesting right now is the possibility of an AB=CD pattern taking form at $77.80 (denoted by a 100% projection ratio) if price engulfs the $76.14 peak established in late December 2023. Adding to this pattern’s credibility are the surrounding ratios (some Fibonacci, some not) between $78.75 and $78.25.
Ultimately, should further upside materialise, resistance may take form between $78.75 and $77.80, from which the chart may welcome sellers in line with the current downtrend.
 Equities: Resistance and Negative Divergence for the S&P 500
Weekly Timeframe –
Although the S&P 500 is seen refreshing all-time highs, technical evidence suggests that this market index is overheated. Coupled with weekly price testing channel resistance (extended from the high of 4,607) and the Relative Strength Index (RSI), as well as other momentum measures, displaying early signs of negative divergence and price action poised to end the week by way of a shooting star (bearish candlestick signal), this signals weakness and exposes a possible correction back to support from 4,743.
 Cryptocurrency: XRP/USD Pencilling in Triple-Top Pattern
H1 Timeframe –
From a shorter-term perspective on the H1 chart, Ripple against the US dollar (or XRP/USD) is in the process of creating a triple-top pattern formation at $0.5189, with price action now seen toying with the pattern’s neckline at $0.5107.
Should we breach the neckline, this, given the bearish pattern formed on a pullback within an immediate downtrend, could trigger selling interest in the direction of the pattern’s profit objective at $0.5024.
 DISCLAIMER: The information contained in this material is intended for general advice only. It does not consider your investment objectives, financial situation or particular needs. FP Markets has made every effort to ensure the accuracy of the information as at the date of publication. FP Markets does not give any warranty or representation as to the material. Examples included in this material are for illustrative purposes only. To the extent permitted by law, FP Markets and its employees shall not be liable for any loss or damage arising in any way (including by way of negligence) from or in connection with any information provided in or omitted from this material. Features of the FP Markets products including applicable fees and charges are outlined in the Product Disclosure Statements available from FP Markets website, www.fpmarkets.com and should be considered before deciding to deal in those products. Derivatives can be risky; losses can exceed your initial payment. FP Markets recommends that you seek independent advice. First Prudential Markets Pty Ltd trading as FP Markets ABN 16 112 600 281, Australian Financial Services License Number 286354.


 Access +10,000 financial
instruments
Access +10,000 financial
instruments