
XJO WEEKLY
Price structure: MAJOR Support broken.
With a breakdown below an important support level of 6930, the index now enters a bear market with a Primary downtrend in place. Major support remains at 6400 should price weakness persist. With the month of October closing negative the statistical outcome will be a further decline into November.
Indicator: Relative Strength 14
Relative Strength has moved below the 50 level again as part of the overall directional decline in price. Only further movements over the key 50 level towards the 70 level will remain a bullish signal for further gains, a continued move below this important level would signal further Bearish momentum as sentiment currently remains weak.

Comments last week: Although the Index remains within a sideway channel with 6930 as the key support level, the breakdown 2 weeks ago was met with the seller closing the market below this key level. Two key levels are now in play the 7200 resistance level and the 6930 support level, a breakout over either
of these will be decisive for the overall direction into the final months of this year.
XJO DAILY
Price structure: RSI potential Divergence
The daily movements show some consolidation with last Friday remaining an inside day. In line with the Weekly Primary trend, the shorter daily view shows a series of lower highs and lower lows. The other important observation is the Daily ranges are becoming shorter following the “fluid movement” lower 2 weeks ago. This can be an early signal of reversal as directional momentum slows.
Indicator: Relative Strength 14
The Relative Strength Indicator (14) has turned higher into the close on Friday, as the Relative Strength Indicator still remains below the 50 level, only offering a bearish indication, any reading above the key 50 level shows price momentum is positive. Traders should monitor this for a further move higher on continued strength in price movements indicating an increase of bullish momentum from the current divergence signal developing.

Comments last week: The Daily view of the Index (investor sentiment) shows rejection at the often-tested 7090 level with a pivot point reversal. The 200-day moving average is rolling lower as a result of the decline out of consolidation above the 7090 level. With the chart showing a series of lower highs from the July’23 high point to test the lower support level, only further consolidation at this level would provide a bullish outlook in the coming months.
S&P 500 WEEKLY
Price structure: Primary down Trend.
The S&P has again confirmed a lower high (d) with a solid move below the 4200 support level (c). The next major support remains at 4050 also being the intersection of the current trendline. The S&P is in a Primary downtrend, confirmed last week with the Index posting an extended range down. The recent congestion area above 3800 provides major long-term support should the price at the 4050 level break lower.
Indicator: Relative Strength Indicator 14
Relative Strength has again turned lower and moved below the 50 level, but to remain bullish the RSI should turn higher and remain over the 50 level with any underlying price advances. In the coming weeks, this consolidation below the 4200 level may re-assert a bearish RSI signal as the Relative Strength Indicator turns lower.
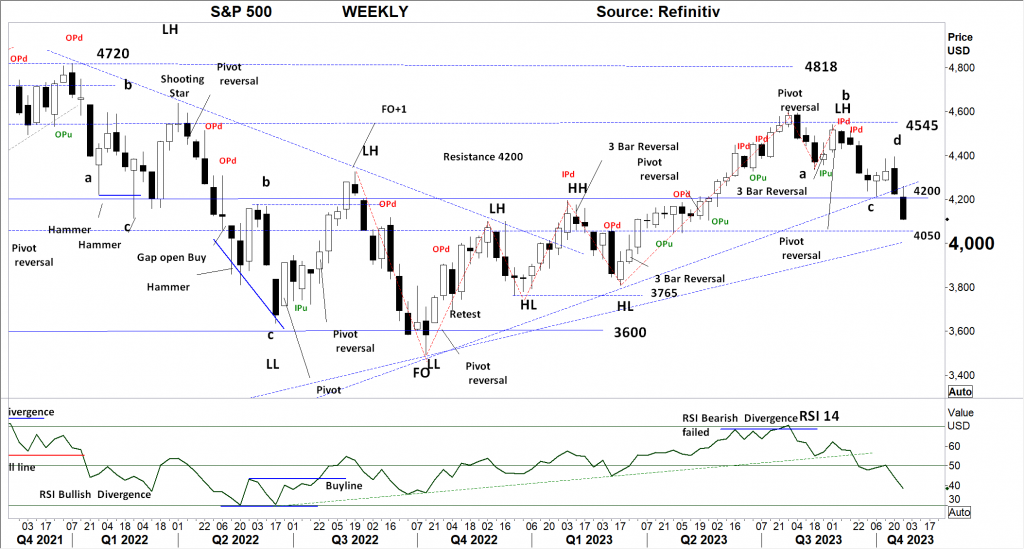
Comments from last week: The current a,b,c movement is complete with last week’s reversal bar also setting a pivot point. The Index is trading at the lower channel line, failure to rally from this level with a further decline will have the sellers and short sellers in control. A break of price below the “c” point will confirm this view. In the coming weeks, this consolidation below the 4200 level may re-assert a bearish RSI signal as the Relative Strength Indicator turns lower.
SPX DAILY
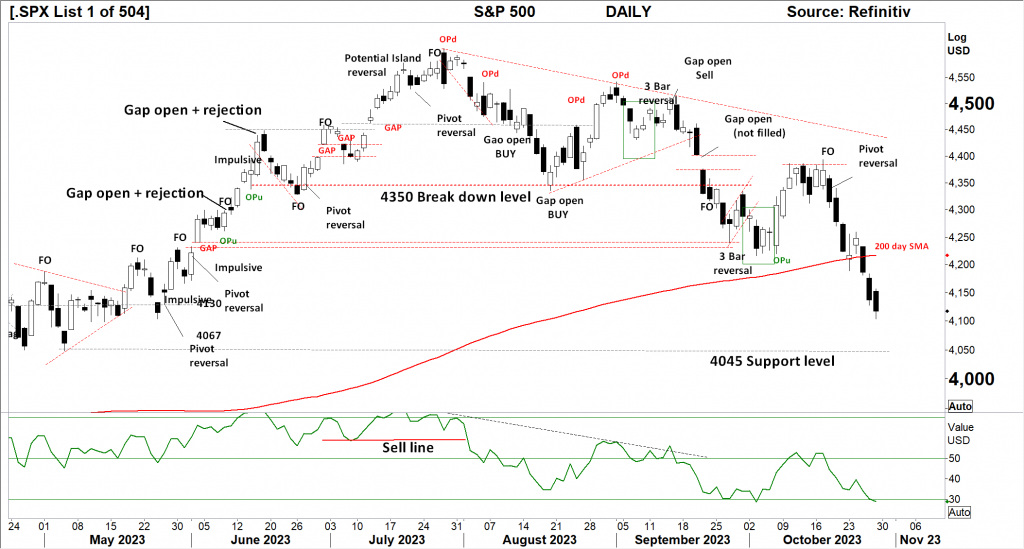
Price structure: 2nd Lower high
The Daily view of the S&P500 shows a clear breakdown below the 200-day moving average following some support over a 2-day period at the 4200 level. Currently, no reversal pattern is indicated with last Friday’s close towards the low of the day. Daily support is indicated at the 4045 level. The Index is in an extended move and may move lower on the current bearish price momentum.
Indicator: Relative Strength Indicator 14
Following a general decline in momentum from the June 23 highs, the Relative strength is now moving below the 30 level as bearish momentum increases. This may not be a final level of oversold and further declines in price can move the indicator lower.
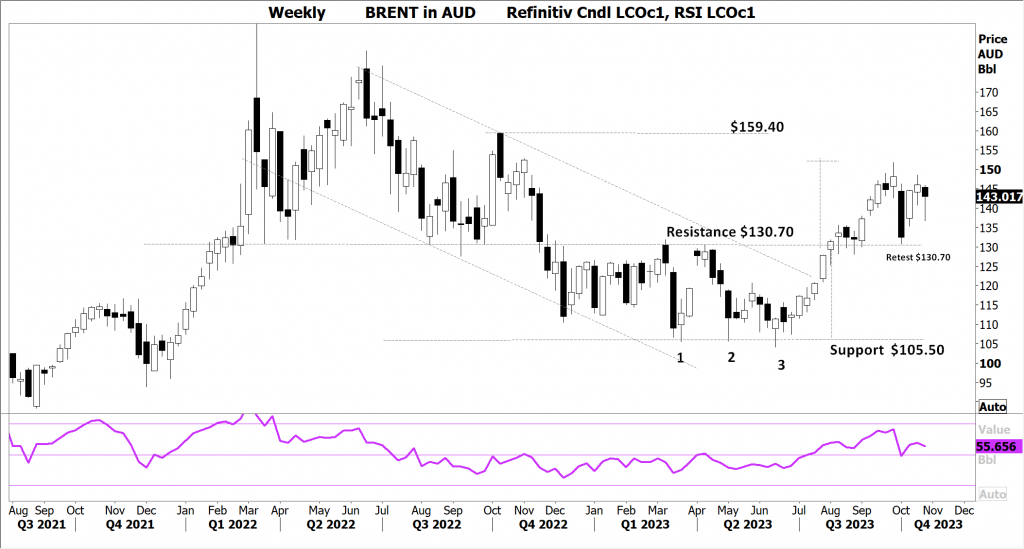
Brent Oil in Australian dollars
Within Australia the Oil producers work from the Brent price for contract sales of Oil, the final price in $AUD is also determined by the movement in the underlying Australian dollar. The current Chart of Brent Oil in Australian dollars shows a breakout (August 23) from the declining channel with a movement over the $130.70 level, two weeks ago this level was retested with last week showing a reversal to remain “inside the range”. A further breakout over $155.00 will put the underlying contract into a Primary UP trend with the potential to retest the $159.40 resistance and the $180.0 highs of June/July set this year. This chart is important to indicate what price of fuel will be at the pump as part of the fuel price is used to facilitate the inflation number in Australia.
Indicator: Relative Strength 14
Relative Strength has turned Lower from the 68 level the recent “retest” of support has seen the indicator also move back to the 50 level. Currently, the indicator has turned sideways in line with the current consolidation in price. Consolidation areas remain positive when the RSI remains above the 50 level.
Comments from last week: The Daily resistance shown at 4350 points is the go-to level for the Buyers indicating a solid reversal is taking place. Last Friday’s Outside range is a very positive price reversal signal off the 200-day moving average. The reversal bar is also regarded as a large range bar and has a high statistical outcome for indicating the low is now in place.
NASDAQ DAILY
Price structure: Continuing distribution top.
A new low in the Nasdaq again confirms the Primary downtrend in place. With the 200-day moving average in sight, the 14,000-point level remains the short-term target. Major support is next indicated at the 13,200 point level with an “open GAP” remaining at this level. Last Friday’s inside range “retesting” the 14,400 level is a bearish signal with the day closing towards the low of the range.
Indicator: Relative Strength 14
Relative Strength has moved lower below the 50-level setting a solid bearish signal as downward momentum continues. With the overall Relative strength is decreasing as the underlying price movements of the Index move to new lows. No divergence is shown at this stage but should now be monitored for a further reversal turn higher indicating a change of momentum.

Comments from last week: The Nasdaq has posted a third lower high as the Daily charts set a pivot point around the 15,140 level. Traders should look for a retest of the trendline in the coming days, failure to hold the trendline may see a retest of the 200-day moving average. Without a strong catalyst for the buyers to take the index higher, the downward trend may continue.
USD Spot GOLD – DAILY: Is it a Bull market? Maybe?
The $1982, level provided some resistance in the past week; however, the strong move last Friday puts Gold on target to test the $2049.0 level. As no “trending” action is evident the current move remains a “corrective move” and may be subject to sharp profit-taking with a retest of the $1982 level a strong possibility and should be factored into traders risk.
Indicator: Relative Strength 14
The RSI turning higher from below the key 70 level, turning with the rising price continues to be a positive observation, consolidation in price with a breakout higher will move the indicator higher, and a Relative Strength reading over 70 indicates strong momentum. However long-term traders should continue to monitor this long-term Weekly chart for a 4 th major yearly top in progress with further declines in the long term.
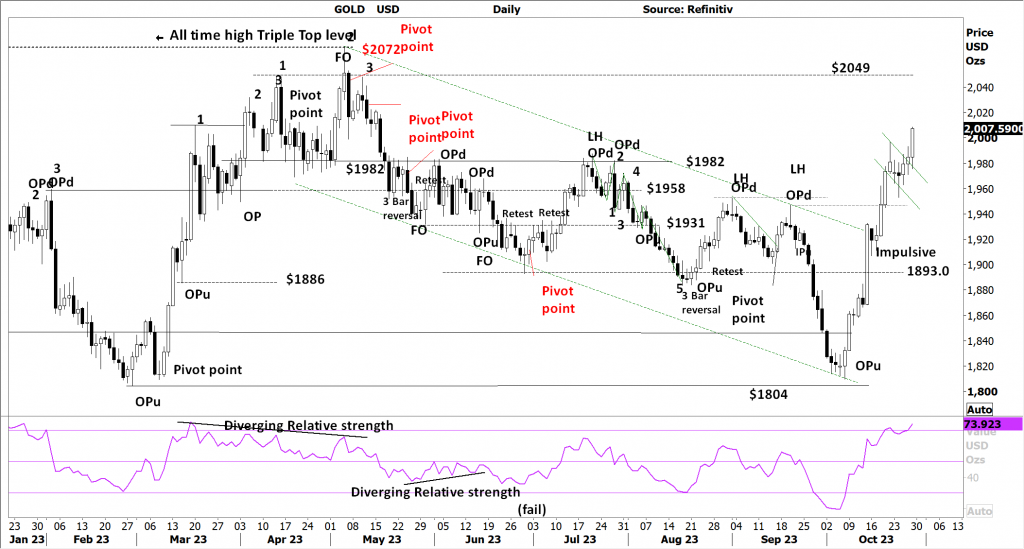
Comments from last week: USD Gold moved in excess of $60/oz to set an “impulsive move”, importantly the close is outside of the current downward channel and at the high of the range, this does not change the trend, but offers some insight to the underlying bullish momentum. Significant resistance remains at $1950 and $1982 in particular. The Australian Dollar Gold price also responded to set a new high of over $2000, this will be very bullish on opening today.
SILVER
Price structure: Bullish flag
The current “Bullish Flag” is very positive for further gains, the Daily chart clearly shows an inverse Head and Shoulder pattern developing. The breakout of the right shoulder would target the MAJOR resistance level of $24.60 first.
Relative Strength 14
Current Relative Strength has turned higher from below the 30 level and crossed the key 50 level, if the RSI continues higher, the bullish signal will continue, only a move to and above the 70 level reflecting a solid change in the underlying price momentum would alert traders to a potential new trend.

Comments from last week: Silver along with the other PMs posted a strong range to finish the week. The Primary trend remains down, with the current impulsive movement higher not offering a trend change, but a reaction to the recent decline. Several resistance levels remain, notably the $23.0 and $24.60 levels.
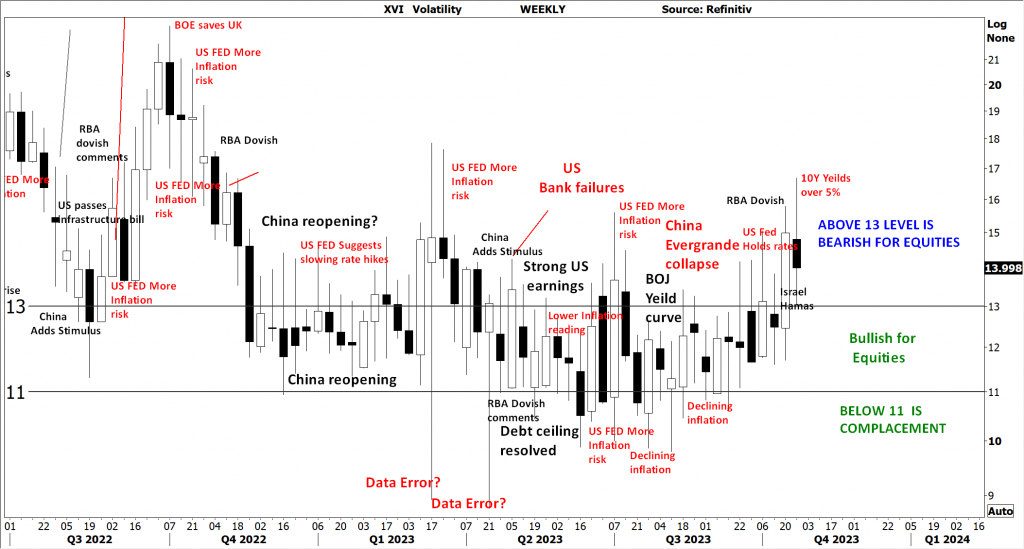
AUSTRALIAN VOLATILITY INDEX: The equities traders compass.
The current volatility closing value has moved outside of the 13 level again following another wide-range week higher.
While volatility remains at this level overall equities sentiment remains supportive for the BEARISH view, with the indicator pushing higher the forward pricing of PUT options is now increasing, and the underlying price volatility may remain bearish.
Lower consolidating commodities prices and bearish consolidation of equity prices are indicated when the reading moves above the 13 level.
For continued support of equities, the XVI should remain subdued below the “13” level.
The cost of 3-month forward PUT options is decreasing from recent elevated levels.
The XVI is the difference between the 3-month forward pricing of ETO Options against the current month. As markets anticipate events, the forward-priced option volatility changes, hence as forward price changes, this “skew” in pricing is measured in this XVI.
The XVI value works as an inverse observation of the underlying market.


 Access +10,000 financial
instruments
Access +10,000 financial
instruments