
XJO WEEKLY
Price structure: Bullish Weekly close
The XJO has set a strong pivot reversal pattern from the 3-bar retracement, following consistent strength in Banks and large resources. This will be the third attempt at a new all-time high over the 7632 level. A breakout will set the Index into a Primary UP trend. Positive market sentiment will flow to the smaller end of the equities spectrum, underpinning the trend.
Indicator: Relative Strength 14
Relative Strength remains above the 50 level again as part of the overall directional move higher in price. Only further movements towards the 70 level will remain a bullish signal for further gains, last week the RSI value moved lower a continued move below this important level to the 50 level would signal further Bearish momentum as sentiment may change.
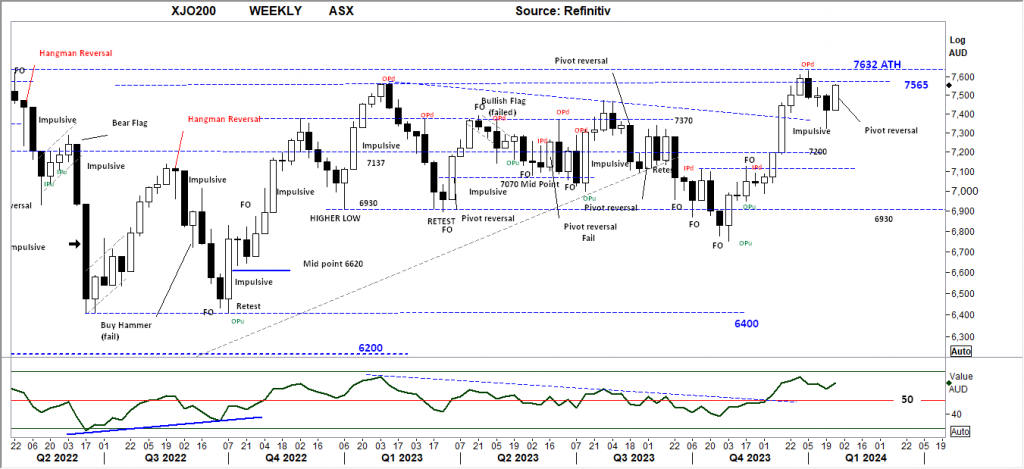
Comments last week: The Weekly chart of the XJO shows a bullish reversal bar with a close above the mid-range of the overall bar. With the retest towards the 7200 low falling short it adds to the bullishness of the current run from the 6930 support level. Traders should look for a further close above the 7565 and 7632 levels to confirm the resumption of the developing trend.
XJO DAILY
Price structure: Bullish pivot reversal follow through.
The development of the a,b,c type retracement is a very Bullish development with a continued follow through from the pivot reversal point. Last Friday, the index closed over the short-term resistance point at 7540. This level should now be monitored for support in the coming days as a signal of continuing internal strength in the Index.
Indicator: Relative Strength 14
The Relative Strength Indicator (14) turned higher into the close on Friday, as it had a swing to move below the 50-level following the sell divergence signal discussed three weeks ago. The current close above the 50 remains the play for this week.
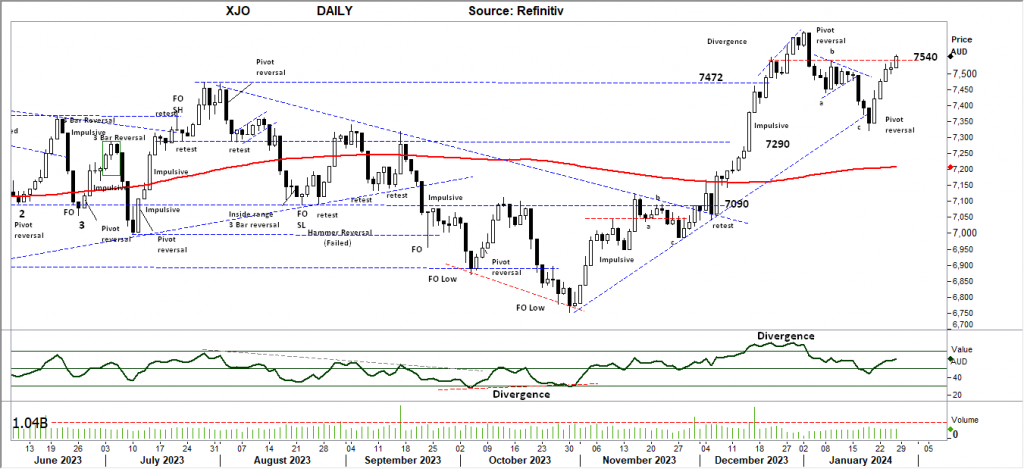
Comments last week: The development of the a,b,c type retracement is a very Bullish development in the Index with last Friday completing a Pivot point reversal. The Index displayed the same pattern during November 2023 with a completed breakout to the high side. The Weekly trend is UP with this early signal in the Daily chart no confirming the potential to retest towards the 7600 high.
S&P 500 WEEKLY
Price structure: breakout exceeds resistance level.
The S&P has moved to a new all-time high with a close above the 4818 level. With the close towards the high of the weekly range following the lower midweek retest 2 weeks ago, the current momentum move has the potential to move the Index higher. The Weekly chart remains within a confirmed Primary UP Trend.
Indicator: Relative Strength Indicator 14
Relative Strength has again turned higher and moves back towards the 70 level, but to give a strong momentum signal the RSI should move over the 70 level with any underlying price advances. In the coming weeks, traders will monitor the RSI for a bearish divergence signal as any consolidation towards the 4545 level may re-assert a bearish RSI signal as the Relative strength indicator turns lower below the 50 level.
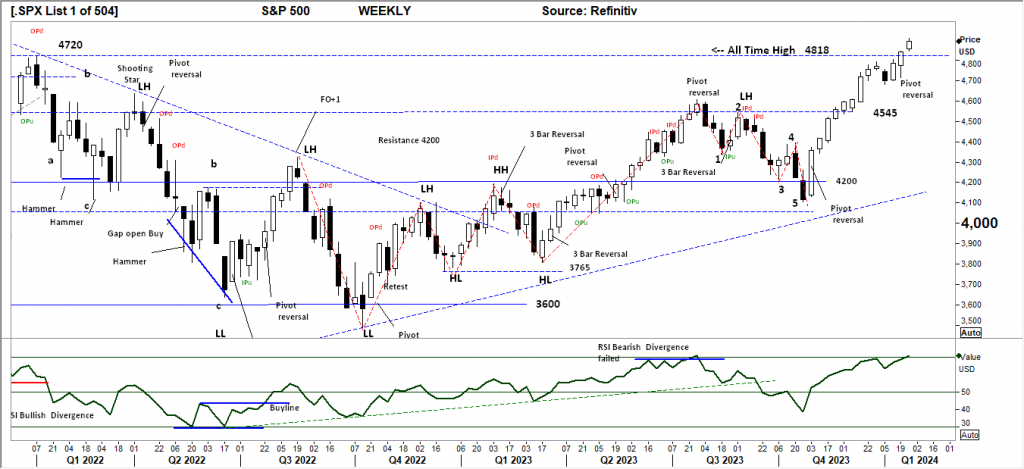
Comments from last week: The S&P has moved to an all-time high, with the close above the 4818 level. With the close towards the high of the weekly range following the retest lower midweek, the momentum move has the potential to move the Index higher. The failure of the reverse pivot three weeks ago to retest the 4545 support level highlights the bullishness of the Index, which remains in a strong Primary UP trend.
SPX DAILY
Price structure: Sell divergence developing
The Daily chart of the S&P500 is beginning to show some consolidation within the last three trading days. The small “FO” set on Friday is a significant daily reversal signal; follow-through lower would target the 4800 level as an important level to hold for the Bulls. Of concern is the distance away from the 200-day moving average, with a reversion to the mean possible following a strong reversal.
Indicator: Relative Strength Indicator 14
The Relative Strength Indicator has moved above the 70 level, indicating stronger momentum. Although not a signal of overbought, the current second and third movement into this over 70 level is often seen as a level to take profits, as seen during July 2023 and December 2023. The current Sell divergence signal has been resolved with the RIS line setting a new higher low and moving back towards the 70 level.
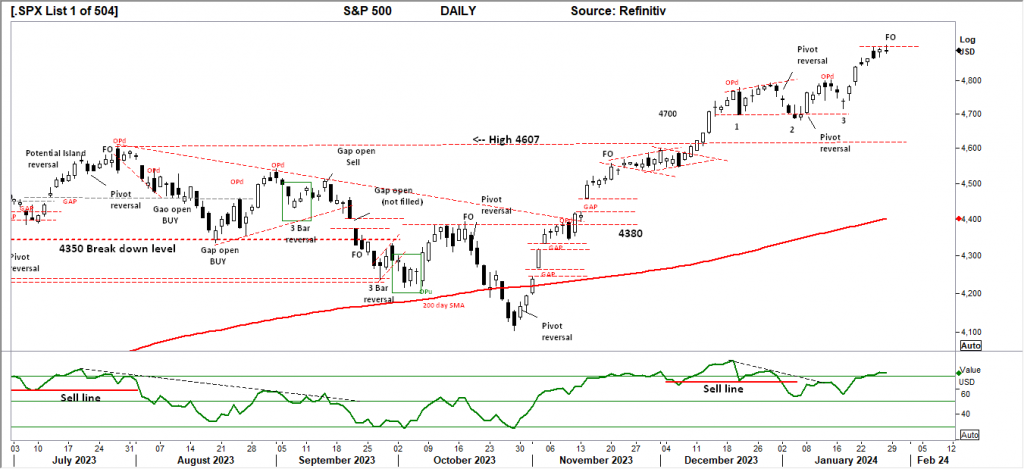
Comments from last week: The Daily chart of the S&P500 now displays a strong support level at 4700 with three retests on that level. The strong range day last Friday has the potential to follow through to higher levels following the display of a morning star pattern at #3. This has set a second bullish pivot point now in the background, but a strong signal of buyers taking control of prices.
NASDAQ DAILY
Price structure: Bearish reversal
The Nasdaq may be in the process of setting an Island top, following the breakaway Gap set last Wednesday and the “pivot point” set last Friday. The Daily UP trend appears to be nearing exhaustion, with the potential for a significant pullback. Of concern is the distance away from the 200-day moving average, with a reversion to the mean possible following a strong reversal.
Indicator: Relative Strength 14
Relative Strength has again moved over the 70 range, it remains an area to monitor for further exhaustion reversal. The observance is the overall Relative strength is again, bullish for now, however the 3rd movement over the 70 level is often a signal of exhaustion. The RSI should now be monitored for a further movement lower, indicating a change to slowing momentum.
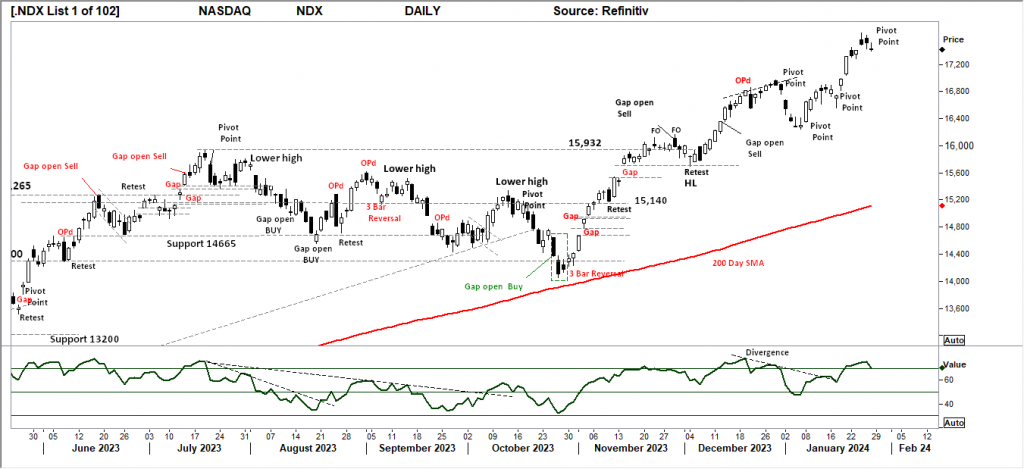
Comments from last week: With the Pivot point set and the current breakaway gapping of price, the Index is set to move to new highs. With the underlying primary trend remaining UP, the divergence away from the 200-day moving average ( also pointing up) is a cause of concern in the short term. As confirmed by the strong range day set last Friday, traders should be aware that taking can be swift at these high levels.
USD Spot GOLD – DAILY: New Down Trend.
The gold price in USD remains trapped within a consolidation area between the $2072 high and the major support level shown at $1982. The current development of the Bearish pennant suggests a further retest towards the $1982 level. Without a strong catalyst, the price of USD Gold may remain directionless. A Bullish breakout over $2049 or a bearish breakdown below $1982 is required to show direction.
Indicator: Relative Strength 14
The RSI turning lower from below the key 50 level, again turning lower with the consolidating price, during the current consolidation in price only a breakout higher will move the indicator higher towards the 50 and higher to the 70 level, a Relative strength reading below 50 indicates bearish momentum. Long-term traders should continue to monitor this long-term Daily chart for a 5th major yearly top in progress at the $2072.0 level with further declines in the long term.
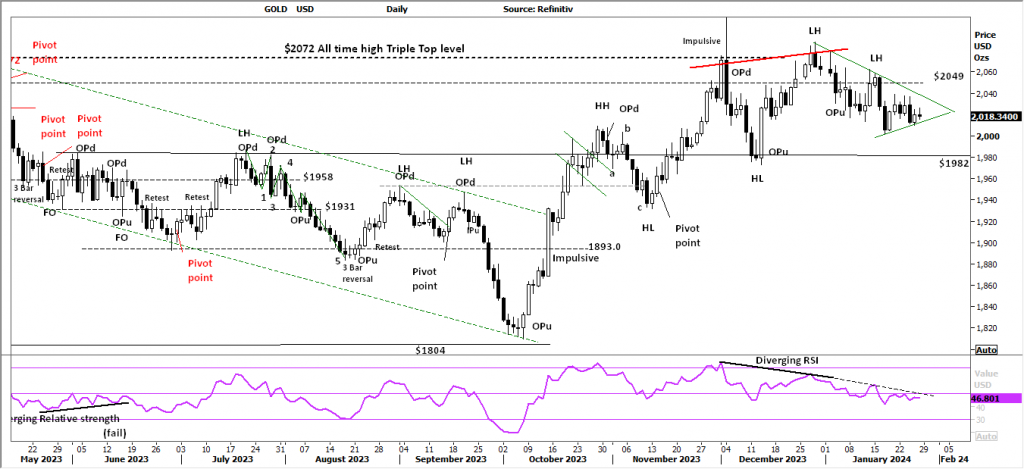
Comments from last week: The daily chart has again begun to trend down from the $2072 highs, the retest and failure at the $2049-$2050 remains a strong bearish signal. Further failure of the price to exceed this level in the coming week will keep the technical sell signal in place. The broader (Weekly) trend in Gold remains UP from the October lows; however, continued weakness below the $2049-$2050 level has the potential to set a new weekly downtrend in place.
SILVER
Price structure: New Downtrend
Like other precious metals, Silver in USD continues to test lower within the current Down Trend. The $21.90 level is developing as the next support level to hold on to further declines. The underlying trend has changed to a Down Trend, highlighting no Buyer support at the $22.50 level. Silver remains within a large consolidation zone below $26.40 and above $21.90 with no identifiable reversal in place.
Relative Strength 14
Current Relative Strength has turned lower below the 50 level to move sideways at this level, indicating momentum has turned neutral; if the RSI continues lower, the bearish momentum signal will show a continued price movement lower. Only a continued move higher would reflect a solid change in the underlying price momentum and would alert to a potential new trend and breakout.
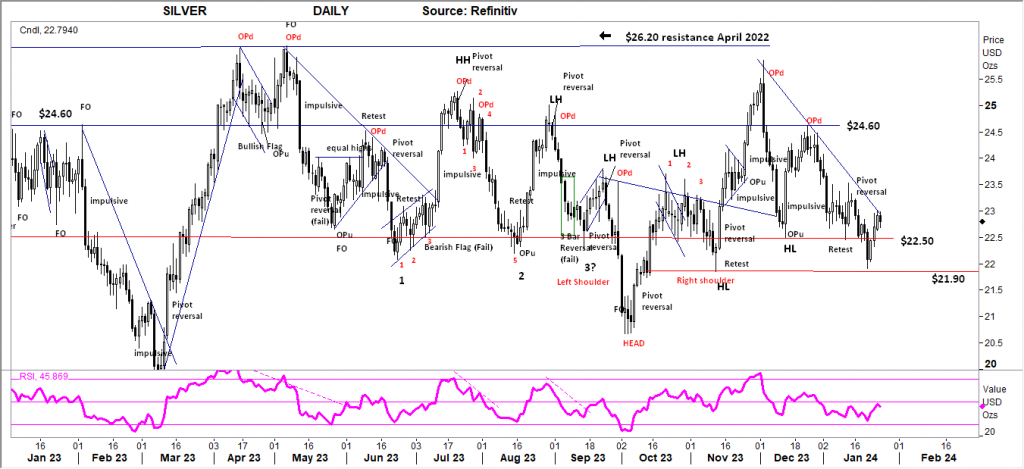
Comments from last week: Silver again retests the $22.50 level with some indecision bars set last Thursday and Friday. This pattern is a Bearish consolidation with the potential for a price move lower towards the $22.09 level and lower. Silver remains within a large consolidation zone below $26.40 and above $22.09 with no identifiable primary trend in place.
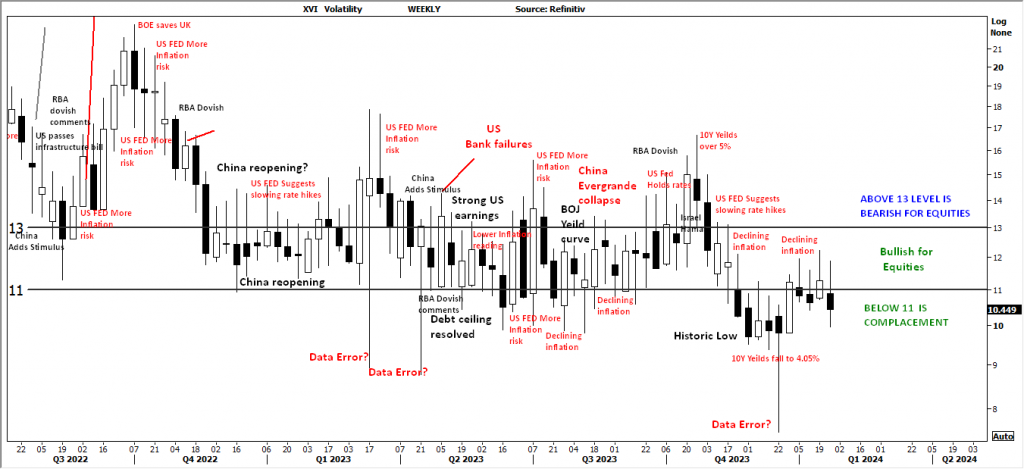
AUSTRALIAN VOLATILITY INDEX: The equities traders compass.
The current volatility closing value has moved to below the 11 levels, closing lower than the XVI is within the “complacent” level.
With the indicator now moving lower the forward pricing of PUT options is now decreasing, this is observed against a rising market indicating equity price movements may turn further bullish as the cost of 3 month (insurance) Put Options is decreasing (less demand).
For continued support of equities, the XVI should remain subdued below the “13” level.
The cost of 3-month forward PUT options is decreasing from recent elevated levels.
The XVI is the difference between the 3-month forward pricing of ETO Options against the current month.
As markets anticipate events, the forward-priced option volatility changes; hence, as forward price changes, this “skew” in pricing is measured in this XVI.
The XVI value works as an inverse observation of the underlying market.


 Access +10,000 financial
instruments
Access +10,000 financial
instruments