
XJO WEEKLY
Price structure: Breakout retest
Without follow-through lower than the previous week’s retest of the 7632 level, the price action last week remained neutral until the recent high of 3 weeks ago was taken out with a close over 7853 points. The underlying Primary trend remains UP, with current price action not indicating a reversal pattern until a close below 7632 takes place. With economic strength in the recent employment numbers and a reasonable half-year reporting season completed, the index strength is strong with a substantial increase in the banks and the large industrial Wesfarmers.
Indicator: Relative Strength 14
Relative Strength remains above the 50 level again as part of the overall directional move higher in price, and the higher turn may again cross the 70 level into a bullish signal. Only further movements towards the 70 level will remain a bullish signal for further gains. Last week, the RSI value moved sideways in line with price consolidation. However, a new high is required over the late Q4-2023 high point. A new divergence signal may develop at this level.

Comments last week: The key reversal bar stands out as a retest of the 7632 breakout level. This is the key level for the buyers to hold this week. The underlying Primary trend remains UP. A further decline below the 7632 level puts the 7300 level as support to hold. Seasonally, in late March, the Index value remains under pressure, with companies declaring and paying half-year dividends.
XJO DAILY
Price structure: Retest of the high.
With the trendline broken and redrawn, it now has only 2 touches and remains “tentative.” Last Friday’s high close in price action is positive for further gains early this week. With many of the Index drivers down from recent highs, the index indicates that broader support may be developing at the smaller end of the 200 listed companies.
Indicator: Relative Strength 14
The Relative Strength Indicator (14) turned lower into Friday’s close, as it had a swing higher to move towards the 70-level. A further turn higher on positive price movement would be expected.
This is not the level at which traders should look for a further sell divergence, as the RSI has yet to turn higher above the 70 level.

Comments last week: The Bullish breakout described last week failed as the “impulsive” reversal bar was set. A break of the short-term trend line has now occurred with the retest towards the 7540 level. The high range close last Friday indicates buyers entering the market on weakness. The Daily trend remains UP. Further consolidation should be expected along this level. A daily close below the 7540 level would set a very bearish outlook into April.
S&P 500 WEEKLY
Extended move.
A strong weekly range to set new highs with no meaningful price retracement since November 2023. This current extended move is at risk of a sharp profit-taking event. Traders entering the market at this level are buying into an extended move at risk of significant reversal.
Indicator: Relative Strength Indicator 14
Relative Strength has turned higher as the momentum indicator remains over the 70 level, but to remain a strong momentum signal, the RSI should continue a move over the 70 level with the underlying price advances. In the coming weeks, traders will monitor the RSI for a bearish divergence signal as any index price consolidation towards the 4818 level may re-assert a bearish RSI signal as the indicator will turn lower towards the 70 level and below.
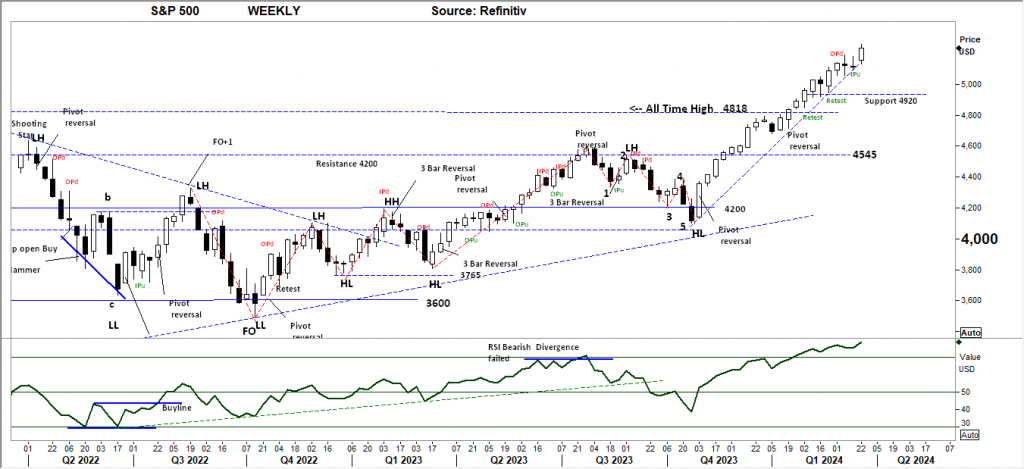
Comments from last week: Consolidation with an inside range (IPu) against the Outside range of two weeks ago is the early warning of a bearish reversal underway. A further close below 5090 would complete a reversal pattern, with further support at 4920 indicated. This current extended move is at risk of a sharp profit-taking event. Traders entering the market at this level are buying into an extended move at risk of significant reversal.
SPX DAILY
Price structure: Breakout
The Daily chart now displays a “Gap open” sell signal. For the signal to complete a close under the low of last Wednesday’s breakout bar at 5171 points, this level would also break the short-term trendline in this long, narrowing wedge pattern. This is not the place to increase exposure, as a profit-taking event can happen very quickly.
Indicator: Relative Strength Indicator 14
The Relative Strength Indicator remains below the 70 level, indicating slowing momentum, and is currently turning lower. The recent second and third movement ( January – February) into this over 70 level is often seen as a level to take profits, as seen during July 2023 and December 2023. The potential Sell divergence signal has again developed, with the RSI line setting a new lower high.
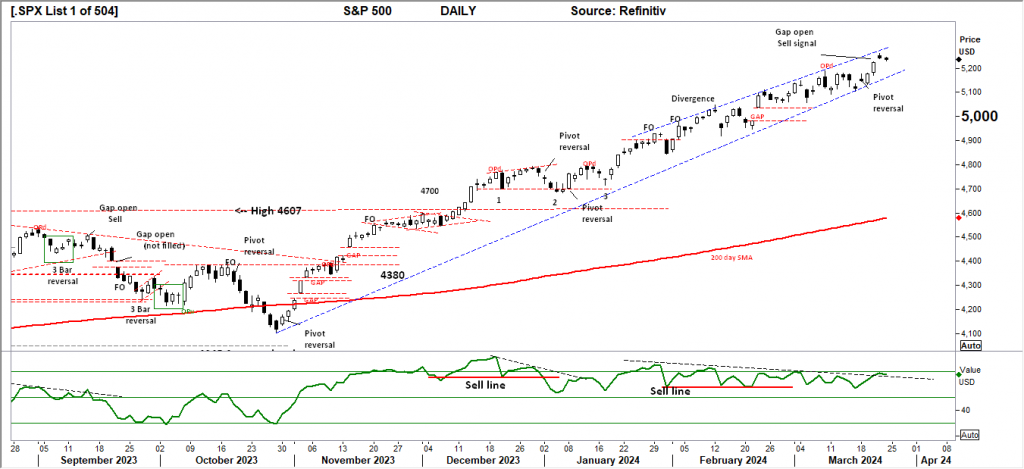
Comments from last week: The outside range (OPd) set six periods ago remains the dominant feature in the current price action. With the lower trendline now being tested, there is high potential for a move into the “GAP” area around the 5000-point level. With the US and Australian companies’ financial reporting now finished, analysts will begin the re-rating. The consensus is for further earnings growth inside the current inflationary cycle.
NASDAQ DAILY
Price structure: Outside range remains dominant.
Last week, the Nasdaq set a Fake Out (FO) to retest the OPd of 3 weeks prior; the FO bar is also the Gap open sell signal discussed in the S&P500 (above). Consolidation is developing above the “Gap” area. The current price range may persist between the OP high of 18416.0 and the “GAP” support level of 17790. Topping patterns can present 3 spike high points, 2 now completed with the OPd and last week’s FO retest of the highs. Without a real catalyst, the Nasdaq may continue to consolidate at these levels.
Indicator: Relative Strength 14
Relative Strength has moved towards the 70 level and has moved away from the “sell line”. The observation is that overall Relative strength has turned bearish for now. The failed fourth attempt to move over the 70 level is often a signal of exhaustion. The RSI should now be monitored for further movement lower below the 50 level indicating a change of momentum. This may provide some early insight into overall trend failure.

Comments from last week: As with the S&P 500, the Nasdaq Daily chart displays the outside period down close (OPd). This remains the controlling feature for market technicians. With the current price action sitting at the “Gap” level of 17,700, the current risk is further price declines into the Gap area, with a rest of the 200-day moving average (16,000). Overall, the Index is building a broad distribution top that may take many weeks to resolve higher.
USD Spot GOLD – DAILY
Potential retest lower.
The breakout discussed last week has occurred but rejected the $2218 price level, resulting in a Fake Out bar (FO) closing inside the previous high point of $2194, followed by further selling in the Friday session to set a Pivot point sell signal. The $2135 level remains the go-to support level that must hold to keep the buyers interested. Price is now clearly developing into a consolidation area above this important level with 2 spike high points now in place. The risk is for a 3rd to develop, indicating a distribution top in place.
Indicator: Relative Strength 14
The RSI is turning sharply lower from above the key 70 level set earlier this month. With the price reversal, this breakout lower has moved the indicator below the 70 level, but only the Relative strength reading below 50 indicates bearish momentum. Long-term traders should continue to monitor this Daily chart for a fifth major yearly top developing at the $2195.0 level, with further declines in the long term.
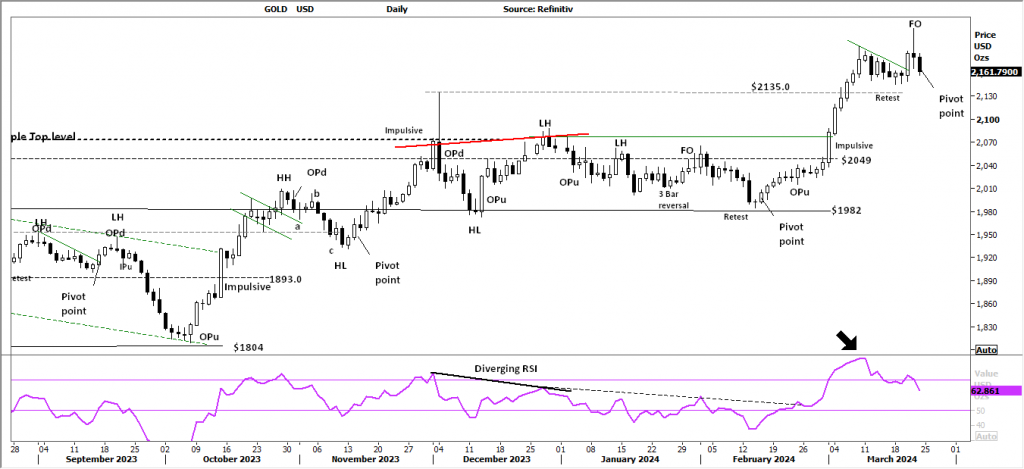
Comments from last week: As discussed last week, the USD Gold price has the potential to move lower to fully retest the $2135.0 level. Wednesday last week, buyers attempted to reclaim the $2195.0 high, but the price has retracted back towards the breakout level of $2135.0. Overall the pattern is a Bullish continuation flag, a breakout high must occur in the next few days to confirm. Failure to break out may lead to early selling by short-term position holders.
AUD Spot GOLD – DAILY: Inside range followed by rejection.
The AUD Gold price is based on the USD Gold price in Australian dollars, the variable of both setting the $AUD price. With the rejection discussed in the $USD gold price (above), the potential is for a decline in this AUD price. Australian Gold producers sell in Australian dollars. Currently, the price remains strong, with all-time highs being offset by rising mine costs. Overall, the outlook remains positive.
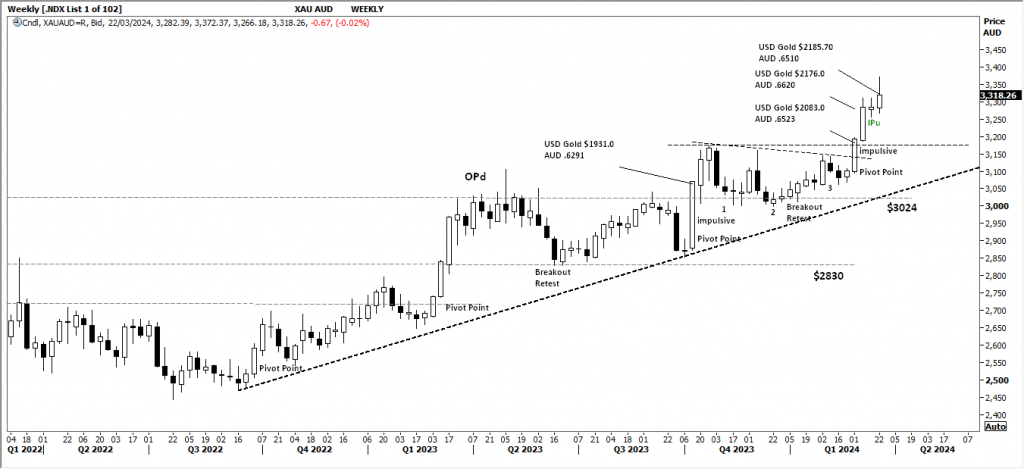
Comments from last week: As the AUD Gold price is a factor of two forces, the USD Gold price and the underlying $AUD, this risk of reversal always remains, the current Weekly Inside period up close (IPu) may indicate a short term top in place following the two impulsive breakout weeks. For a retest of the Trendline, the USD Gold price would need to decline, and the $AUD would gain strength. Current price levels remain bullish for the underlying gold producers, NST, EVN, NEM, and GOR.
SILVER
Price structure: Key rejection.
Silver has posted an OPd ( outside range) to retest the $24.60 level again. Technicians should also notice that the close on Friday was above this important level. The OP bar has a statistically high outcome of marking major swing points in price action. Currently, the support level of $24.60 and the resistance level of $26.20 may provide a consolidation area for current price action. Many are calling for a Bull market in the PM, technical traders will be aware Silver remains within a 2 year trading range.
Relative Strength 14:
Current Relative Strength has turned higher above the 50 level and reached the 70 level, indicating momentum has turned very Bullish. If the RSI continues higher, the earlier bullish divergence signal will give way to a strong Buy signal. Only a continued move higher and over the 70 levels would reflect a solid change in the underlying price momentum and should alert to a potential new trend and breakout.
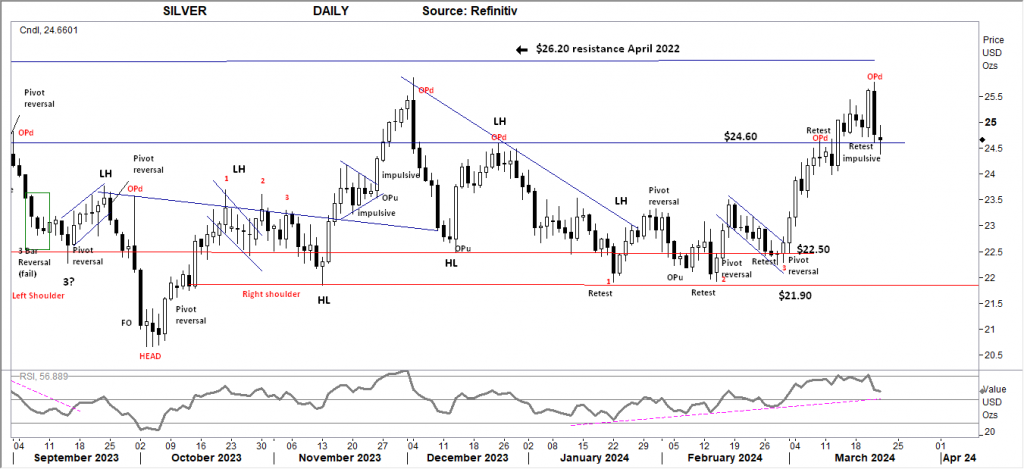
Comments from last week: Silver has shown a strong advance to close over the key $25.0 level following the breakthrough of $24.60 resistance. Current momentum remains strong (see RSI note) and may follow through to the $26.20 level. Traders should note that Silver remains in a long consolidation range between $21.90 support and $26.30 resistance.
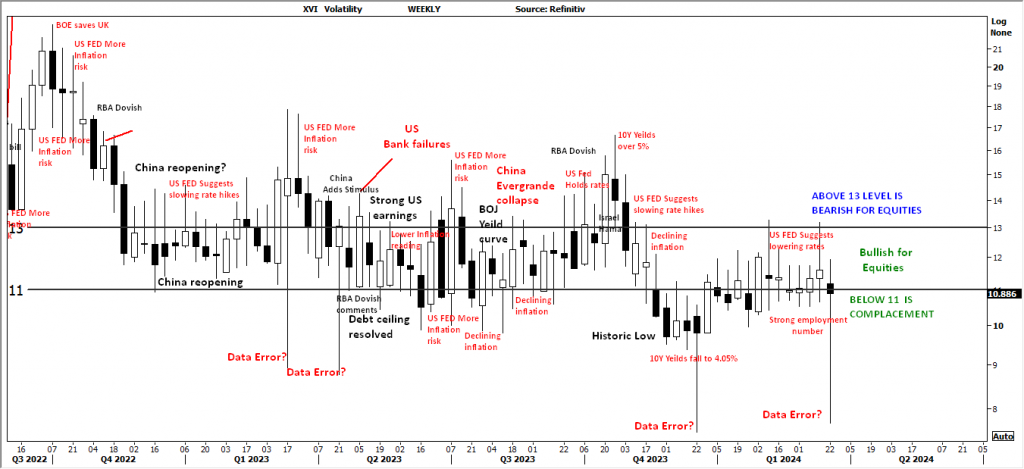
AUSTRALIAN VOLATILITY INDEX: The equities traders compass.
The current volatility closing value has moved to close at the 11 level following a move towards the 13 level. This closing value indicates that the XVI remains within the “bullish” level.
With the indicator moving higher early in the week, the forward pricing of PUT options (insurance) was increasing. This is observed against a rising market, indicating equity price movements may turn bearish as the cost of 3-month (insurance) Put Options is increasing, suggesting the market is moving to a protect profits mode.
For continued support of equities, the XVI should remain subdued below the “13” level.
The cost of 3-month forward PUT options is decreasing from recent elevated levels.
The XVI is the difference between the 3-month forward pricing of ETO Options against the current month. As markets anticipate events, the forward priced option volatility changes, hence as forward price changes, this “skew” in pricing is measured in this XVI.
The XVI value works as an inverse correlation to the underlying market.


 Access +10,000 financial
instruments
Access +10,000 financial
instruments