
XJO WEEKLY
Price structure: Remains Bullish
A solid trading range lower without moving over the important 7370 level has set up the retest of the trendline. This week, only a trading range and next Friday’s close back over the 7200 level would confirm a breakout higher. This type of Weekly range is often a precursor to a reversal in the following week (this week). The better outcome is consolidation at this level. Should the Index move lower towards the 7000 level, a bearish view would be maintained. The Index remains within a major trading range above 6400 and below 7565 points.
Indicator: Relative Strength 14
Relative Strength has moved below the 50 level (just) as part of the overall change in momentum with last week again turning slightly lower at this important level. Only further movements over the key 50 level towards the 70 level will remain a bullish signal for further gains; a continued move below this important level would signal further Bearish momentum as sentiment currently remains mildly bearish. A cross above 50 is a bullish signal.
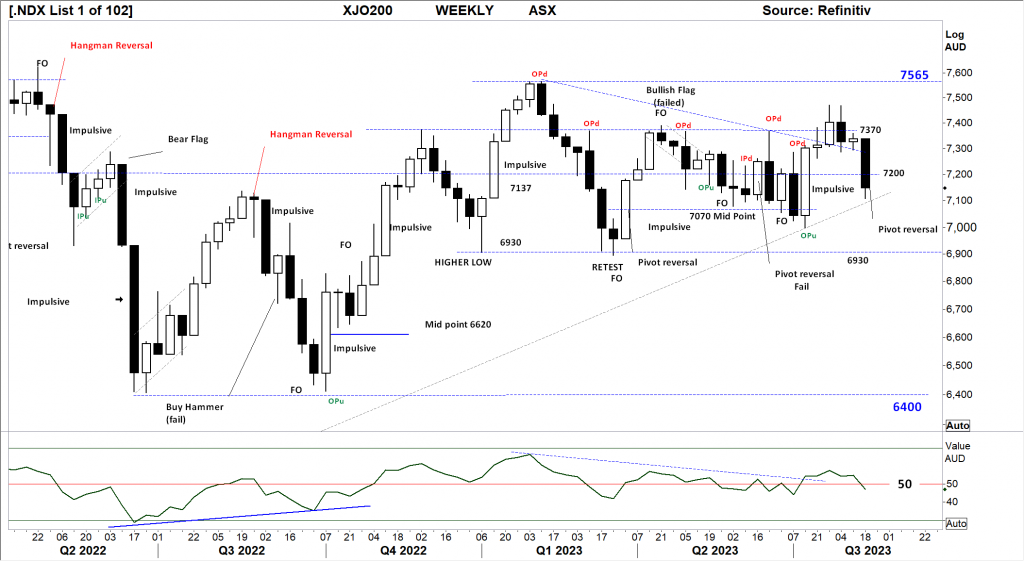
Comments last week: The small inside range reversal set last week remains bullish for further gains. Regarding the low of the week, this week, only a trading range over the 7370 level would confirm a breakout of the current consolidation. Should the Index move lower towards the 7200 level, a bearish view would be confirmed. The Index remains within a major trading range above 6400 and below 7565 points.
XJO DAILY
Price structure: Sentiment remains very bullish.
The bearish flag structure has played out with a series of impulsive moves to retest towards the Trendline. The current high momentum move below the 200-day moving average has slowed to show a 3-bar reversal pattern; this type of setup is highly indicative of a swing point low forming. The first indication of a low in place will be a daily close over the current inside bar.
Indicator: Relative Strength 14:
The Relative Strength Indicator (14) turned lower, the indicator remains below the 50 levels, and any reading above the key 50 level shows price momentum is positive. Traders should monitor this for a further turn lower on weakening price movements indicating a loss of momentum again.
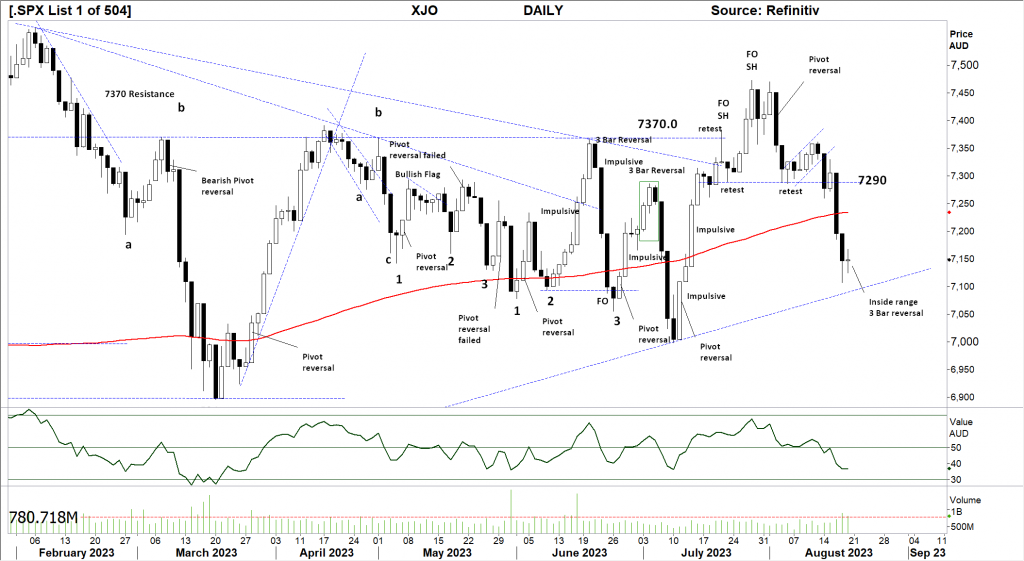
Comments last week: The Daily view indicates a bearish flag is developing, identified with the week’s trading days overlapping each other. Should the Index close below the 7290 level, this view will be confirmed.
S&P 500 WEEKLY
Price structure: Extended movement
The pivot reversal of 2 weeks ago continues to play out to the short side. Last week the market set an extended range, with the seller taking control; however, with the closing price within 20% of the low, traders should look for a reversal into the mid-range over 4400 points. A further close below the low keeps the 4200 key support level on target.
Indicator: Relative Strength Indicator 14
Relative Strength has again turned lower from the key 70 level, but to remain bullish, the RSI should continue to turn higher and remain over the 50 level with further underlying price advances. The RSI rollover of the last 3 weeks indicates slowing momentum with a clear bearish divergence signal that has failed in this extended price move. In the coming weeks, this may re-assert a bearish divergence signal.

Comments from last week: The reversal pivot discussed last week has played out lower to confirm the Pivot reversal. The range of the week remains relatively short, indicating the sellers have no real control. The overall price rally from April 2023 remains extended. The potential remains for a retest of the 4200 level following the retest of the 4545 level mid week.
S&P 500 DAILY
Price structure: Looking for support
With the “Gap open” discussed last week as a strong reversal signal, the follow-through only remained for One trading day before the bearish reversal last Tuesday set the tone for a lower market to follow. The S&P has set a second “Gap open buy” with the “retest” of the 4335 small support level. This type of reversal should be immediate. Price failure at this level, with a close below the 4335 support targets the open Gap at 4200 as next support.
Indicator: Relative Strength 14
Relative Strength is pushing towards the 30 levels again, as momentum changes but also confirms a clear completed divergence signal. For further price strength in this index, the RSI move has to be higher to sideways, back above the key 50 levels, should the RSI continue to move below the key 50 level bearish price momentum may continue to play out in the coming weeks.
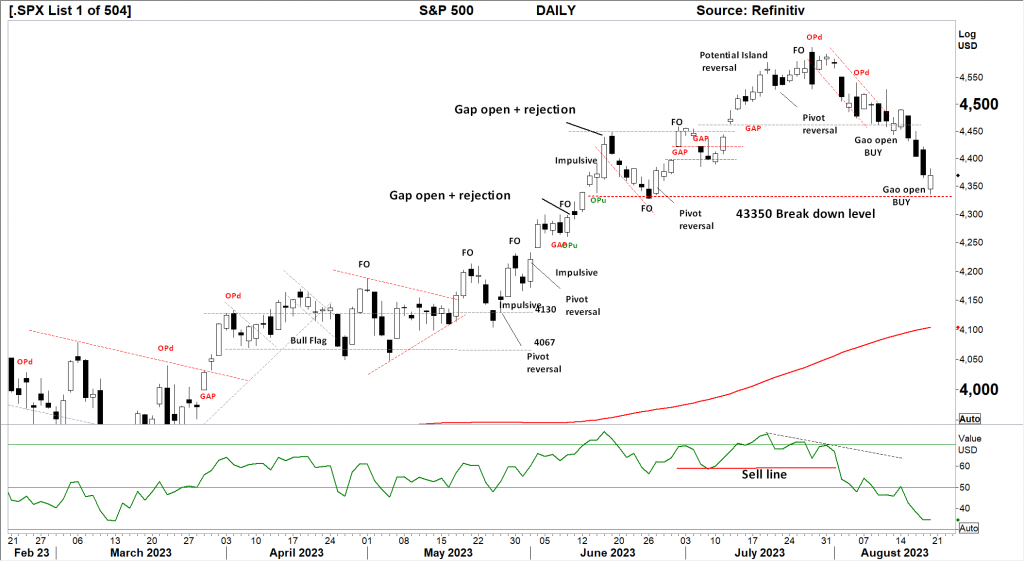
Comments from last week: With the Gap area now filled, the S&P Daily chart shows a “Gap open” reversalbar, regarded as an exhaustion bar. Following the persistent move lower, this coming week may see a primary trend rally in price to a higher level. For traders, this is an important level to hold.
NASDAQ DAILY
Price structure: Island Top complete
Similar to the S&P500, the Nasdaq “gap open buy” only followed through higher for one day before reversing back to the 14,700 level. The Nasdaq has set another “Gap open buy” signal at this current support level, however, confirmation is required with a solid close towards the 14,900 level. It should be noted there is a price Gap in the chart towards the 13,600 level. Should this current support level fail, a retest of the 14,300 level is a high probability outcome.
Indicator: Relative Strength 14
Relative Strength has declined to below the 50 level setting a bearish signal as momentum changes from up to down. The Relative Strength declines as the underlying price movements of lower closing highs and lower lows takes place. No divergence is shown at this stage, but it should now be monitored for a reversal turn higher.

Comments from last week: The Nasdaq has moved below the long-term trendline as the “Gap” from early July is filled. The current price decline from the 15,800 high is identified as a “secondary movement”. This is often bullish. The current “gap open” bar set last Friday is a bullish reversal; this week, the chart may post a higher reversal. However, the break of the trendline should not be ignored as the precursor for a further breakdown in price.
USD Spot GOLD – DAILY: Is it a Bull market? Maybe not yet.
Gold has set a 3 bar reversal at the $1893.0 key level of support; this offers the active trader a signal the swing low may be forming. With the commodity now trading at a 5-month low, a break of this important level will have the sellers in control. A closing price back over the $1893.0 level would signal a swing low in place.
Indicator: Relative Strength 14
The RSI turning lower below the key 50 levels but turning against the consolidating price is a positive observation; consolidation in price with a higher breakout will move the indicator higher. With the RSI is at risk of moving further back below the key 30 levels, long-term traders should continue to monitor this long-term chart for a major yearly top in progress with further declines in the long
term.

Comments from last week: Following the failure of the OPu reversal bar, the current price chart of Gold shows the breakdown below the important $1931.0 level and a “retest” of this level late in the past week. This current extended wave 5 movements can extend further to test the $1893.0 support level. Gold remains within a large consolidation zone.
SILVER
Price structure: Key melt-up failure, again.
Last week’s back retest of the $23 level set an OPu range bar with an inside range set on Friday. This is not a bullish picture with the risk of price failure back towards the $20 level. Only a solid close over the $23.0 level would indicate a swing point is developing.
Relative Strength 14:
Current Relative Strength has turned higher from the 30 level; should the RSI continue higher from here, the bullish signal will continue; the current move below the 50 levels only reflects the underlying declining price momentum that has been lost as the reading moves lower. A continuing move below the 30 levels and lower will remain a very bearish signal in the longer term. However, it should be noted the indicator is very close to moving higher from this key level.

Comments from last week: The chart of Silver still does not show a reversal bar in this current 5-wave decline, with $22.10 being the next lower support level. The Daily ranges are becoming relatively shorter, indicating sellers are beginning to tire.
AUSTRALIAN VOLATILITY INDEX: The equities traders compass.
The current volatility closing value has returned to the important mid-13- 11 level following a wide-range week. While volatility remains at this level, overall equities sentiment remains supportive for the bullish; however, with forward pricing of PUT options increasing, the underlying price volatility may turn bearish.
Lower consolidating commodities prices and bearish consolidation of equity prices is indicated when the reading moves above the 13 levels.
For continued support of equities, the XVI should remain subdued below the “13” level.
The cost of 3-month forward PUT options is decreasing from recent elevated levels.
The XVI is the difference between the 3-month forward pricing of ETO Options against the current month.
As markets anticipate events, the forward-priced option volatility changes; hence as forward price changes, this “skew” in pricing is measured in this XVI.
The XVI value works as an inverse observation of the underlying market.


 Access +10,000 financial
instruments
Access +10,000 financial
instruments