
XJO WEEKLY
Price structure: Weak advance.
And advance during the week with the close well off the high shows a lack of commitment from the Bullish side. The current Weekly closing price remains within the larger range between support at 6930 and resistance of 7370. The index remains in a downward movement. A weekly close over 7200 is required to offer a bullish view with the potential to retest the 7370 level on any continuation of the current move.
Indicator: Relative Strength 14
Relative Strength has remained below the 50 level again as part of the overall directional decline in price. With the indicator turning sideways, only further movements over the key 50 level towards the 70 level will remain a bullish signal for further gains, a continued move below this important level would signal further Bearish momentum as sentiment currently remains weak.
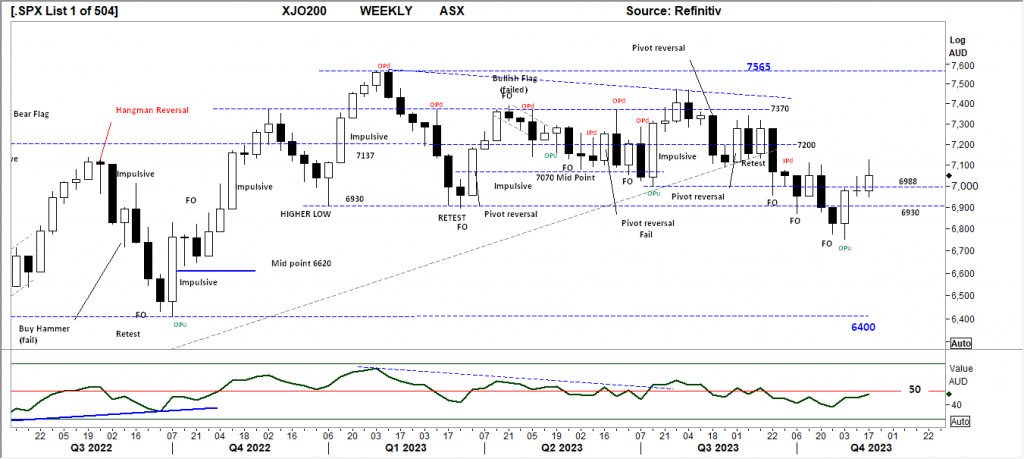
Comments last week: Last week the XJO closed in “balance” following a rise earlier in the week, this remains a bullish signal flowing the Pivot point from the week prior. This week an immediate rise in the Index could be expected. A closing price over the 6988 level would remain bullish with the 7200 level remaining as resistance in the short term. Although too early on a seasonal basis for a Christmas rally, traders
should monitor the indices for a rally to retest the high (7045) of last week.
XJO DAILY
Price structure: Consolidation below the 200-day moving average
The Daily view of the XJO200 again sets resistance at the 7090-7100 level. The Daily movements are beginning to “trend” with the higher low set earlier in the week. Friday’s small range bar is bullish for a recovery over the 7090 level. Trends start in smaller time frames, in this case with the Daily setting a higher low and a new high the Daily movement has entered an Up trend.
Indicator: Relative Strength 14
The Relative Strength Indicator (14) has turned lower into the close on Friday, as the Relative Strength Indicator moves above the 50 level, only offering a bullish indication, any reading above the key 50 level shows price momentum is positive. Traders should monitor this for further move higher on continued strength in price movements indicating an increase of bullish momentum from the current divergence signal developing.
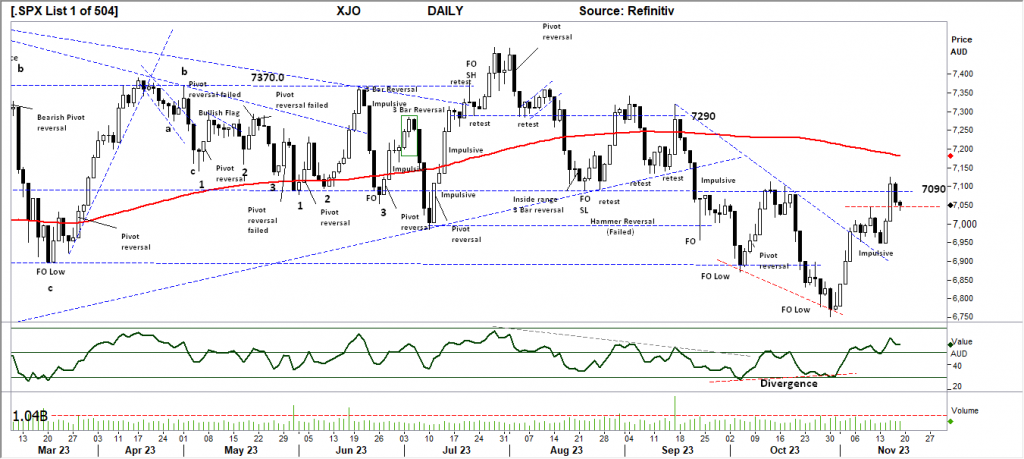
Comments last week: The DAILY overlapping price structure indicates a consolidation period underway. Last Tuesday set the low ( 6952). Traders should look for a closing price over the Weekly high of 7045 as confirmation of bullish sentiment with a further move higher in equities.
S&P 500 WEEKLY
Price structure: 5-wave structure breakout
Last the S&P posted a strong advance to close towards the first significant resistance level of 4545. This level remains a significant transition point to cross to ultimately suggest the index will move ahead to make new highs. With the current 3-week momentum movement at risk of being an extended move, the overall market is now at a level where profit-taking may see a retracement back to the 4200 level. In the coming weeks, a close over the 4600 level would be very bullish for a further Christmas rally.
Indicator: Relative Strength Indicator 14
Relative Strength has again turned higher and moved above the 50 level, but to remain bullish the RSI should remain over the 50 level with any underlying price advances. In the coming weeks, this consolidation below the 4545 level may re-assert a bearish RSI signal as the Relative Strength Indicator turns lower.
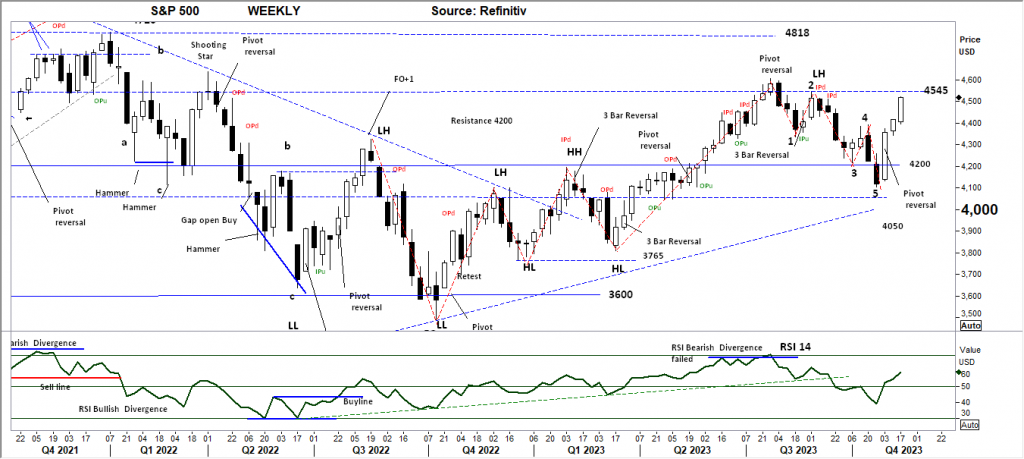
Comments from last week: From last week’s comments “The 5 wave structure is a bullish pattern only when a confirmed reversal takes place.” Last week the index confirmed the wave structure with a follow-through higher above point 4 as price movement closed on the high of the week. Resistance shown at 4545 remains in place and remains the potential price target in this current rally. A further close below the 4200 level indicates a significant loss of momentum and remains to be monitored as a very bearish signal.
SPX DAILY
Price structure: Potential Island Top
The S&P in the daily view shows a potential “Island Top” developing as momentum becomes extended following the “GAP” open. The completed movement from the pivot point low has extended the RSI. Strong resistance remains at 4600 points should the Index continue higher. The Index has a history of closing gaps, in the coming week price weakness may retest back towards the 4400 level.
Indicator: Relative Strength Indicator 14
The Relative Strength Indicator has moved into the 70 level indicating very strong momentum. Although not a signal of brought, the first movement into this level is often seen as a level to take profits.
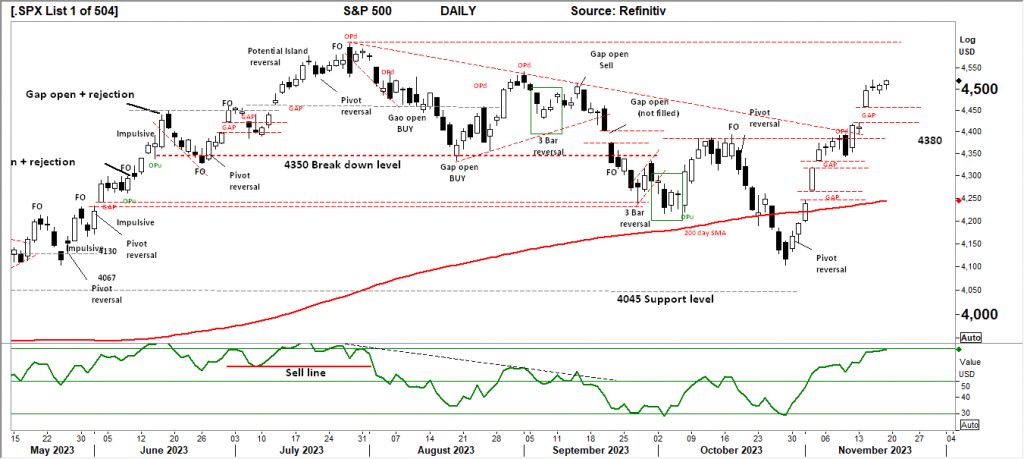
Comments from last week: It is not ideal in price structure to leave “Gaps” open, the S&P has a strong history of closing price Gaps before resuming a directional move. Two significant Gaps remain open and will remain price targets on future price weakness. Price closing above the short-term trend line is a Bullish signal for further gains. The current price movement of the past 2 weeks is “corrective” and should be monitored for a short reversal to confirm a trending move underway. The Relative Strength has moved sharply higher as price momentum recovers over the 14-day look-back period. This would now be monitored for a further rise towards the 70 level. A decline below the 50 level is a signal of a failed rally.
NASDAQ DAILY
Price structure: Short cover Rally.
As with the other Indices, the Nasdaq is displaying the potential for an Island top to develop in the coming days. The requirement is for a “GAP” down, the outcome being Buyers are left at the Island top often forcing a sharp reversal. For the Bullish view to develop, a closing price over this important 15932 level is required.
Indicator: Relative Strength 14
Relative Strength has moved higher above the 50-level into the 70 range setting a bullish signal as upward momentum comes into play. With the overall Relative strength is increasing as the underlying price movements of the Index move to new highs. The RSI should now be monitored for a further turn lower indicating a change to negative momentum.
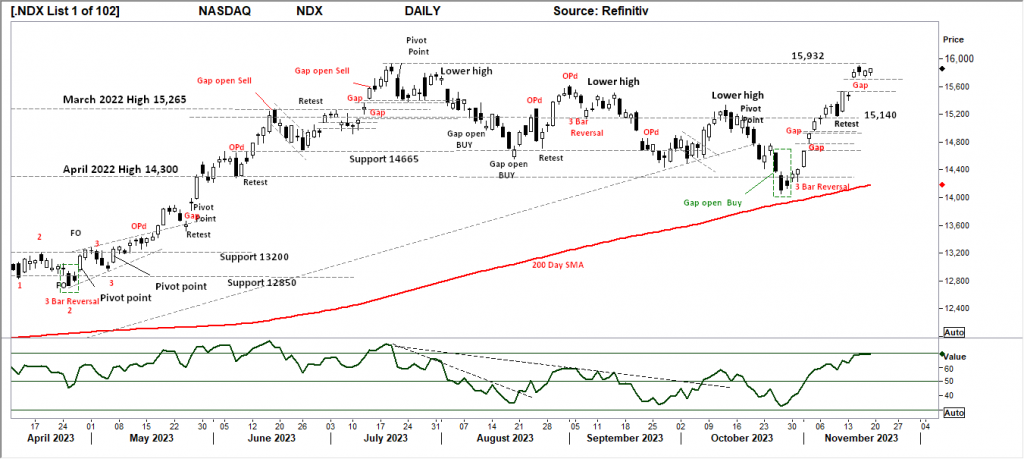
Comments from last week: The “corrective” movement in the Nasdaq has retested and rallied from the important 15,140 level, too close towards the high of the week. Like the S&P the Nasdaq has left two Gap opens without being filled, history shows the Nasdaq does not make a priority of filling lower Gaps before moving higher. With last Friday’s range being an impulsive move ( larger than recent ranges) a follow-through should be expected in the earlier part of this week.
USD Spot GOLD – DAILY: Is it a Bull market? Maybe?
With the Pivot point reversal set Gold has moved higher to retest the $1982.0 level. Last Friday set a reversal bar with the close below this important level with the potential to follow through lower. Only a price movement over the OPd high would put the metal into a Primary UP trend.
Indicator: Relative Strength 14
The RSI turning higher from below the key 70 level, turning with the rising price continues to be a positive observation, consolidation in price with a breakout higher will move the indicator higher, a Relative Strength reading over 70 indicates strong momentum. However long term traders should continue to monitor this long term Weekly chart for a 4 th major yearly top in progress with further declines in the long term.
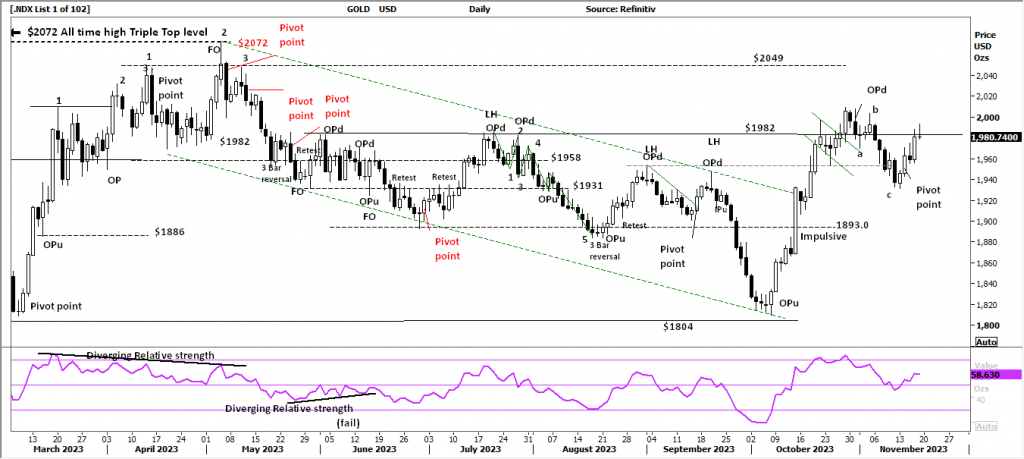
Comments from last week: The Gold price continues the a,b,c movement with the “c” wave now extended. The continued move lower to test support at $1893.0 provided context of price strength being weak. Last Fridays extended move is an impulsive move below the $1950 support level, setting a bearish implication of lower price to come.
SILVER
Price structure: Head and Shoulder pattern failing
Silver has entered a Primary move higher with the break of price above the $23.50 level (LH). The current price rejection last Thursday and Friday a signal of weakness and not to be ignored. Overall Silver remains within a large consolidation zone between support at $22.09 and resistance shown at $24.60.
Relative Strength 14
Current Relative sStrength has turned higher from below the key 50 level, if the RSI continues higher, the bullish signal will continue, only a continued movement above the 50 level reflecting a solid change in the underlying price momentum would alert to a potential new trend and breakout.
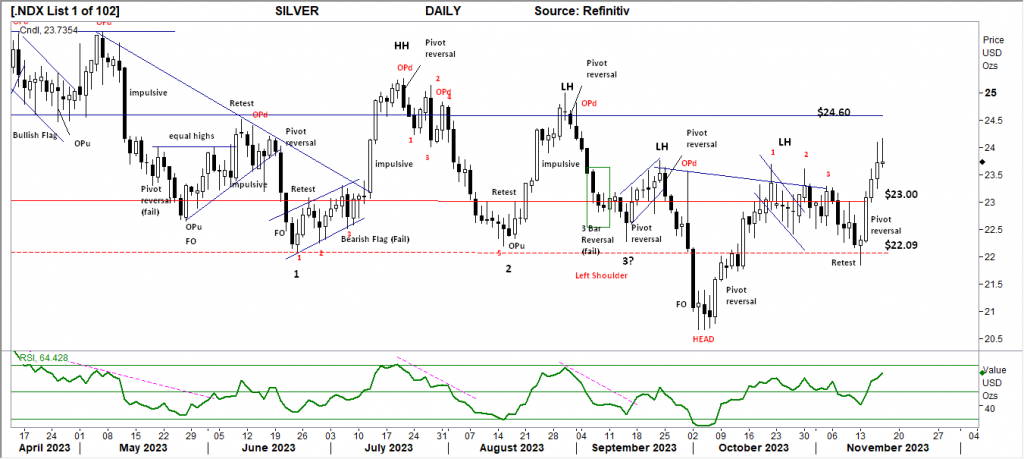
Comments from last week: The developing Head and Shoulder pattern in Silver has failed into a price decline to retest the $22.09 level. With the confirmed reversal in place, Silver has set a new Lower high in line with the current Downtrend from the May’23 highs. A further breakdown below the $22.09 level would be a break of a significant support level and imply price could retest the early October low at $20.50.
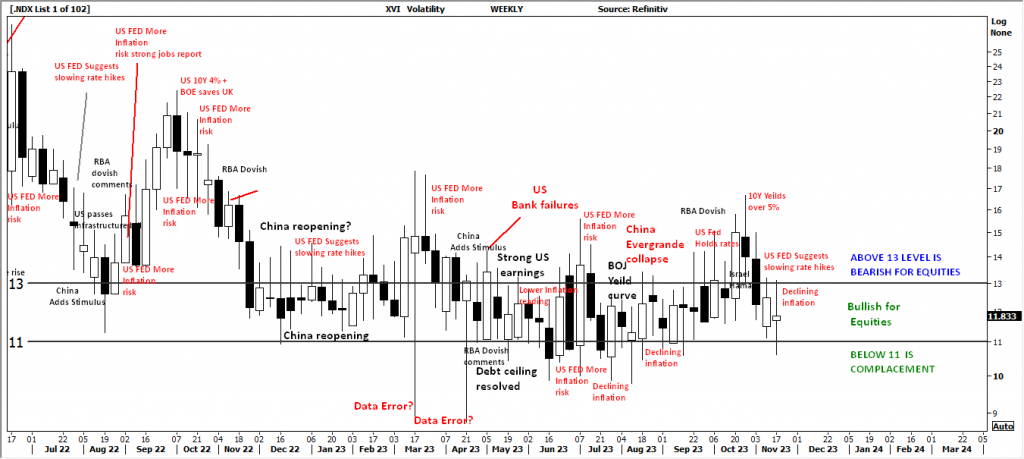
AUSTRALIAN VOLATILITY INDEX: The equities traders compass.
The current volatility closing value has remained inside of the 13 level again following another wide range week closing higher. While volatility remains at this level overall equities sentiment remains supportive for the BULLISH view, with the indicator pushing lower the forward pricing of PUT options is now decreasing, the underlying price volatility may remain bullish.
Higher to consolidating commodities prices and bullish consolidation of equity prices is indicated when the reading moves below the 13 level.
For continued support of equities, the XVI should remain subdued below the “13” level.
The cost of 3month forward PUT options is decreasing from recent elevated levels.
The XVI is the difference between 3-month forward pricing of ETO Options against current month. As markets anticipate events, the forward priced option volatility changes, hence as forward price changes, this “skew” in pricing is measured in this XVI.
The XVI value works as an inverse observation to the underlying market.


 Access +10,000 financial
instruments
Access +10,000 financial
instruments