
XJO WEEKLY
Price structure: Strong advance.
A very strong range (impulsive), closing towards the high has presented last week, some follow through should again be expected during this trading week. With the current Weekly closing price remaining within the larger range between support at 6930 and resistance of 7565, the index still remains within a downward movement. The current strong rally remains a seasonally corrective movement. A further weekly close over 7565 is required to offer a continuing bullish view.
Indicator: Relative Strength 14
Relative strength has moved above the 50 level again as part of the overall directional move higher in price. Only further movements over the key 50 level towards the 70 level will remain a bullish signal for further gains, a continued move below this important 50 level would signal further Bearish momentum as sentiment may change.
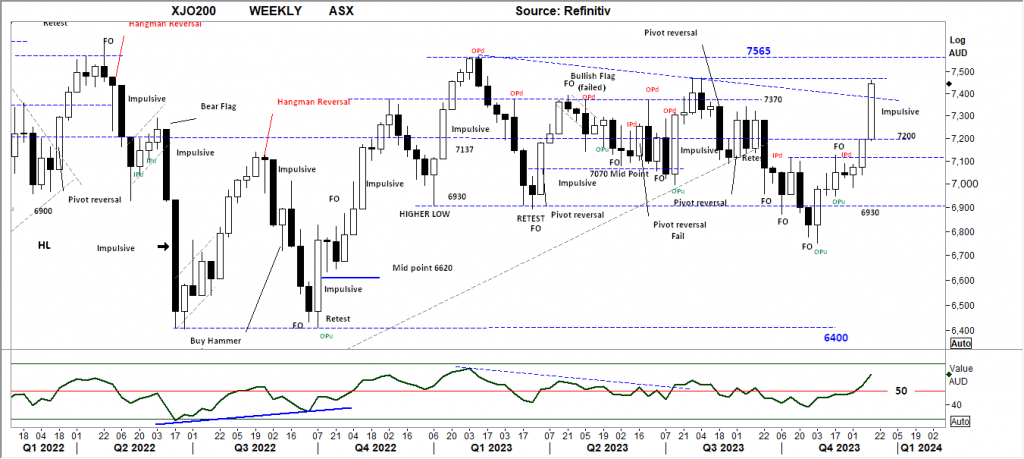
Comments last week: A strong range, closing at the high has presented last week, some follow through should be expected during this trading week.
With the current Weekly closing price remaining within the larger range between support at 6930 and resistance of 7370, the index still remains within a downward movement. A further weekly close over 7200 is required to offer a bullish view. Currently the Index has the potential to retest the 7370 level on any continuation of the current move.
XJO DAILY
Price structure: Retesting highs
The Daily price movement have now entered into an UP Trend since the October low. The current strong seasonal advance has surpassed the 7290 resistance with the Daily 7472 level now being tested. A further breakout above the 7290 level would be a significant development. With very strong volume a result of a Mid Month Options expiry, traders should be aware an exhaustion movement may be underway with the possibility of a corrective retracement back to the 7200 level.
Indicator: Relative Strength 14
The Relative strength Indicator (14) has turned higher into the close on Friday, as the Relative strength indicator continues to move above the 70 level, offering a strong bullish indication, any reading above the key 50 level shows price momentum is positive within the look back period of 14 days. Traders should monitor this for a further move higher on continued strength in price movements indicating an increase of bullish momentum from the October divergence signal.
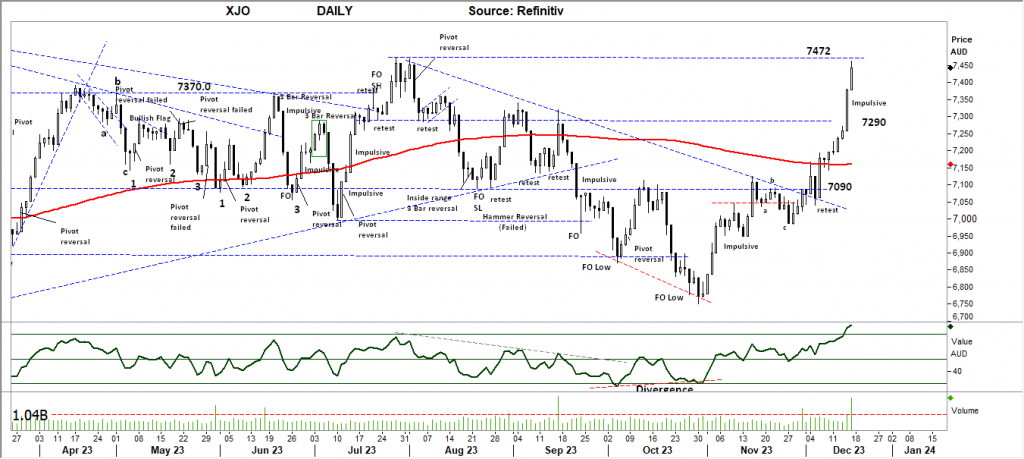
Comments last week: The XJO200 has again reclaimed the 200 day moving average, following the break above the 7090 level, significant Daily resistance levels remain, however the outside range set last Friday should follow through to the 7290 level. The Daily price movement have now entered into an UP Trend since the October low.
S&P 500 WEEKLY
Price structure: 5 wave structure breakout continues
The lndex closing towards the highs of Q3 2023 and moving towards retesting the 2022 highs remains a very positive signal for a push to a new all-time high.
The 5-week momentum movement still remains at risk of now being an “over extended seasonal move”, the overall market remains at a level where profit taking may see a retracement back to the 4545 level and lower. In the current momentum move a further close over the 4800 level would be very bullish for a retest of the 4818 level and a further Christmas rally.
Indicator: Relative Strength Indicator 14
Relative strength has again turned higher and moves above the 50 level, but to remain bullish the RSI should remain over the 50 level with any underlying price advances. In the coming weeks this consolidation below the 4545 level may re-assert a bearish RSI signal as the Relative strength indicator turns lower.

Comments from last week: The lndex closing towards the highs of Q3 2023 and moving towards retesting the 2022 highs remains a very positive signal for a push to an all-time high.
The 4-week momentum movement remains at risk of now being an “over extended move”, the overall market is at a level where profit taking may see a retracement back to the 4545 level and lower. In the coming weeks a further close over the 4600 level would be very bullish for a retest of the 4818 level and a further Christmas rally
SPX DAILY
Price structure: In balance.
The small consolidation area currently forming, may show as a further breakout to test towards the 4818 level. A close below the 4600 level would be the first indication of profit taking. Traders can monitor this chart for reversal patterns in the form of an outside range down close (OPd) or a basic Pivot reversal pattern that would indicate a short term reversal. The move from the October low remains “corrective”. Further higher closes are required for true momentum breakout signal to occur.
Indicator: Relative Strength Indicator 14
Relative strength Indicator has moved into the 70 level indicating very strong momentum. Although not a signal of over brought, the current second and third movement into this over 70 level is often seen as a level to take profits.

Comments from last week: Closing price from last Friday indicates a breakout from the small “Diamond” pattern with price closing at 4606 level, this short-term view should be monitored for a reversal. A close below the 4600 level would be the first indication of profit taking. Traders can monitor this chart for reversal patterns in the form of an outside range down close (OPd) or a basic Pivot reversal pattern. The move from the October low remains “corrective”. Further higher closes are required for true breakout signal to occur.
NASDAQ DAILY
Price structure: Strong momentum.
Many unfilled Gaps remain in the current Nasdaq price advance from the October low. The Index has set a further “Gap open sell” signal, that remains a precursor signal to a price reversal should current price movement close back into this area.
Indicator: Relative Strength 14
Relative strength has again moved to the 70 range, although not an “over-brought” signal it remains an area to monitor for and exhaustion reversal..
The observance is the overall Relative strength is again rising as the underlying price movements of the Index move to set closing price highs. The RSI should now be monitored for a further turn lower indicating a change to negative momentum.
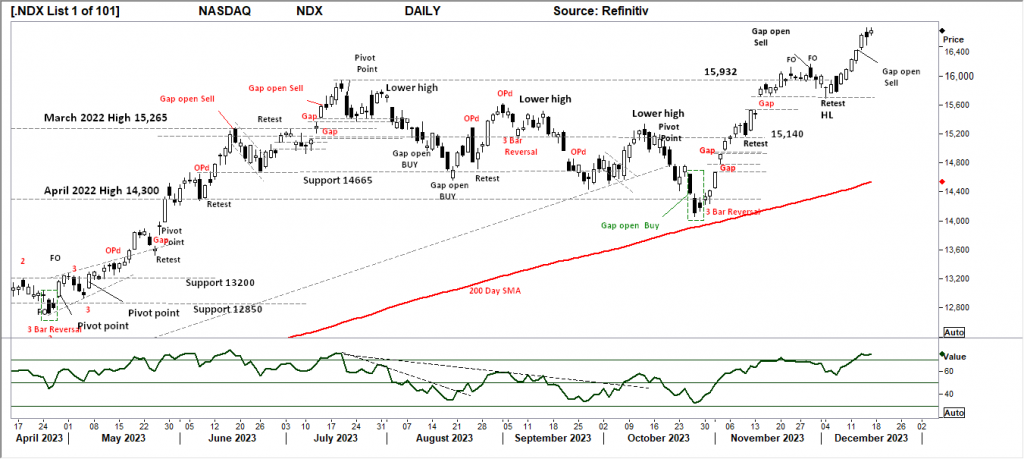
Comments from last week: Many unfilled Gaps remain in the current Nasdaq price advance from the October low. The retest of the “Gap” area followed with a strong close last Friday the late November high is being challenged, a close over the 16,100 level would be a very Bullish signal from this clear breakout. A further close lower into the “Gap” would signal a bearish breakdown with the potential to move towards the 200 SMA.
USD Spot GOLD – DAILY: Bull Trap at the 4th High
Gold has again tested the $2049 level with a strong rally, that was immediately rejected to force the closing price below the $2049 new resistance level. The current short term trendline has been broken with the current close. The potential remains for a retest lower below the key $1982.0 level to $1960.0 The underlying Primary trend is yet to be established, only a close over the $2072 level will give strong indication of a new bull market underway.
Indicator: Relative Strength 14
The RSI turning lower from below the key 70 level, turning with the falling price, recent consolidation in price with a breakout lower will move the indicator lower, a Relative strength reading below 50 indicates bearish momentum. Long term traders should continue to monitor this long term Daily chart for a 4th major yearly top in progress at $2072.0 with further declines in the long term.

Comments from last week: Gold has again tested the $2072 level with a strong rally, that was immediately rejected (OPd) to force the closing price below the $2049 support /resistance level. The current short term trendline has been broken with the current close below the key $2,000 level. The potential remains for a retest lower below the key $1982.0 level to $1960.0 The underlying Primary trend is yet to be established
SILVER
Price structure: Head and Shoulder neckline retest remains.
Strong rejection (OPd) from below the $24.60 level to see an engulfing reversal decline towards the Head and shoulder neckline at $23.0.
Silver remains within a broad trading range between $22.09 support and $26.20 resistance with no identifiable Primary trend. Last Wednesdays “impulsive range” is a strong reversal signal with the short term potential for a retest towards $24.60.
Relative Strength 14
Current Relative strength has turned higher from below the 50 level to move sideways at this level, indicating momentum has turned neutral, if the RSI continues lower, the bearish momentum signal will show a continued price movement lower. Only a continued move higher would reflect a solid change in the underlying price momentum would alert to a potential new trend and breakout.
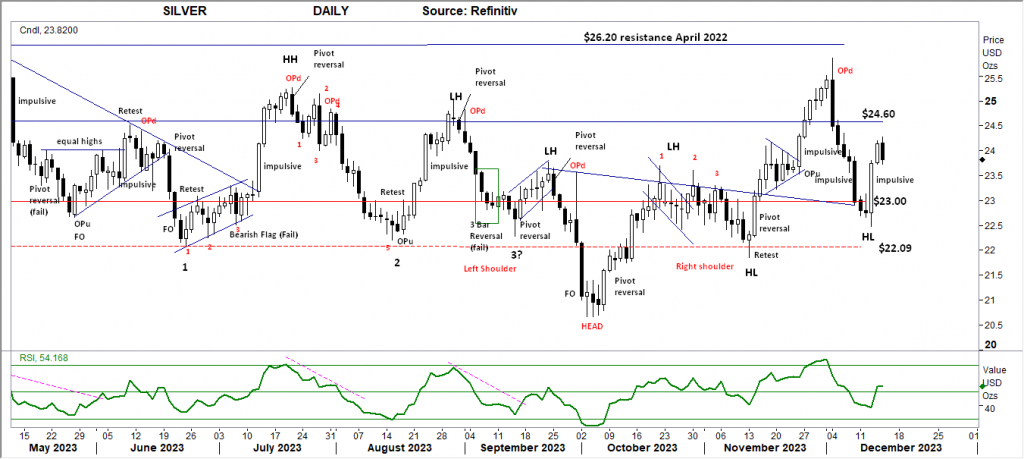
Comments from last week:
Strong rejection (OPd) from below the $26.20 level to see a 10% price decline towards the Head and shoulder neckline at $23.0.
Silver remains within a broad trading range between $22.09 support and $26.20 resistance with no identifiable Primary trend. Last Friday’s “impulsive range” is a further bearish signal with the short term potential for a retest towards $22.09.
AUSTRALIAN VOLATILITY INDEX: The equities traders compass.
The current volatility closing value has moved below the 13 level closing lower the XVI is now within the “complacement” level. This is the lowest level for several years and may lead to higher volatility (declining equities prices) on a rise in the indicator. While volatility remains at this level overall equities sentiment remains supportive for the BULLISH view, with the indicator pushing lower the forward pricing of PUT options is now decreasing, the underlying price movements may remain bullish.
Higher to consolidating commodities prices and bullish consolidation of equity prices is indicated when the reading moves below the 13 level.
For continued support of equities, the XVI should remain subdued below the “13” level.
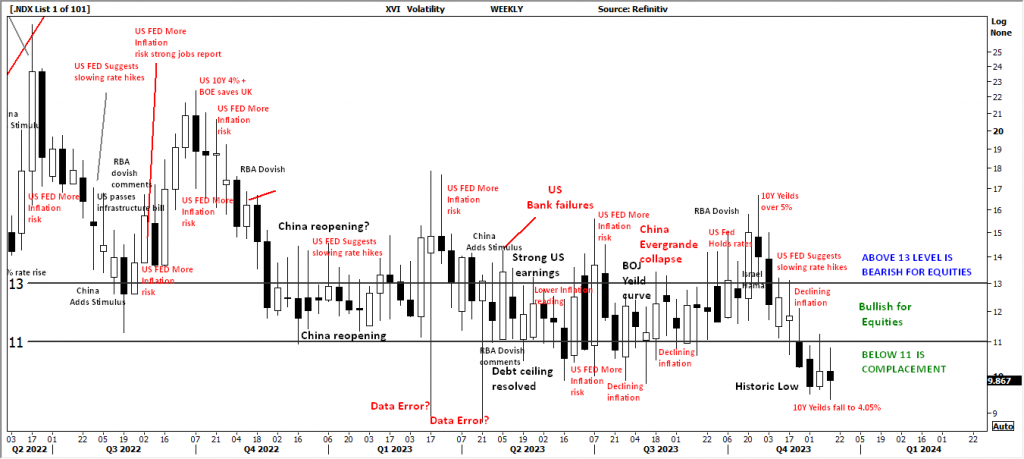
The XVI is the difference between 3-month forward pricing of ETO Options against current month. As markets anticipate events, the forward priced option volatility changes, hence as forward price changes, this “skew” in pricing is measured in this XVI. The XVI value works as an inverse observation to the underlying market.


 Access +10,000 financial
instruments
Access +10,000 financial
instruments