
XJO WEEKLY
Price structure: Overall, the view remains Bullish
A bullish reversal last week will set the stage for a further move higher; the first resistance level of 7370 may provide some initial resistance and will remain the first support level should the market move over this level. The second key observation is the current trendline provided some support last week. The Index remains within a large consolidation area with 6930 as support and 7565 as resistance.
Indicator: Relative Strength 14
Relative Strength has moved above the 50 level (just) as part of the overall change in momentum. Two weeks ago again it turned slightly lower at this important level. Only further movements over the key 50 level towards the 70 level will remain a bullish signal for further gains; a continued move below this important level would signal further Bearish momentum as sentiment currently remains mildly bearish. A cross above the 50 is a bullish signal.

Comments last week: Last week saw a higher low and higher high against the previous week, however, the solid close below the 7200 level is a further bearish signal. With extended consolidation remaining the overall technical view. With the closing value in the lower 20% of the overall range, the initial outlook is for a bullish reversal, a close over the 7200 level and would remain as a bullish reversal signal.
XJO DAILY
Price structure: Early Bullish signal.
Price consolidation at the Trendline was followed by a strong move higher late in the week, only to close below the 7290 Daily resistance level. The current closing price above the 200-day moving average is a positive development. To remain bullish, an immediate close above the 7290 level is required early this week for sentiment to remain positive. The large volume set on Friday is attached to the quarterly Index rollover.
Indicator: Relative Strength 14
The Relative Strength Indicator (14) turned higher, and the Relative Strength Indicator remains above the 50 level, and any reading above the key 50 level shows price momentum is positive. Traders should monitor this for a further move higher on continued strength in price movements indicating an increase of bullish momentum.

Comments last week: The low volume reversal bar set on Friday (8th) indicates the market is not in a bearish phase, only that buyer sentiment is poor. With the market remaining above the late August low but below the 200-day moving average, a breakout lower would see further selling as the swing buyers are forced into a Stop-loss sell. Conversely, a follow-through swing higher would see the short positions closed on Stops. Small range swings, as shown over the past 6 months, can be frustrating for traders, and traders should be aware the breakout will be volatile.
S&P 500 WEEKLY
Price structure: Potential Lower high.
The S&P remains below the 4545 resistance level, with two inside-down (IPd) close weeks displayed. For the underlying sentiment to turn Bullish, a close over the 4545 level is required. The past 2 weeks are small range movements indicating that neither the sellers nor buyers are in control; this type of consolidation may result in a volatile breakout. The Primary trend remains UP until the recent low of 5 weeks ago is broken.
Indicator: Relative Strength Indicator 14
Relative Strength has again turned lower from the key 70 level, but to remain bullish, the RSI should continue to turn higher and remain over the 50 level with further underlying price advances. The RSI rollover of the last 7 weeks indicates slowing momentum with a clear bearish divergence signal that has failed in this extended price move. In the coming weeks, this consolidation below the 4545 level may re-assert a bearish divergence signal.
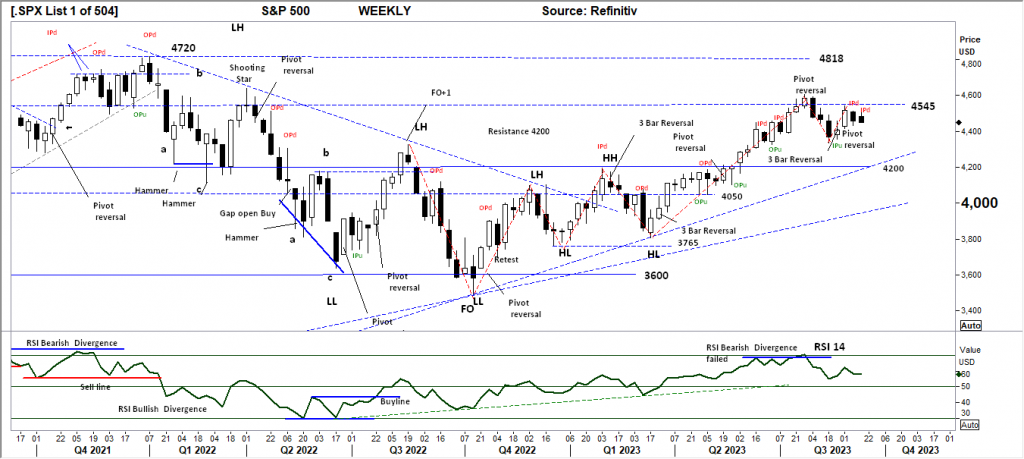
Comments from last week: An inside week (IPd) showing the market remains balanced. The 4545 level also remains a considerable resistance; currently, the S&P Indices risk posting a “lower high” below this important level. A further breakdown below the 4300 level would confirm a bearish trend in the Index.
S&P 500 DAILY
Price structure: Looking for a continuation higher.
Failure of the 3 Bar reversal pattern discussed last week to signal a reversal has only resulted in a sideways consolidation pattern. The full pattern is starting to develop into a continuation pennant; a breakout higher should be expected; confirmation will be when the price closes over the 4500 level. Failure of price below the pennant will target the 200-day moving average.
Indicator: Relative Strength 14
Relative Strength is pushing towards the 50 level again as momentum changes. For further price strength in this index, the RSI move has to be higher to sideways, remaining above the key 50 level. Should the RSI continue to move below the key 50 level, bearish price momentum may continue to play out in the coming weeks.
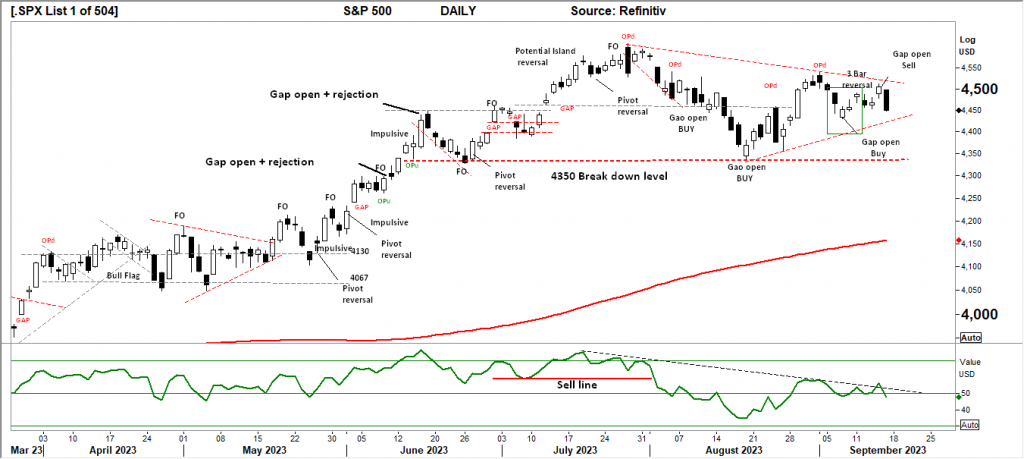
Comments from last week: Within the short-term view of the Daily chart, the 3 bar reversal pattern can set a bullish tone over the next week; only a closing price over the OPd high (4550) would give a bullish signal. Further consolidation above the 4350 level seems to be in play. A price breakdown below this important level would send a very Bearish signal to traders that a Major top that has developed since June would now be in place. Consolidation is an important sequence in the development of Bull markets as the weaker sellers move out of the market to make way for the longer-term buyers; 4350 is a very important level.
NASDAQ DAILY
Price structure: Potential distribution top.
Trendline support is being tested, with last Friday close towards the 15,140 level. The underlying Primary trend remains UP. A further close below the 14,665 level is required to change the underlying Primary trend. Some discussion has centred around the potential development of a large Head and Shoulder pattern beginning in June 2023; should the price break below the 14,665 level, this will be confirmed.
Indicator: Relative Strength 14
Relative Strength has moved lower to the 50-level, setting a bullish signal as momentum changes from down to up. The Relative Strength increases as the underlying price movements of higher closing highs and higher lows occur. No divergence is shown at this stage but should now be monitored for a further reversal turn lower, indicating a loss of momentum.
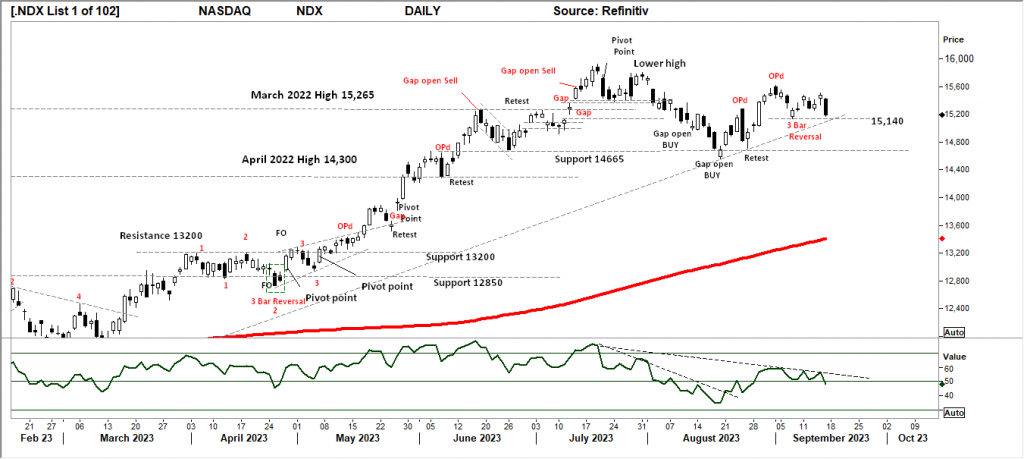
Comments from last week: With the OPd discussed last week playing out into lower prices, the “gap open” from last Thursday and Friday’s range has set a 3-bar reversal pattern, indicating a short-term “swing low” may be in place, the first price target higher is the recent high at 15,600. This view will be negated with a closing price below the 15,140 point low of last Thursday’s Gap open bar.
USD Spot GOLD – DAILY: Is it a Bull market? Maybe not yet.
USD Gold has set a higher low (HL) above the $1893 support level with last Friday’s movement above the flag resistance line; this is a very positive start to a potential new trend movement. The first congestion area ranges from $1931.0 to $1958.0, with $1982.0 as the remaining major resistance level to overcome. A change in the Primary trend direction close above the $1960 level is required.
Indicator: Relative Strength 14
The RSI turning higher above the key 50 levels, turning with the rising price, continues to be a positive observation; consolidation in price with a higher breakout will move the indicator higher. However, long-term traders should continue to monitor this long-term Weekly chart for a major yearly top in progress with further declines in the long term.
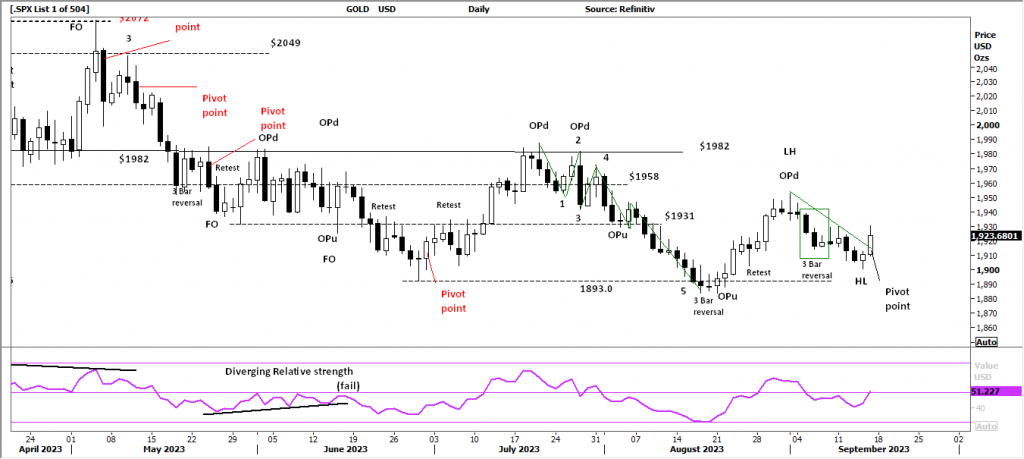
Comments from last week: USD Gold continues its Daily downtrend, with the recent OPd marking the latest lower high. A further movement below the $1880 level will confirm the continuation of the trend. In the short term, a 3-bar reversal shows the potential for the price to move higher; in this daily view, a price close below the recent low of $1914.0 will negate the 3-bar reversal pattern.
SILVER
Price structure: Reversal at support underway
Silver produced a Bullish reversal bar in trading last Friday however the close remains subjective as the price remains at the $23.0 resistance level. The price chart now confirms 3 major low points along the $22.10 level as the price channel continues to develop.
Relative Strength 14
Current Relative Strength has turned higher from below the 50 level; if the RSI continues higher, the bullish signal will continue with a move to and above the 50 level, reflecting a solid change in the underlying price momentum. With the continuing move towards the 50 level and higher remaining a very bullish signal in the shorter term, however, it should be noted the indicator is very close to moving back towards the 30 level as bullish momentum remains subdued.

Comments from last week: Like the Indices, Silver displayed a 3-bar reversal pattern at the close of last week. With the current price decline now finding support at the $23.0 level, the commodity is continuing to trade within a large consolidation area. The potential for a price reversal higher at this level only sets a target of the last resistance level of $24.60.
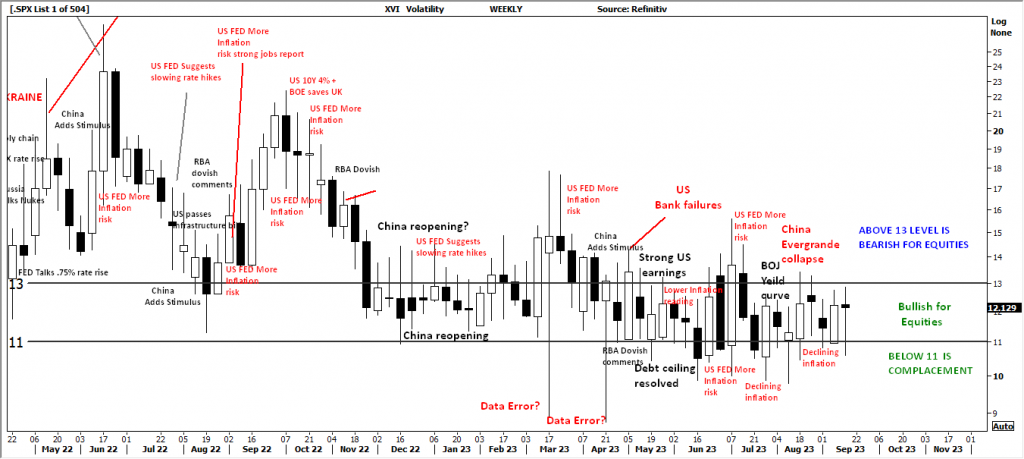
AUSTRALIAN VOLATILITY INDEX: The equities traders compass.
The current volatility closing value has returned to the important mid-13- 11 level again following a wide-range week. While volatility remains at this level, overall equities sentiment remains supportive for the bullish; however, with forward pricing of PUT options increasing, the underlying price volatility may turn bearish.
Lower consolidating commodities prices and bearish consolidation of equity prices are indicated when the reading moves above the 13 level.
For continued support of equities, the XVI should remain subdued below the “13” level.
The cost of 3-month forward PUT options is decreasing from recent elevated levels.
The XVI is the difference between the 3-month forward pricing of ETO Options against the current month.
As markets anticipate events, the forward-priced option volatility changes; hence, as forward price changes, this “skew” in pricing is measured in this XVI.
The XVI value works as an inverse observation of the underlying market.


 Access +10,000 financial
instruments
Access +10,000 financial
instruments