
XJO WEEKLY
Price structure: Bullish Consolidation
The week in balance is below the 7565 level without a retest towards the 7200 level. Further consolidation would be expected without an economic driver to influence market buying or selling. Consolidation in the form of a developing Bullish flag pattern in this “high place” remains bullish for further gains only on a close above the 7632 level. Seasonally January can set the tone for the coming year. The Bullish impulsive movement set 5 weeks back remains the dominant feature in this Weekly view.
Indicator: Relative Strength 14
Relative Strength has moved above the 50 level again as part of the overall directional move higher in price. Only further movements towards the 70 level will remain a bullish signal for further gains, last week the RSI value moved lower a continued move below this important level to the 50 level would signal further Bearish momentum as sentiment may change.
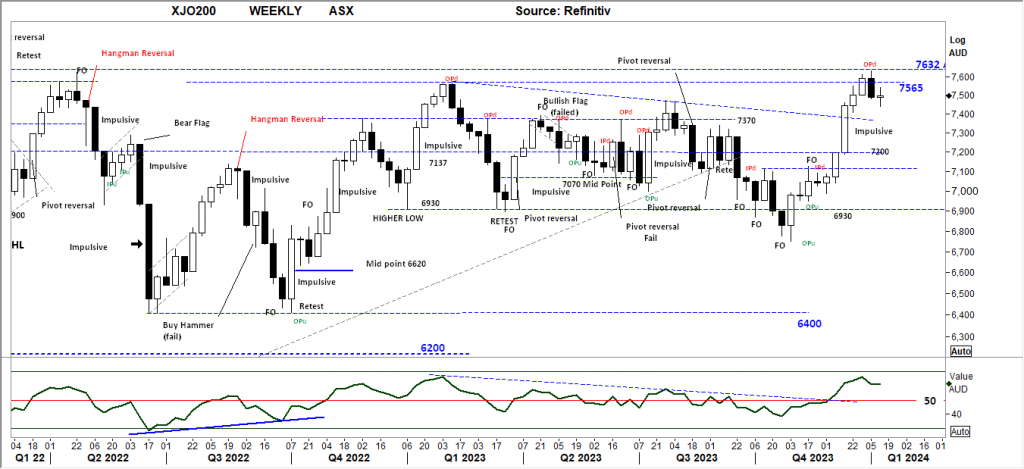
Comments last week: Following the fluid movement up of the past 4 weeks the key reversal bar in the form of an OPd (outside period) has started rejection from the all-time high level of 7632.0 points. The immediate expectation is for a retest of the 7200 level as a key activity and psychological level to hold. Retracements are part of the underlying trending action, a retracement at this level would set the Index for a push higher to new all-time highs in the coming months.
XJO DAILY
Price structure: Extended move ends in consolidation.
The Daily price structure of the current Pennant pattern importantly has formed above the 7472 level. The Daily chart suggests a move lower to complete the Pennant pattern, potentially towards the 7290 level. The mixture of UP close and DOWN close highlights the indecision of the market. A further short-term decline should be expected. Within the equities market, a “buy the dip” scenario should be presented.
Indicator: Relative Strength 14
The Relative Strength Indicator (14) has turned flat into the close on Friday, as the Relative Strength Indicator continues to move below the 70-level following the sell divergence signal discussed 2 weeks ago and remains in play this week. 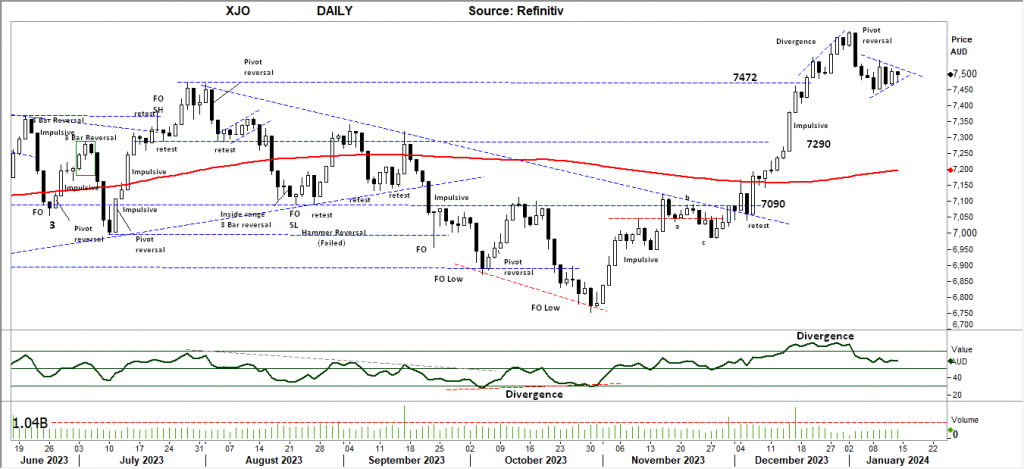
Comments last week: With a “Pivot reversal” in place the immediate support level of 7472 has provided some consolidation, with last Friday setting an inside day, as the market comes into balance. A break on either side of the small range will give some direction in the early part of this week. Follow-through lower should be expected from the large range “Pivot” bar.
S&P 500 WEEKLY
Price structure: breakout meets resistance level.
The immediate Pivot reversal setting a new intra-week high, sets a very bullish tone for this week with follow-through expected to take the Index past the all-time high of 4818 in an immediate short-covering rally. Price failure from this level would be a significant event with the potential to retest the 4545 level a strong possibility. A close below the 4700 level would offer that possibility.
Indicator: Relative Strength Indicator 14
Relative Strength has again turned higher and moves below the 70 level towards the 70 level, but to give a strong momentum signal the RSI should move over the 70 level with any underlying price advances. In the coming weeks, this consolidation towards the 4545 level may re-assert a bearish RSI signal as the Relative strength indicator turns lower below the 50 level.
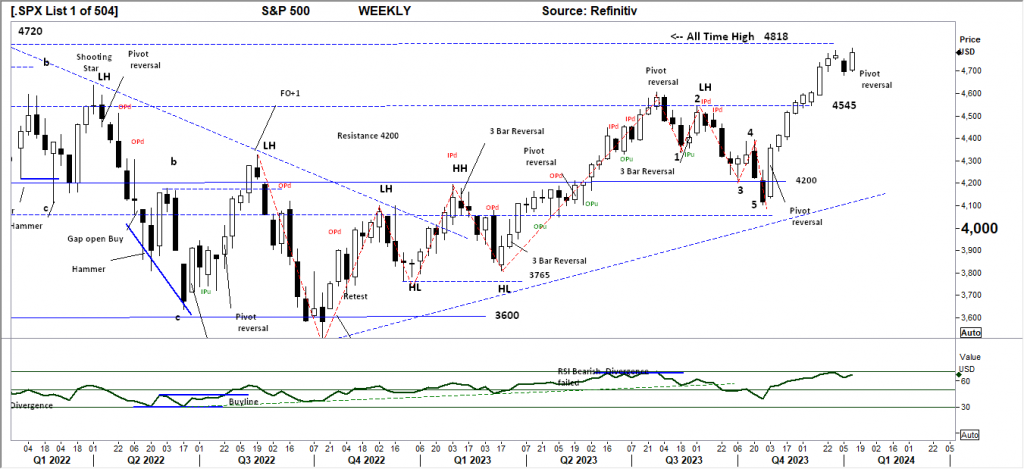
Comments from last week: Resistance at the all-time high level has given way and set a reversal Pivot point, now setting the precursor for lower prices in the week ahead. With a retest of the 4545 level a strong possibility, the 4545 level providing some form of support in the coming days would be very bullish for a breakout over the 4818 level in the coming weeks.
SPX DAILY
Price structure: Sell divergence complete.
The Daily pivot reversal bar has set the market and a retest of the highs, the current OPd (outside period d) has a very high probability of marking the current 2nd high at this level below the 4800 mark. The underlying Daily trend is UP with strong support developing at 4700 points. It remains, that the chart has several unresolved “open gaps” towards the 4,400 level and below.
Indicator: Relative Strength Indicator 14
The Relative Strength Indicator has moved below the 70 level indicating weakening momentum. Although not a signal of overbrought, the current second and third movement into this over 70 level is often seen as a level to take profits. The Sell divergence signal continues to be displayed and completed with the market setting a new closing price high as the indicator sets a lower high.
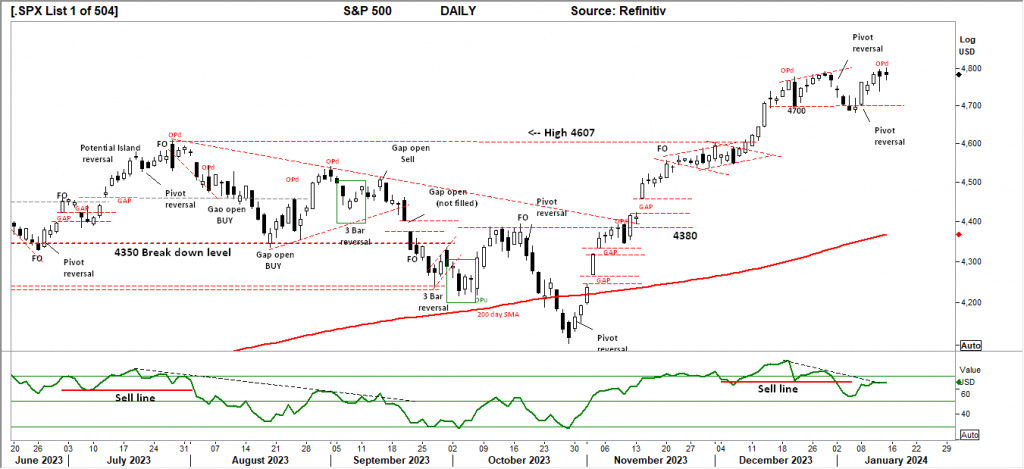
Comments from last week: Within the daily view some support is being provided at 4700, with the upper shadows of last Thursday and Friday, a breakdown lower should be expected to retest towards the 4607 level as the next support. The underlying trend and price structure remain bullish. It remains the chart has several unresolved “open gaps” towards the 4,400 level and below.
NASDAQ DAILY
Price structure: Potential lower top.
The price rally last week fell short of taking out the Pivot Point high set 2 weeks ago. This sets a further divergence with the S&P500 setting a new intra-week high. The underlying Primary trend is UP however this is a potential lower high being set with the Outside range with a 94% probability of the high in place last Thursday. Last Friday’s small range bar indicates the market in balance.
Indicator: Relative Strength 14
Relative Strength has again moved towards the 50 range, it remains an area to monitor for further exhaustion reversal. The observance is the overall Relative strength is again falling as the underlying price movements of the Index move to set closing price lows. The RSI should now be monitored for a further turn lower indicating a change to negative momentum and completion of the divergence sell signal indicating a major top in place.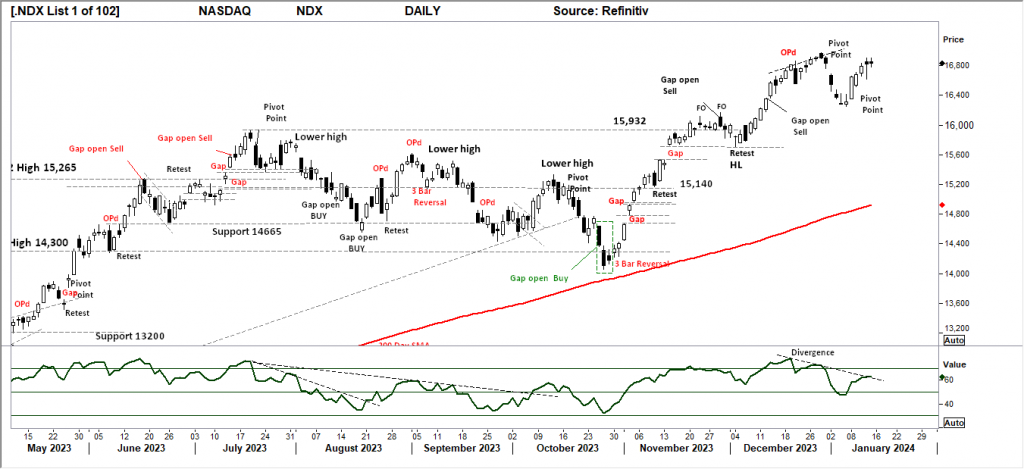
Comments from last week: The follow-through from the Pivot point towards the 16,300 level has not been a decisive movement with some overlapping price ranges. Further consolidation above the 16,000 level would be a very bullish signal for the current rally from the October 2023 low to continue higher. The underlying Primary trend remains UP.
USD Spot GOLD – DAILY: Bull Trap at the 5th High?
A new bullish pivot setting the current “higher low” at $2020. The resistance level of $2049 continues to work against the current movement. As Gold is trading towards the all-time high price of $2072, the current higher low development is bullish for further gains. Weakness in price will be seen should the current $2020 support level fail to hold any retracement in price. Gold remains within a significant trading range.
Indicator: Relative Strength 14
The RSI turned lower from below the key 70 level to the 50 level, again turning higher with the rising price, current consolidation in price with a breakout higher will move the indicator higher towards the 70 level, a Relative Strength reading below 50 indicates bearish momentum. Long-term traders should continue to monitor this long-term Daily chart for a 5th major yearly top in progress at the $2072.0 level with further declines in the long term.
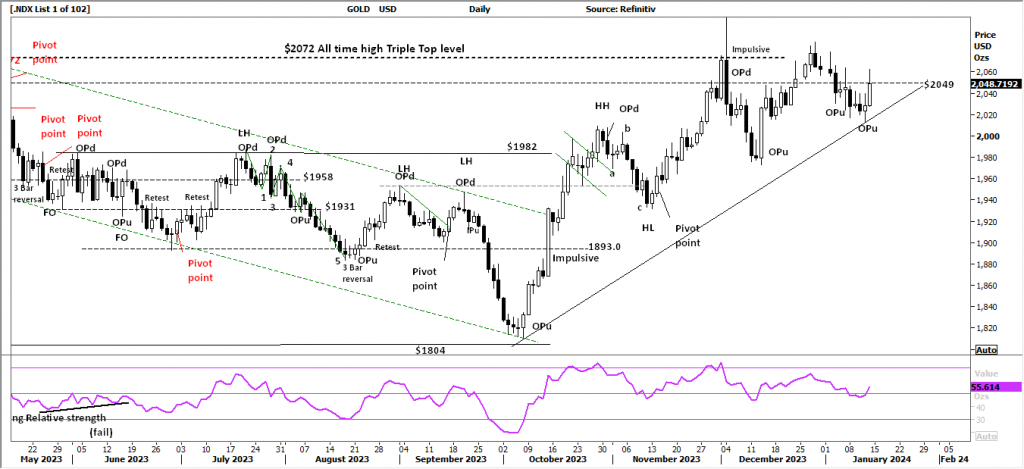
Comments from last week: The current retest of the short-term trend line is a strong indication the current UP trend is intact with a potential retest of the impulsive high set in late November 2023. Last Friday set an OPu range which remains a bullish signal of support for the underlying trend. A further break of this short-term trendline would send a bearish signal to short-term traders for a retest of the $1982.0 level again.
SILVER
Price structure: No trend
Silver set an important “Pivot Point” above the key support level of $22.50. Rejection at the end of Friday saw the closing price well down in the Daily range. Silver remains within a well-defined trading range between $22.50 support and $24.60 resistance. No underlying trend is identified.
Relative Strength 14
Current Relative Strength has turned higher from below the 50 level to move sideways at this level, indicating momentum has turned neutral, if the RSI continues lower, the bearish momentum signal will show a continued price movement lower. Only a continued move higher would reflect a solid change in the underlying price momentum and would alert to a potential new trend and breakout.
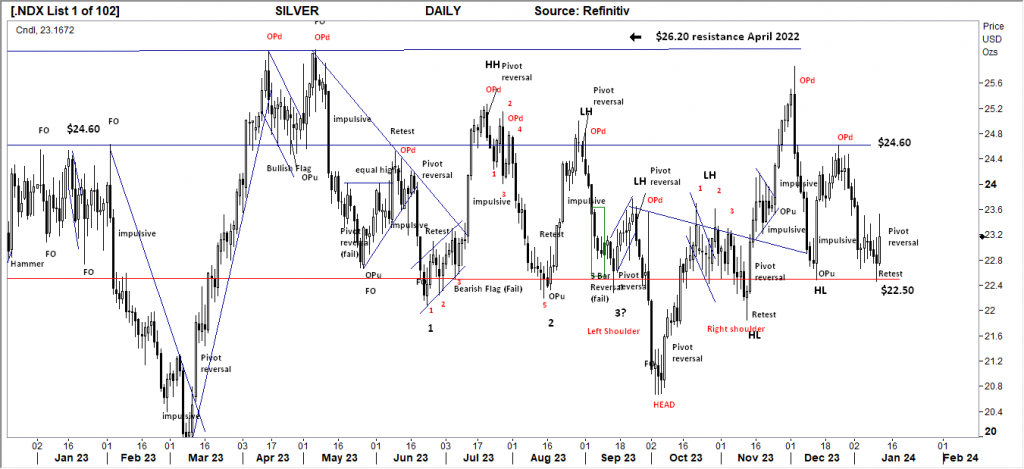
Comments from last week: Silver again retests the $23.0 level with some indecision bars set last Thursday and Friday. This pattern is a Bearish consolidation with the potential for a price move lower towards the $22.09 level. Silver remains within a large consolidation zone below $26.40 and above $22.09.
AUSTRALIAN VOLATILITY INDEX: The equities traders compass.
The current volatility closing value has moved to below the 11 levels, closing lower than the XVI is within the “complacent” level.
With the indicator now moving lower the forward pricing of PUT options is now decreasing, this is observed against a rising market indicating equity price movements may turn further bullish as the cost of 3-month (insurance) Put Options is decreasing (less demand).
For continued support of equities, the XVI should remain subdued below the “13” level.
The cost of 3-month forward PUT options is decreasing from recent elevated levels.
The XVI is the difference between the 3-month forward pricing of ETO Options against the current month.
As markets anticipate events, the forward-priced option volatility changes, hence as forward price changes, this “skew” in pricing is measured in this XVI.
The XVI value works as an inverse observation of the underlying market.


 Access +10,000 financial
instruments
Access +10,000 financial
instruments