
XJO WEEKLY
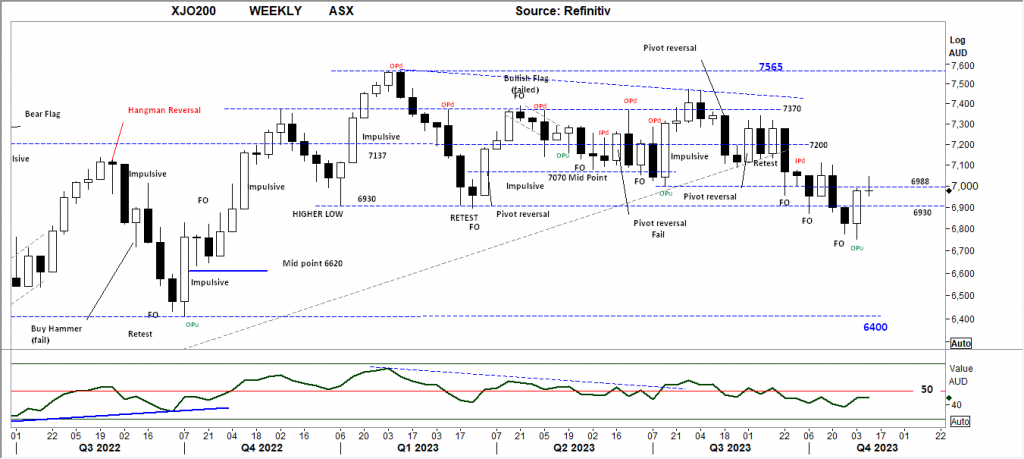
Price structure: Balance following a Bullish Outside range.
Last week the XJO closed in “balance” following a rise earlier in the week, this remains a bullish signal flowing the Pivot point from the week prior. This week an immediate rise in the Index could be expected. A closing price over the 6988 level would remain bullish with the 7200 level remaining as resistance in the short term. Although too early on a seasonal basis for a Christmas rally, traders should monitor the indices for a rally to retest the high (7045) of last week.
Indicator: Relative Strength 14
Relative Strength has moved below the 50 level again as part of the overall directional decline price. With the indicator turning sideways, only further movements over the key 50 level towards the 70 level will remain a bullish signal for further gains, a continued move below this important level would signal further Bearish momentum as sentiment currently remains weak.
Comments last week: From a very Bearish view on the break of a major support level, the Index has posted a Bullish outside range up close (OPu). With the close currently at an important resistance level, the price direction this week will be the driver for the coming weeks. Although too early on a seasonal basis for a Christmas rally, traders should monitor the indices for a reversal to retest the low of last week. The
The primary trend remains down.
XJO DAILY
Price structure: Consolidation
The DAILY overlapping price structure indicates a consolidation period underway. Last Tuesday set the low ( 6952). Traders should look for a closing price over the Weekly high of 7045 as confirmation of bullish sentiment with a further move higher in equities.
Indicator: Relative Strength 14
The Relative Strength Indicator (14) has turned lower into the close on Friday, as the Relative Strength Indicator moves above the 50 level, only offering a bullish indication, any reading above the key 50 level shows price momentum is positive. Traders should monitor this for further move higher on continued strength in price movements indicating an increase of bullish momentum from the current divergence signal developing.

Comments last week: The bullish divergence signal discussed last week has played out with a swift reversal higher. Currently price has met the short-term down trendline. These types of violent recovery patterns indicate a short position cover and may end just as abruptly. The current price rally shows a strong impulsive range set last Friday at the trendline; further gains will test the 7090 resistance level.
S&P 500 WEEKLY
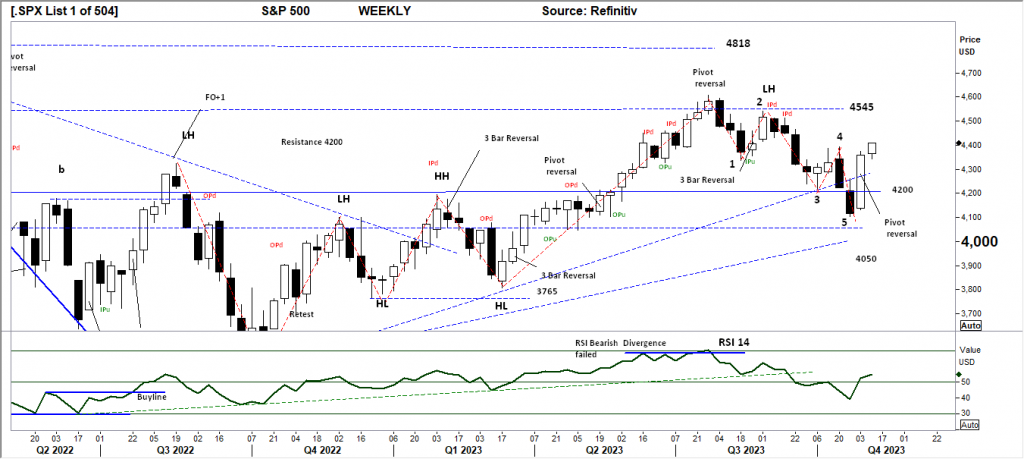
Price structure: 5 waves completed
From last week’s comments, “The 5 wave structure is a bullish pattern only when a confirmed reversal takes place.” Last week the index confirmed the wave structure with a follow-through higher above point 4 as price movement closed on the high of the week. Resistance shown at 4545 remains in place and remains the potential price target in this current rally. A further close below the 4200 level indicates a significant loss of momentum and remains to be monitored as a very bearish signal.
Indicator: Relative Strength Indicator 14
Relative strength has again turned higher and moved above the 50 level, but to remain bullish the RSI should remain over the 50 level with any underlying price advances. In the coming weeks, this consolidation below the 4545 level may re-assert a bearish RSI signal as the Relative Strength Indicator turns lower.
Comments from last week: The 5 wave structure is a bullish pattern only when a confirmed reversal takes place. Last week the Index set a strong Pivot point reversal and reclaimed the 4200 point level. The strong range reversal could be expected to follow through higher in the coming week. The 4545 level remains significant resistance for the Bulls. A reversal before this level would be extremely bearish for Stocks.
SPX DAILY
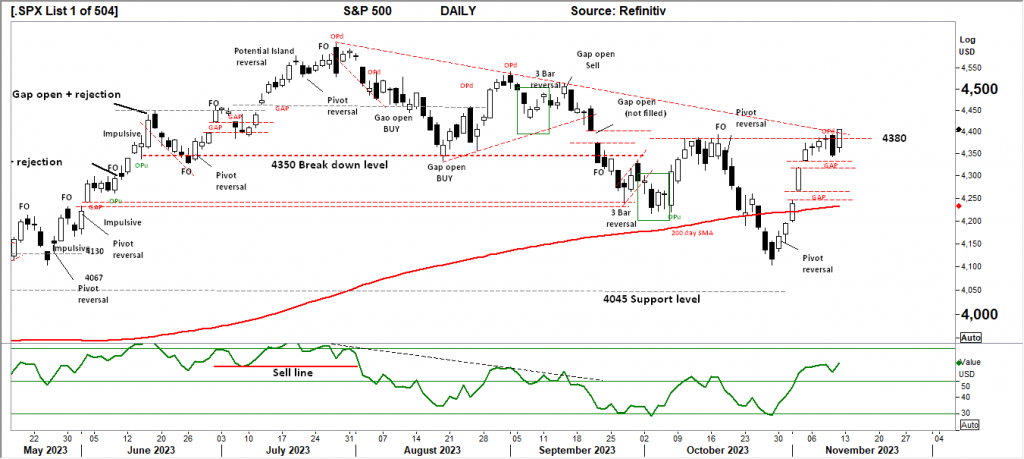
Price structure: Short cover underway
It is not ideal in price structure to leave “Gaps” open, the S&P has a strong history of closing price Gaps before resuming a directional move. Two significant Gaps remain open and will remain price targets on future price weakness. Price closing above the short-term trend line is a Bullish signal for further gains. The current price movement of the past 2 weeks is “corrective” and should be monitored for a short reversal to confirm a trending move underway.
Indicator: Relative Strength Indicator 14
The Relative Strength has moved sharply higher as price momentum recovers over the 14-day look-back period. This would now be monitored for a further rise towards the 70 level. A decline below the 50 level is a signal of a failed rally.
Comments from last week: Gaps often get filled and the S&P500 has a good track record of backfilling price gaps left open. Last week saw the Index leave 2 significant Gaps open as the recovery move got underway. At this point, the Index is making a corrective movement over the 200-day moving average and will have to confirm a trending movement in the coming weeks to affirm any real Primary movement. The first resistance level remains at 4380.
NASDAQ DAILY
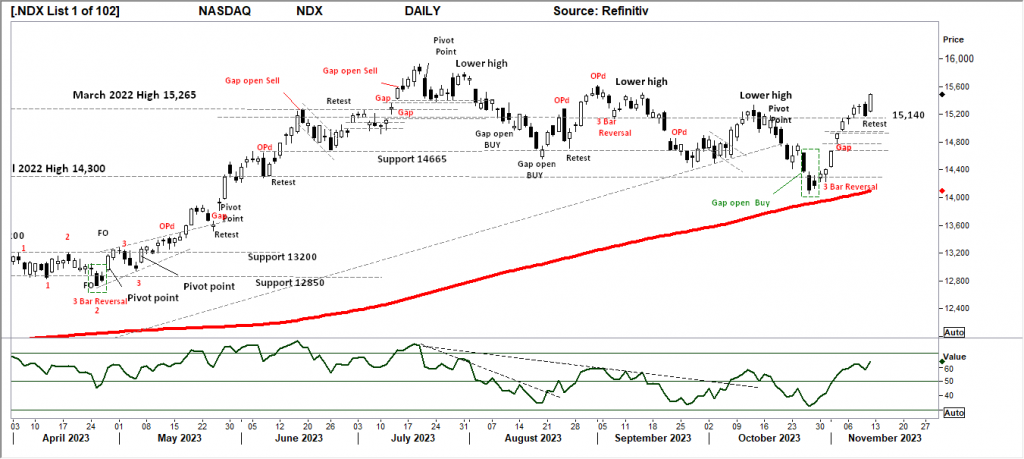
Price structure: Short cover Rally.
The “corrective” movement in the Nasdaq has retested and rallied from the important 15,140 level, too close towards the high of the week. Like the S&P the Nasdaq has left two Gaps open without being filled, history shows the Nasdaq does not make a priority of filling lower Gaps before moving higher. With last Friday’s range being an impulsive move ( larger than recent ranges) a follow-through should be expected in the earlier part of this week.
Indicator: Relative Strength 14
Relative Strength has moved higher above the 50-level setting a bullish signal as upward momentum comes into play. With the overall Relative strength is increasing as the underlying price movements of the Index move to new highs. The RSI should now be monitored for a further turn higher indicating a real change to positive momentum.
Comments from last week: Similar to the S&P the Nasdaq has left price Gaps open, the Nasdaq also has a good track record of filling Gaps as forward prices unfold. The Primary trend remains down, currently resistance at 15,140 remains in place and will be a significant milestone should the market move over this level in the coming week.
USD Spot GOLD – DAILY: Is it a Bull market? Maybe not?
The Gold price continues the a, b, c movement with the “c” wave now extended. The continued move lower to test support at $1893.0 provided the context of price strength being weak. Last Friday’s extended move was an impulsive move below the $1950 support level, setting a bearish implication of a lower price to come.
Indicator: Relative Strength 14
The RSI turning higher from below the key 70 level, turning with the rising price continues to be a positive observation, consolidation in price with a breakout higher will move the indicator higher, and a Relative Strength reading over 70 indicates strong momentum. However long-term traders should continue to monitor this long-term Weekly chart for a 4 th major yearly top in progress with further declines in the long term.
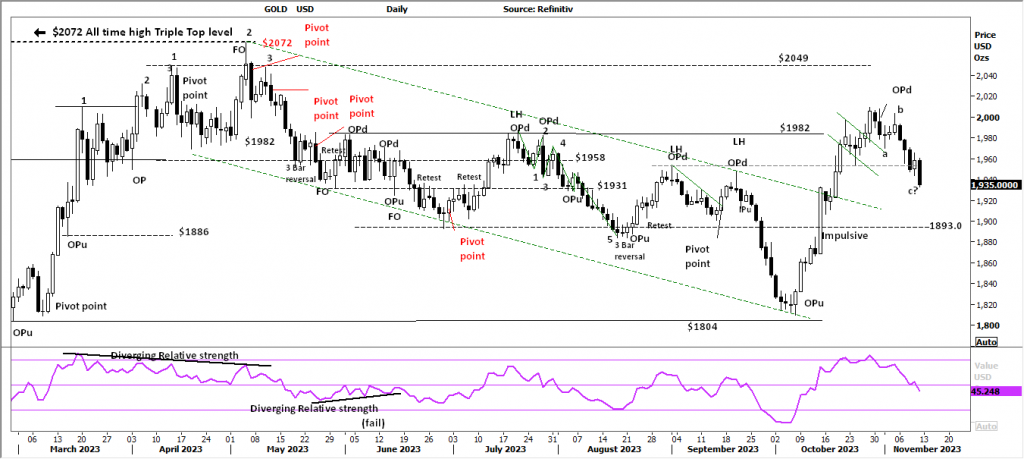
Comments from last week: The strong corrective move set 3 weeks ago has stalled into consolidation at the $1982 level. Of concern is the Outside range (OPd) marking a high, the price needs to regain this level quickly to keep the buyers intact. The Primary trend is changing, with a further breakout the Gold market will enter a Primary up trend. At this point, the Gold chart remains in a corrective move off the early October lows.
SILVER
Price structure: Head and Shoulder pattern failing
The developing Head and Shoulder pattern in Silver has failed to a price decline to retest the $22.09 level. With the confirmed reversal in place, Silver has set a new Lower high in line with the current downturn from the May’23 highs. A further breakdown below the $22.09 level would be a break of a significant support level and imply price could retest the early October low at $20.50.
Relative Strength 14
Current Relative Strength has turned lower from below the key 50 level if the RSI continues lower, the bearish signal will continue, only a continued movement to and above the 50 level reflecting a solid change in the underlying price momentum would alert traders to a potential new trend.
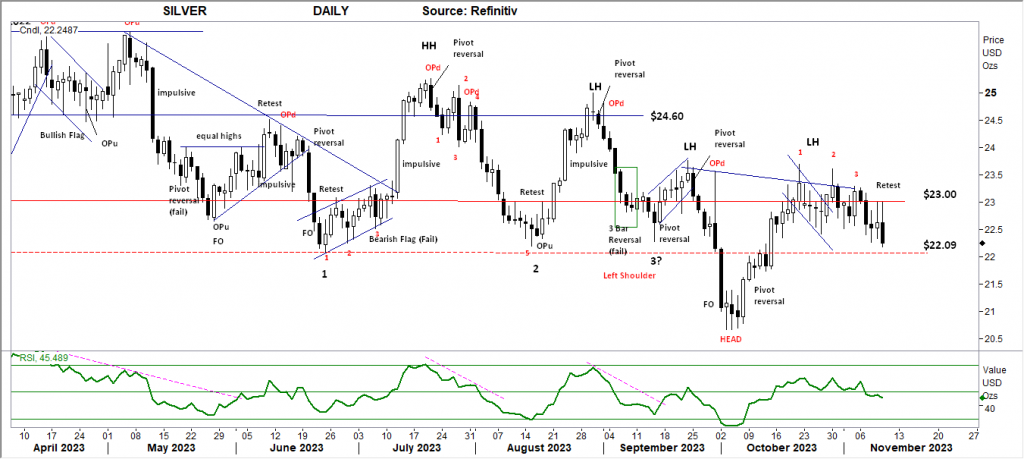
Comments from last week: The inverse pattern in Silver remains intact with what could be an early breakout on price following some consolidation. Silver remains within a Primary downtrend and only a breakout over the $23.80 level will change the underlying trend. Last Friday’s outside range is a bullish signal as the range is larger than the bars within the consolidation area, this is a very positive setup for further gains.
AUSTRALIAN VOLATILITY INDEX: The equities traders compass.
The current volatility closing value has remained inside of the 13 level again following another wide-range week closing higher.
While volatility remains at this level overall equities sentiment remains supportive for the BULLISH view, with the indicator pushing lower the forward pricing of PUT options is now decreasing, and the underlying price volatility may remain bullish.
Higher consolidating commodities prices and bullish consolidation of equity prices are indicated when the reading moves below the 13 level.
For continued support of equities, the XVI should remain subdued below the “13” level.
The cost of 3-month forward PUT options is decreasing from recent elevated levels.
The XVI is the difference between the 3-month forward pricing of ETO Options against the current month.
As markets anticipate events, the forward-priced option volatility changes, hence as forward price changes, this “skew” in pricing is measured in this XVI.
The XVI value works as an inverse observation of the underlying market.


 Access +10,000 financial
instruments
Access +10,000 financial
instruments