
XJO WEEKLY
Price structure: High range Weekly close
The closed top (no wick) hammer bar is an ideal setup for continuation; the retest of the previous week’s low shows buyers willing to enter the market on mid-week weakness. With the price closing over the important all-time high value of 7632, the momentum move has the potential to move prices higher. The current UP trend remains in place. From a Weekly perspective, a further close over this level would be very bullish going forward.
Indicator: Relative Strength 14
Relative strength remains above the 50 level again as part of the overall directional move higher in price. Only further movements towards the 70 level will remain a bullish signal for further gains, last week the RSI value moved sideways in line with price consolidation, however a new high is required over the late Q4-2023 high point. A new divergence signal may develop at this level.
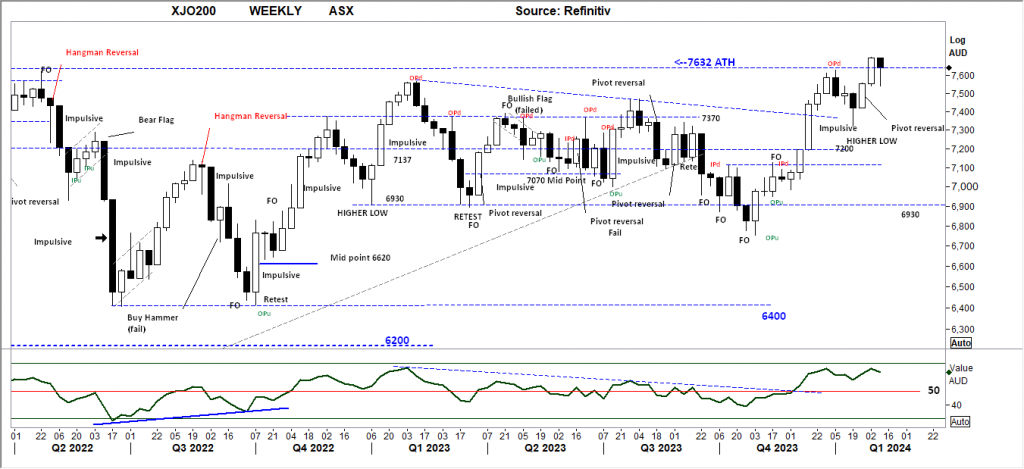
Comments last week: As the Index moves to a new all-time high with a strong range bar low to high, the indication is for market sentiment to remain positive in the coming weeks. The Index has also confirmed a move into a technical Primary UP trend. The 7632 level remains as a new key support level should a retracement occur. The prospect of an interest rate plateau has provided some market support.
XJO DAILY
Price structure: “Bear Flag”.
While the Weekly time frame shows an import close above the August 2021 all-time high. The Daily price chart shows a small bear flag developing during the last 3 trading days. A flag failure is possible to see the Index move higher in line with the Weekly view. In the short-term view (Daily) a retest of the 7540 level remains a possible outcome. In the Daily time frame, a close over the high of 7703 would indicate a flag failure and strength within the current Primary upward movement.
Indicator: Relative Strength 14
The Relative Strength Indicator (14) turned higher into the close on Friday, as the Relative Strength Indicator had a swing to move towards the 50-level following the sell divergence signal discussed 4 weeks ago; the current close heading towards the 70-level remains the play for this week. However, this is the level where traders should be looking for a sell divergence as the RSI is yet to move over the high (70) of 2 weeks ago.
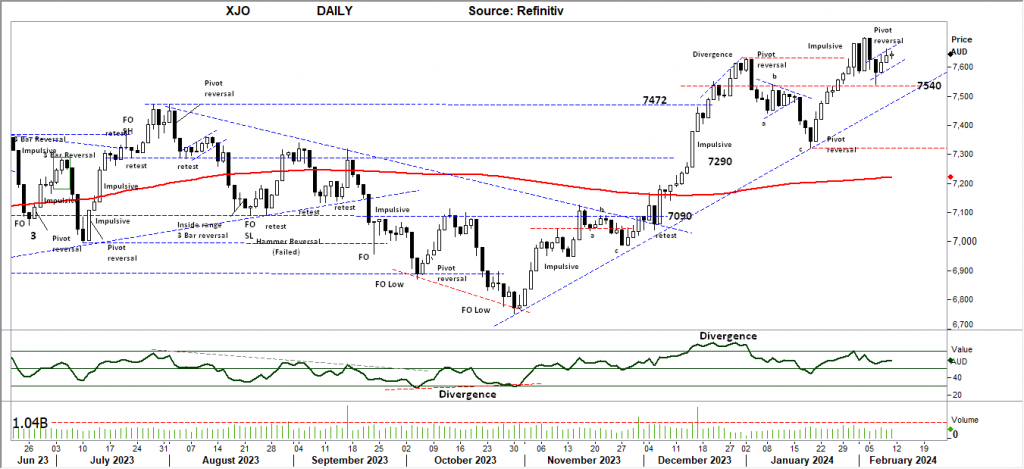
Comments last week: The initial breakout last Wednesday was quickly reversed on Thursday, with a strong reversal higher occurring to close the week, forcing new short positions to be covered. This highlights the current strength of sentiment in the market with a large range movement to finish on the high for the week. Shakeouts often occur at breakout levels to strengthen the impact of Buyers and bring resolve to the market. The Daily levels of 7630 and 7540 will remain as support levels in the short term.
S&P 500 WEEKLY
Price structure: Strong continuation.
The risk of profit-taking remains strong and may lead to a sharp retest of the 4818 break-out level. It remains rare to find a string of strong range weekly closes stretching over 800 points. The move to an exhaustion top may be in play; an exhaustion move may run for many weeks until buyers start to profit, along with late buyers having to cover losses. A price break below the short term “trendline” will alert the trader a final top may be in place.
Indicator: Relative Strength Indicator 14
Relative Strength has again turned higher and moved back over the 70 level, but to remain a strong momentum signal, the RSI should continue a move over the 70 level with the underlying price advances. In the coming weeks traders would monitor the RSI for a bearish divergence signal as any Index price consolidation towards the 4818 level may re-assert a bearish RSI signal as the indicator would turn lower towards the 70 level and below.
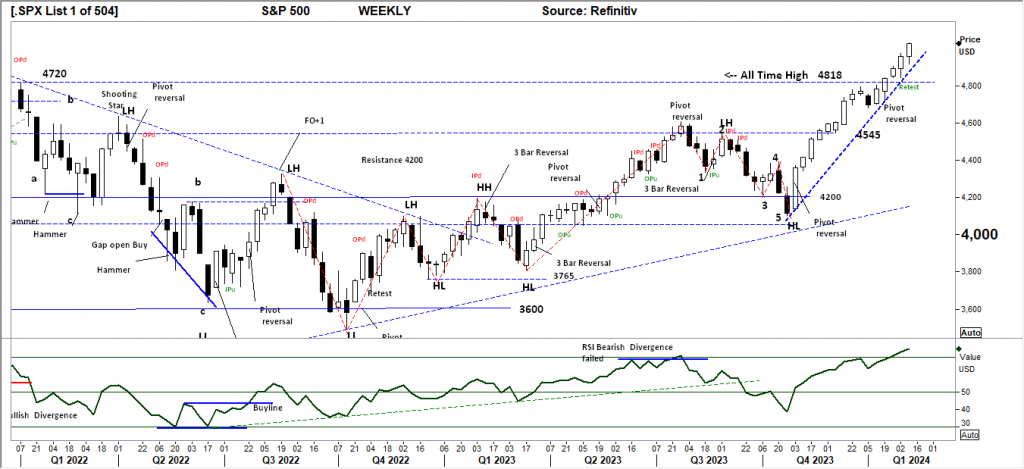
Comments from last week: With the new breakout to an all-time high comes the risk of sharp profit-taking; for this week, the 4818 level remains as support. The index has now entered an extended move, with 13 of the past 14 weeks closing higher towards the 5000-point level (currently 4958 points). The prospect of a plateau in interest rates has propelled the Index higher.
SPX DAILY
Price structure: Sell divergence developing.
The Daily time frame an early divergence signal may be developing, the recent moves are “gapping” higher indicating a buyer frenzy. As with the weekly view, a break of the short-term trendline remains the key observance during the coming week. The Daily trend remains firmly in a UP trend and has become an “extended move” given the distance away from the 200-day moving average is growing larger. Historically the Index has moved to “retest” the average, this now remains a strong outcome in the coming days and weeks.
Indicator: Relative Strength Indicator 14
The Relative Strength Indicator has moved back to the 70 level, indicating stronger momentum. Although not a signal of over brought, the current second and third movement into this over 70 level is often seen as a level to take profits as seen during July 2023 and December 2023. The potential Sell divergence signal was again developed with the RIS line setting a new lower point.
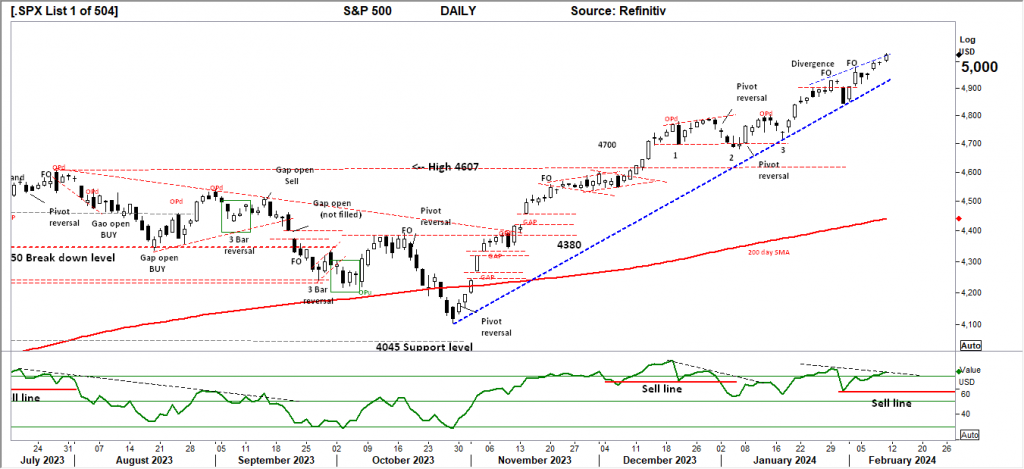
Comments from last week: Within the Daily view of the S&P 500, the short sell-down last Wednesday was quickly reversed to set the Index at a new all-time high. The current high has also set a “Fake Out” (FO) point and can lead to further selling as profits are locked in. The Daily trend remains firmly in a UP trend and has become an “extended move” given the distance away from the 200-day moving average is growing larger. Historically the Index has moved to “retest” the average, and this now remains a strong outcome in the coming months.
NASDAQ DAILY
Price structure: Sell divergence developing.
The current seasonal move in the Indices may extend further; however, as with the other Indices’ the Nasdaq continues an extended move away from the 200-day moving average. The strong range set last Friday suggests continuation this week, however an exhaustion move is now underway and further upside may be limited until a price retracement ultimately tests the buyers strength. Many unresolved “Gaps” remain in the price structure.
Indicator: Relative Strength 14
Relative Strength has again moved towards the 70 level, this remains an area to monitor for further exhaustion reversal. The observance is the overall Relative strength is again, bullish for now, however the potential 4th movement over the 70 level is often a signal of exhaustion. The RSI should now be monitored for a further movement lower indicating a change of momentum, this may provide some early insight to trend failure.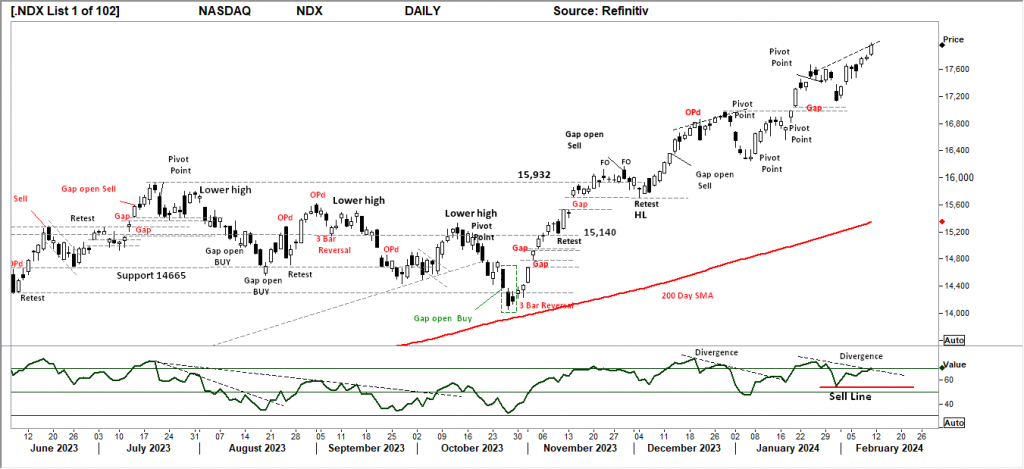
Comments from last week: As with the other Indices’ the Nasdaq has entered an extended move away from the 200-day moving average. Although the market remains in a Primary UP trend the conditions for a sharp retracement remain. Currently, last Wednesday’s Gap, lower towards the open Gap area, has been resolved with a sharp move higher, forcing the aggressive short positions to be covered.
USD Spot GOLD – DAILY: Further consolidation.
“Nothing to see here” is the best summary of the current 3-month price consolidation. The observation of consolidation also indicates low price volatility. Traders will be aware that low volatility leads to high volatility. With the Primary trend in place from the October 2023 lows the expectation should be for a move higher to retest the December “spike high” point. The current support level of $1982 remains the level to retest on a move lower. The price moving over the resistance level of $2049 will alert the buyers that a potential move higher is underway.
Indicator: Relative Strength 14
The RSI is turning lower from above the key 50 level, with the consolidating price; during the current consolidation in price, only a breakout higher will move the indicator higher above the 50 and again higher to the 70 level, a Relative strength reading below 50 indicates bearish momentum. Long-term traders should continue to monitor this Daily chart for a 5th major yearly top in progress at the $2072.0 level with further declines in the long term.
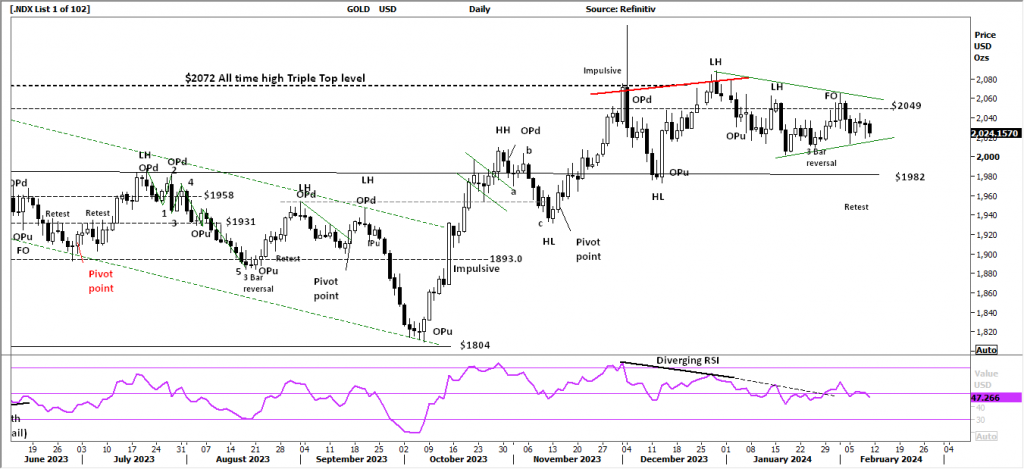
Comments from last week: Gold remains within a consolidation range, short term range trading is on offer, however a technical signal is shown for a breakout higher or lower. Key levels to monitor for a breakdown is $1982 and for a breakout higher a solid close over the $2049 level would alert the buyers.
SILVER
Price structure: New Down trend remains
The two key levels in Silver are support at $21.90 and resistance shown at $24.60 and $26.20. Last Thursday the contract set an Outside period up close (OPu) indicating buyer support from the lows, this type of signal is highly probable of a swing point in place, with Stops set at the $22.0 low point.
Relative Strength 14
Current Relative Strength has turned lower below the 50 level to move sideways at this level, indicating momentum has turned neutral; if the RSI continues lower, the bearish momentum signal will show a continued price movement lower. Only a continued move higher would reflect a solid change in the underlying price momentum and would alert to a potential new trend and breakout.
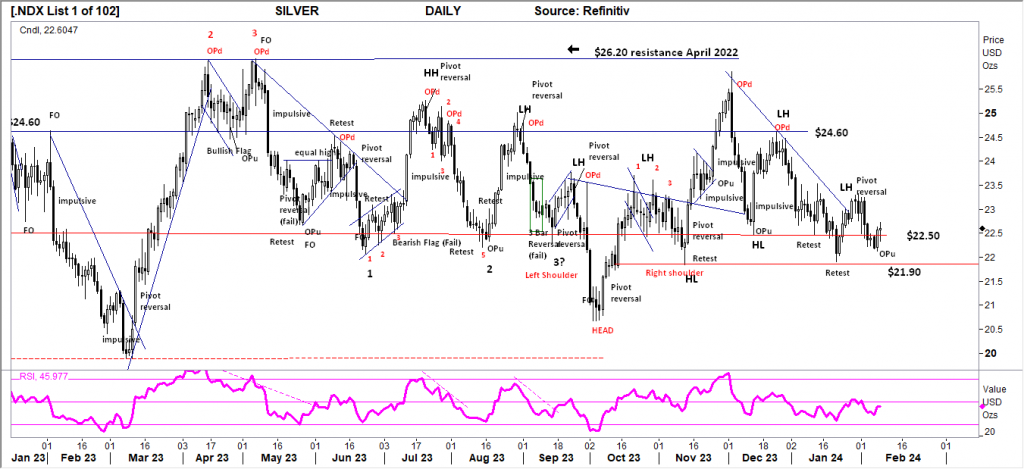
Comments from last week: Silver has confirmed another lower high (LH) as the price again retests the $22.50 level. The Daily chart clearly shows the continuing consolidation between resistance at $26.20 and support above $21.90. With a new bearish pivot reversal in place last week a further move lower towards the $21.90 level could be expected this week. For a bullish breakout signal to occur, price should move over the $24.60 level.
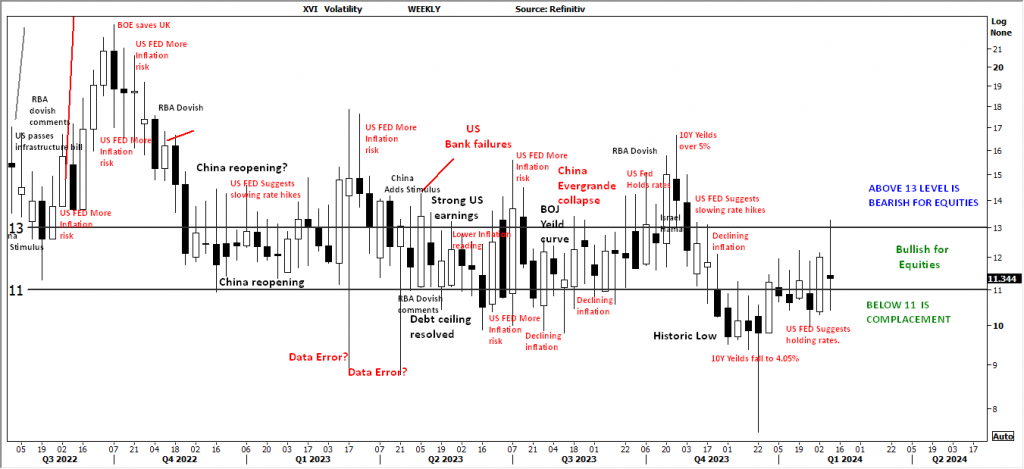
AUSTRALIAN VOLATILITY INDEX: The equities traders compass.
The current volatility closing value has moved to close above the 11 level following a move towards the 13 level.
The closing value indicates the XVI is now within the “bullish” level. With the indicator moving higher the forward pricing of PUT options (insurance) is increasing, this is observed against a rising market indicating equity price movements may turn bearish as the cost of 3 month (insurance) Put Options is increasing suggesting the market is moving to a protect profits mode.
For continued support of equities, the XVI should remain subdued below the “13” level.
The cost of 3-month forward PUT options is decreasing from recent elevated levels.
The XVI is the difference between 3-month forward pricing of ETO Options against current month.
As markets anticipate events, the forward-priced option volatility changes; hence, as the forward price changes, this “skew” in pricing is measured in this XVI. The XVI value works as an inverse correlation to the underlying market.


 Access +10,000 financial
instruments
Access +10,000 financial
instruments