
XJO WEEKLY
Price structure: Overall view remains Bullish
Last week saw a higher low and higher high than the previous week; however, the solid close below the 7200 level is a further bearish signal with extended consolidation remaining in the overall technical view. With the closing value in the lower 20% of the overall range, the initial outlook is for a bullish reversal; a close over the 7200 level would remain as a bullish reversal.
Indicator: Relative Strength 14
Relative Strength has moved below the 50 level (just) as part of the overall change in momentum with last week again turning slightly lower at this important level. Only further movements over the key 50 level towards the 70 level will remain a bullish signal for further gains; a continued move below this important level would signal further Bearish momentum as sentiment currently remains mildly bearish. A cross above the 50 is a bullish signal.
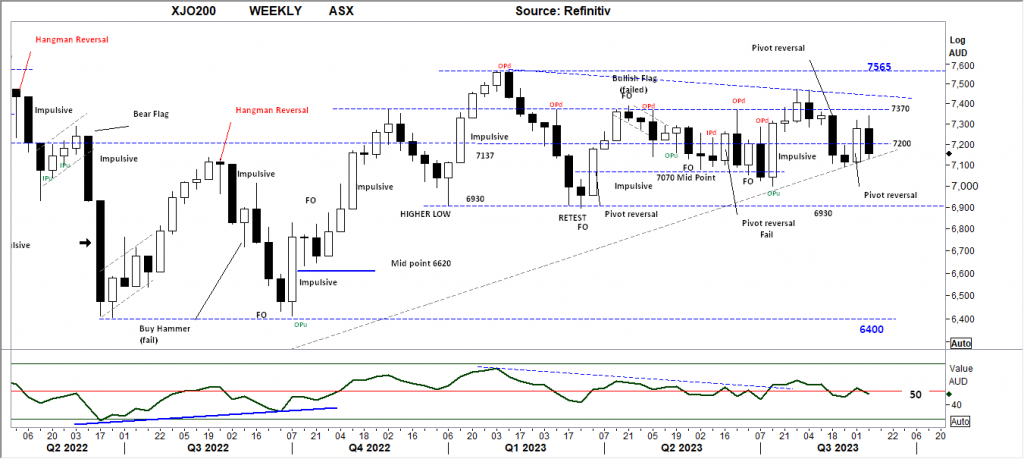
Comments last week: The small range mentioned last week has become the market consolidation point, with last week posting a strong range low to high and, importantly, closing over the 7200 level, a very bullish signal for further gains. Although the closing price remains midway in the consolidation range of the past 3 quarters of price action, this pivot reversal sets a 3rd higher low in the overall pennant pattern.
XJO DAILY
Price structure: Sentiment remaining FLAT.
The low volume reversal bar set on Friday (8th) indicates the market is not in a bearish phase, only that buyer sentiment is poor. With the market remaining above the late August low but below the 200-day moving average, a breakout lower would see further selling as the swing buyers are forced into a Stop-loss sell. Conversely, a follow-through swing higher would see the short positions closed on Stops. Small range swings, as shown over the past 6 months, can be frustrating for traders, and traders should be aware the breakout will be volatile.
Indicator: Relative Strength 14
The Relative Strength Indicator (14) turned lower, and the Relative Strength Indicator remains below the 50 level, and any reading above the key 50 level shows price momentum is positive. Traders should monitor this for a further turn higher on continued strength in price movements indicating an increase in bullish momentum.

Comments last week: With the Trendline holding as the Daily price movements set a reversal followed by a strong momentum move back over the 200-day moving average; momentum may continue higher. The down close last Friday was completed on Low Volume as the price remains around the 7300-7290 level; low volume declines are considered overall bullish as longer-term holders remain in the market over the weekend. Follow-through lower will offer a fast signal a bearish swing may be underway.
S&P 500 WEEKLY
Price structure: Potential Blow off Top coming.
An inside week (IPd) shows the market remains in balance. The 4545 level also remains a considerable resistance level; currently, the S&P Indices risk posting a “lower high” below this important level. A further breakdown below the 4300 level would confirm a bearish trend developing in the Index.
Indicator: Relative Strength Indicator 14
Relative Strength has again turned lower from the key 70 level, but to remain bullish, the RSI should continue to turn higher and remain over the 50 level with further underlying price advances. The RSI rollover of the last 4 weeks indicates slowing momentum with a clear bearish divergence signal that has failed in this extended price move. In the coming weeks, this may re-assert a bearish divergence signal.
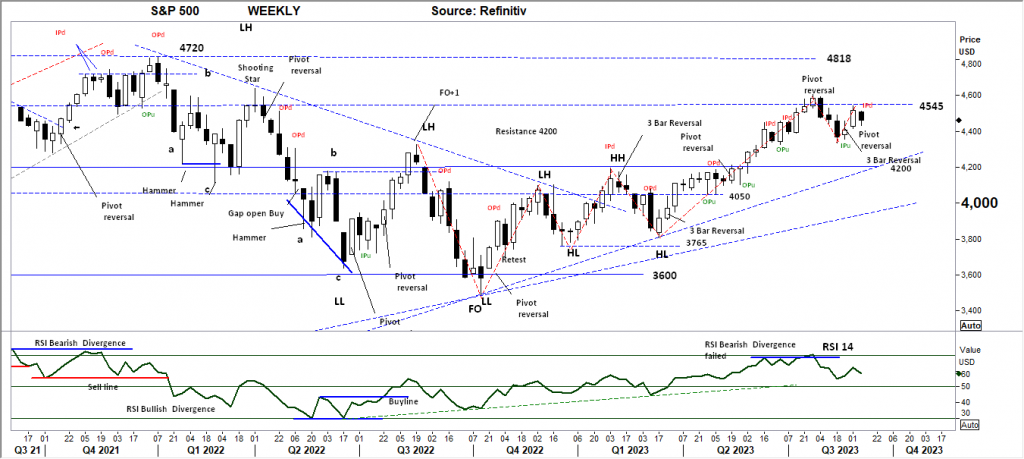
Comments from last week: The 3-bar reversal mentioned last week has set up the swing low as the strong trading range of last week set a new Bullish pivot point. The resistance level of 4545 remains in play; this week should see the price move over this level, setting up a bullish continuation and a potential retest of the 4818 level. Price failure at this level would see the Index move below the 4,350 level and potentially make a swift move lower to test 4200. This is not the current setup, but it remains a possibility should a sudden change of sentiment take place.
S&P 500 DAILY
Price structure: Looking for a continuation higher.
Within the short-term view of the Daily chart, the 3 bar reversal pattern can set a bullish tone over the next week; only a closing price over the OPd high (4550) would give a bullish signal. Further consolidation above the 4350 level seems to be in play. A price breakdown below this important level would send a very Bearish signal to traders that a Major top that has developed since June would now be in place. Consolidation is an important sequence in the development of Bull markets as the weaker sellers move out of the market to make way for the longer-term buyers; 4350 is a very important level.
Indicator: Relative Strength 14
Relative Strength is pushing towards the 50 level again as momentum changes. For further price strength in this index, the RSI move has to be higher to sideways, remaining back above the key 50 level. Should the RSI continue to move below the key 50 level, bearish price momentum may continue to play out in the coming weeks.
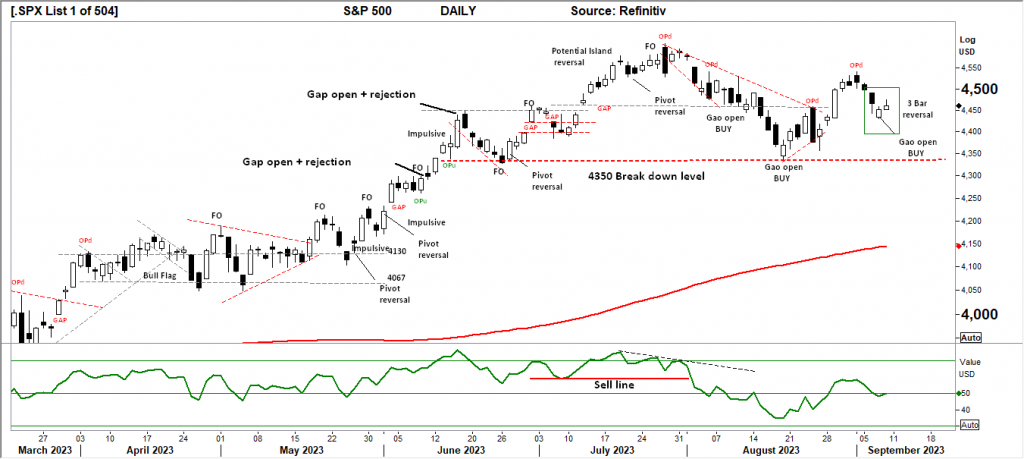
Comments from last week: The strong range set early in the week, closing over the 4450 level, has followed through higher but not decisively, with the final outside period (OPd)bar potentially marking a reversal point. This will be confirmed with a close below the 4500 level. Overall, the primary trend remains UP.
NASDAQ DAILY
Price structure: Primary UP Trend reversal.
With the OPd discussed last week playing out into lower prices, the “gap open” from last Thursday and Friday’s range has set a 3-bar reversal pattern, indicating a short-term “swing low” may be in place, the first price target higher is the recent high at 15,600. This view will be negated with a closing price below the 15,140 point low of last Thursday’s Gap open bar.
Indicator: Relative Strength 14
Relative Strength has moved higher over the 50-level, setting a bullish signal as momentum changes from down to up. The Relative Strength increases as the underlying price movements of higher closing highs and higher lows occur. No divergence is shown at this stage but should now be monitored for a further reversal turn lower, indicating a loss of momentum.
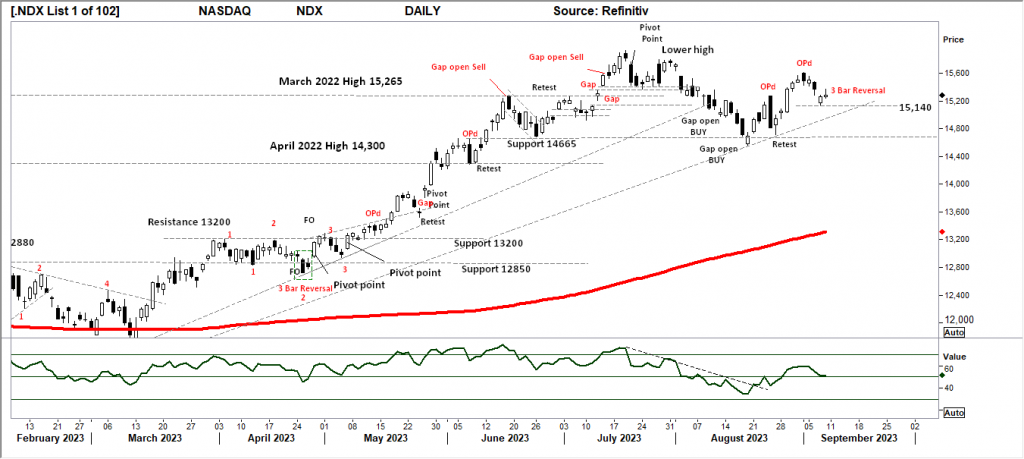
Comments from last week: The Nasdaq has also set an outside period (OPd); following the previous move can make a turning point; only a decisive close over the 15,600 level would negate that view. The Index remains within a Primary UP trend. Although the Nasdaq Index has remained within a 3-quarter trading range, the recent higher low at the 14,665 level remains the higher low, with this current movement pushing towards the 16,000 point level.
USD Spot GOLD – DAILY: Is it a Bull market? Maybe not yet.
USD Gold continues its Daily downtrend, with the recent OPd marking the latest lower high. A further movement below the $1880 level will confirm the continuation of the trend. In the short term, a 3-bar reversal shows the potential for the price to move higher; in this daily view, a price close below the recent low of $1914.0 will negate the 3-bar reversal pattern.
Indicator: Relative Strength 14
The RSI turning lower below the key 50 level and turning with the rising price continues as a positive observation; consolidation in price with a breakout higher will move the indicator higher. With the RSI moving further higher but remaining below the key 50 levels, long-term traders should continue to monitor this long-term chart for a major yearly top in progress with further declines in the long term.
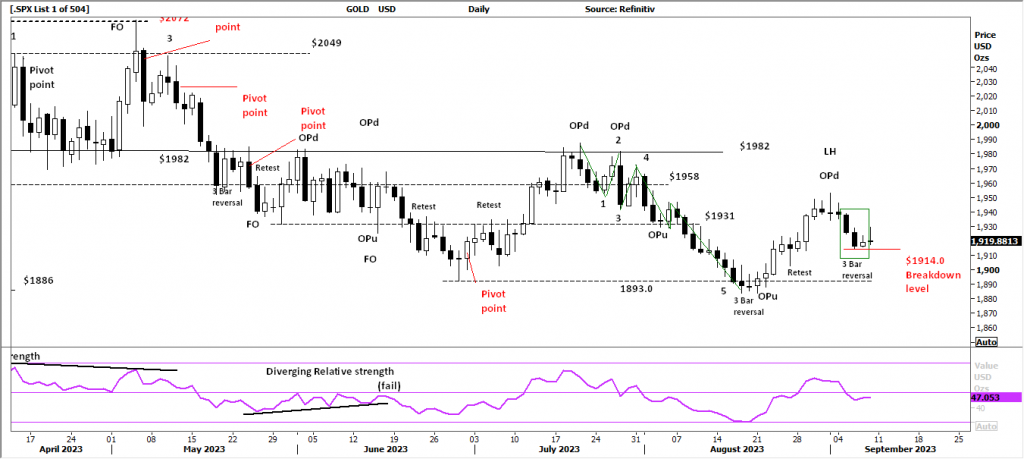
Comments from last week: Gold continues higher from the 3 bar reversal at the $1893 support level; the current movement shows a final OPu outside period; this is often a reversal point; only an immediate price rally over the high would negate that view. Gold remains within a Primary DOWN trend. The current support level of $1931.0 must be held to keep the buyer in the market.
SILVER
Price structure: Reversal at support underway
Like the Indices, Silver has displayed a 3-bar reversal pattern at the close of last week. With the current price decline now finding support at the $23.0 level, the commodity is continuing to trade within a large consolidation area. The potential for a price reversal higher at this level only sets a target of the last resistance level of $24.60.
Relative Strength 14
Current Relative Strength has turned higher from below the 50 level; the RSI continues higher, the bullish signal will continue with a move above the 50 level, only reflecting the underlying increasing price momentum. However, a continuing move towards the 70 level and higher will remain a very bullish signal in the shorter term; however, it should be noted the indicator is very close to moving towards the 30 level.
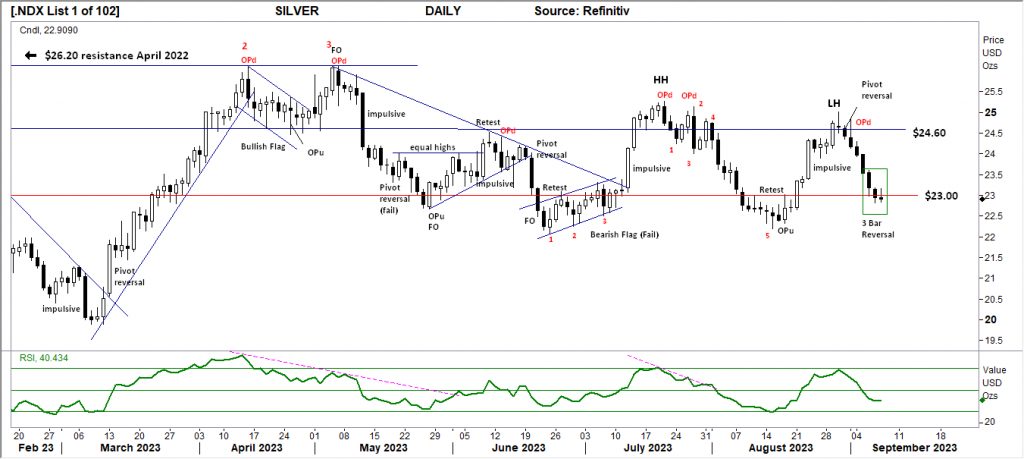
Comments from last week: Silver remains within a trading range and again finds resistance at the $24.60 level with a confirmed pivot point in place. With the last trading day and Outside bar, the short-term top may be in place, and the potential remains for a retest of the $23.0 level. No trend can be determined as the price consolidates between these two price levels.
AUSTRALIAN VOLATILITY INDEX: The equities traders compass.
The current volatility closing value has returned to the important mid-13- 11 level again following a wide-range week.
While volatility remains at this level, overall equities sentiment remains supportive for the bullish; however, with forward pricing of PUT options now increasing, the underlying price volatility may turn bearish.
Lower consolidating commodities prices and bearish consolidation of equity prices are indicated when the reading moves above the 13 level.
For continued support of equities, the XVI should remain subdued below the “13” level.
The cost of 3-month forward PUT options is decreasing from recent elevated levels.
The XVI is the difference between the 3-month forward pricing of ETO Options against the current month.
As markets anticipate events, the forward-priced option volatility changes; hence, as forward price changes, this “skew” in pricing is measured in this XVI.
The XVI value works as an inverse observation of the underlying market.


 Access +10,000 financial
instruments
Access +10,000 financial
instruments