
XJO WEEKLY
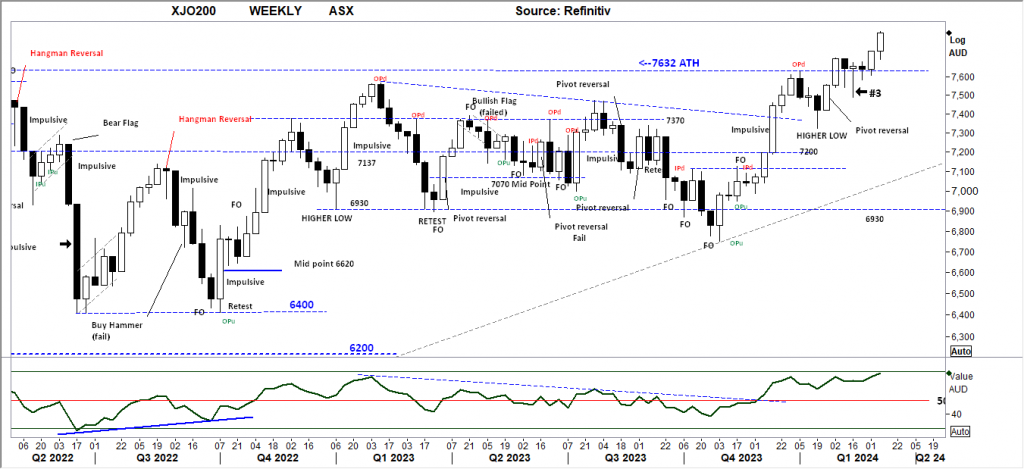
Price structure: Breakout New ATH targets 8000 points
The Index has again closed at an all-time high and remains in a Primary UP trend. With the majority of the underlying stocks still below their 200-day moving averages, continued sentiment may lift the Index considerably higher, with 8000 points a strong target as Bullish sentiment improves.
Indicator: Relative Strength 14
Relative strength remains above the 50 level again as part of the overall directional move higher in price. Only further movements towards the 70 level will remain a bullish signal for further gains, last week the RSI value moved sideways in line with price consolidation, however a new high is required over the late Q4-2023 high point. A new divergence signal may develop at this level.
Comments last week: The Index has closed at an all-time high and entered a Primary UP trend. With the majority of the underlying stocks still below their 200-day moving averages, continued sentiment may lift the Index considerably higher, with 8000 points a strong target as Bullish sentiment improves.
The #3 hammer bar remains a strong signal for reversal when found in a high-price area. If it is not resolved into a lower market this week, it will prove the bullish sentiment is in place.
XJO DAILY
Price structure: Bull flag Breakout.
As with the US Indices, the XJO is now accelerating away from the 200-day moving average. The strong “impulsive” move last Friday following the small bullish flag formation earlier in the week signals a continued move is possible, the volume was not outstanding also indicating a lack of sellers into the rally. With continued momentum the 8000 point level is achievable in the short term. The daily price trend remains in line with the Primary Weekly UP trend.
Indicator: Relative Strength 14
The Relative Strength Indicator (14) turned higher into the close on Friday, as the Relative Strength Indicator had a swing higher to move towards the 70-level following the sell divergence signal discussed 5 weeks ago, the current close heading towards the 70 level or over remains the play for this week. However, this is the level where traders should be looking for a further sell divergence as the RSI is yet to move over the high (70) of 4 weeks ago.
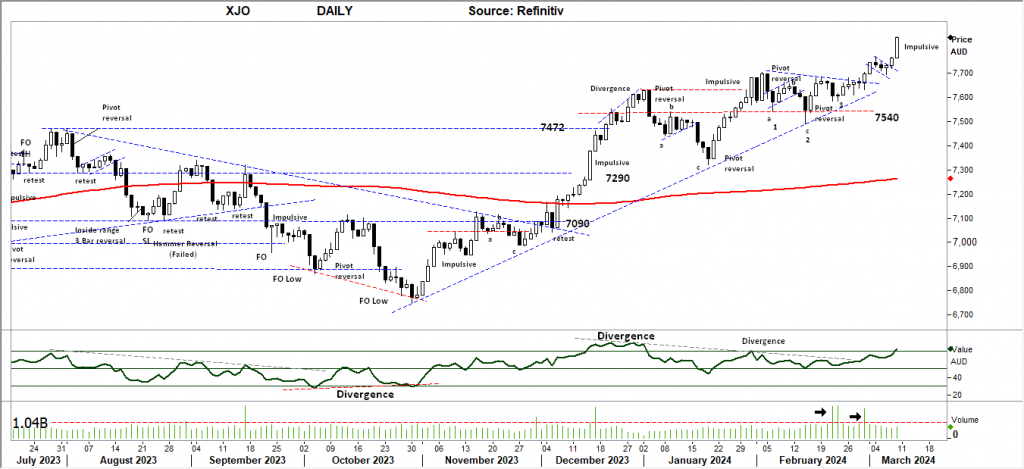
Comments last week: Further strong volume indicators with the Index breaking out of the Pennant pattern into new all-time highs. The strong high range close last Friday is indicative of a Bullish move underway that is potentially going to continue out to the 8000-point level. Traders should monitor this breakout for a retracement retest of the top Pennant level of 7650; a further close below the short trendline would set a further Bearish signal.
S&P 500 WEEKLY
Price structure: Outside range.
The extended movement of the S&P500 continues with last week setting an OPd (outside range); statistics for this type of range suggest a 94% chance in the top in, or some form of consolidation should take place. The key level of support remains at 5030 points, first indication of a retest lower will be a break of the weekly low at 5056 points. The risk of a sharp profit-taking move lower remains for this week’s trading.
Indicator: Relative Strength Indicator 14
Relative Strength has turned lower as the momentum indicator remains over the 70 level, but to remain a strong momentum signal, the RSI should continue a move over the 70 level with the underlying price advances. In the coming weeks traders would monitor the RSI for a bearish divergence signal as any Index price consolidation towards the 4818 level may re-assert a bearish RSI signal as the indicator would turn lower towards the 70 level and below.
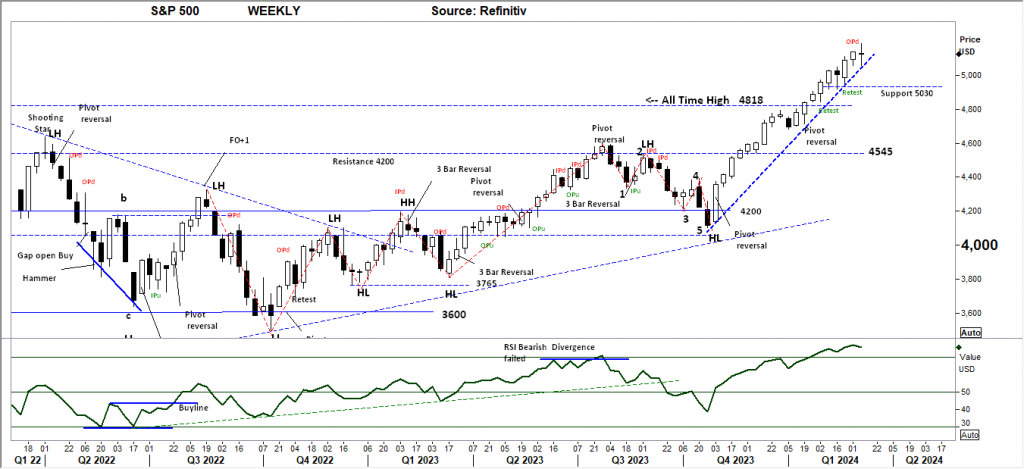
Comments from last week: The S&P Index’s exponential movement is supported by only a handful of dual-listed (Nasdaq) stocks. Traders should use caution around being “late buyers.” The Hangman of three weeks ago still remains valid as a reversal indicator going forward. A weekly close below the short trendline and the 500 level will alert traders to a potential top in place.
SPX DAILY
Price structure: Outside range.
An outside range is also displayed in the Daily view; the outside range has a very statistical signal for reversal or consolidation. The unfilled “Gap at the 5000-point level remains the downside target in the short-term view. With the US and Australian companies financial reporting now finished, analysts will begin the re-rating, the consensus is for further earnings growth inside the current inflationary cycle. This remains a positive for the markets in the near future.
Indicator: Relative Strength Indicator 14
The Relative Strength Indicator remains below the 70 level, indicating slowing momentum. Although not a signal of overbought, the current second and third movement ( January – February) into this over 70 level is often seen as a level to take profits, as seen during July 2023 and December 2023. The potential Sell divergence signal has again developed with the RSI line setting a new lower high.
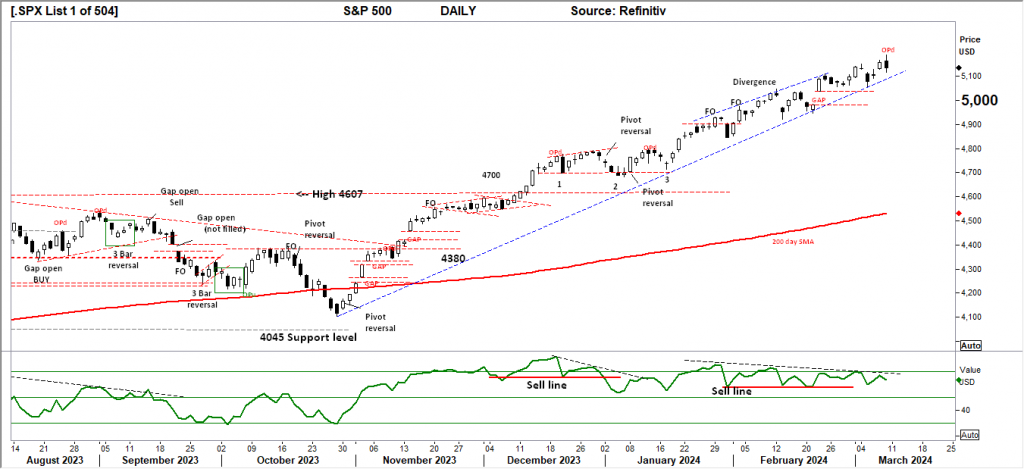
Comments from last week: As the Index moves further away from the 200-day moving average to again set an all-time high, the potential for a corrective move back into the open Gap area at 5000 points remains. Last week’s consolidation above the Gap area is positive for further gains in the short term following the small “hammer bar” of last Thursday.
NASDAQ DAILY
Price structure: Outside range.
The “outside range” shows indecision in the current Primary UP trend, buyers unable to take the market higher and sellers unable to move the market lower, the direction break of this bar will give traders the short-term directional move. The unfilled “Gap” in the 17,600 area remains the target should the market consolidate at this level.
Indicator: Relative Strength 14
Relative Strength has again declined from the 70 levels; this remains an area to monitor for further exhaustion reversal to move below the “sell line”. The observation is that overall Relative strength has turned bearish for now. The failed fourth attempt to move over the 70 level is often a signal of exhaustion. The RSI should now be monitored for further movement lower indicating a change of momentum. This may provide some early insight into trend failure.

Comments from last week: As the price movements diverge further from the 200-day moving average, the potential for a corrective movement back to a key support level remains. The current breakout over the 18,060 level is a strong signal for continuation for this week. With the underlying Primary UP trend remaining in place the current breakout over resistance is the continuation move the Buyers need. Key support this week is the 18,060 breakout point. The prime driver is Nividia closing at $823.0, and the AI based stocks gaining value, however the rise in the Index value is not broad based.
USD Spot GOLD – DAILY: All-time closing high with Bearish close.
A short hesitation at the $2135.0 level was followed by a decisive move higher. This is an extended move and one of the largest moves in recent history. Last Friday’s extended day saw some selling into the close, indicating this is not an institutional move but rather retail-driven buying. As momentum slows, traders should expect a retest of the $2135.0 breakout level as a best-case scenario.
Indicator: Relative Strength 14
The RSI is turning higher from below the key 50 levels set during February. With the price reversal, this breakout has moved the indicator higher to the 70 level. The Relative Strength reading below 50 indicates bearish momentum. Long-term traders should continue to monitor this Daily chart for a fifth major yearly top in progress at the $2135.0 level, with further declines in the long term.

Comments from last week: As discussed last week, the closing price over $2072.0 now sets the target to retest as $2135.0, the spike high area from the 4th of December 2023. Breakouts from long consolidation areas tend to be decisive moves, confirmed by Friday’s impulsive range. This week, a retest of the $2135 high may find some significant resistance at this level as December 23 buyers see a way out.
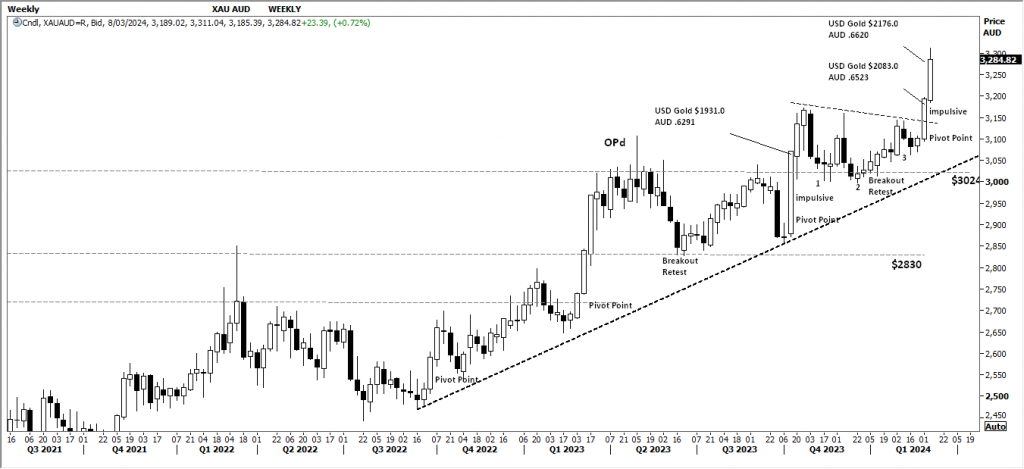
AUD Spot GOLD – DAILY: All-time high, very Bullish.
The Australian dollar Gold price has set a new all-time high as part of the overall Primary uptrend. This remains very bullish for local Gold mining players NST, EVN and NEM along with GOR. The initial support of $3024 has set the base for the current continuation of Trend with an impulsive move away from Q1 2024’s consolidation. Note that the $AUD value remains around the $0.62- 0.66 cents or lower, coupled with the $USD gold price advances. This is a critical observation and needs to be maintained to provide price support for the XAUAUD chart. For traders, weakness would see the price move back to retest the $3150 breakout level.
Comments from last week: The Australian dollar Gold price has set a new all time high as part of the overall Primary UP trend in place. This is very bullish for local Gold mining players NST, EVN and NEM along with GOR. The initial support of $3024 has set the base for the current continuation of Trend with an impulsive move away from consolidation. Note that the $AUD value remaining around the $0.62- 0.65 cents and the $USD gold price advances are critical observations and need to be maintained to provide price support for the XAUAUD chart. For traders, weakness would see the price move back to retest the $3150 breakout level.
SILVER
Price structure: Bullish flag continuation.
Silver again retests the $24.60 resistance level and rejects it into Friday’s close. Traders should look for an early breakout higher over this key level to confirm market support for the precious metal. The current price move is defined as “extended,” and should a consolidation area form below the $24.60 resistance, some further profit-taking may occur.
Relative Strength 14:
Current Relative Strength has turned higher above the 50 level, indicating momentum has turned early Bullish, if the RSI continues higher, the earlier bullish divergence signal has given way to a strong Buy signal. Only a continued move higher towards the 70 level would reflect a solid change in the underlying price momentum and should alert to a potential new trend and breakout.
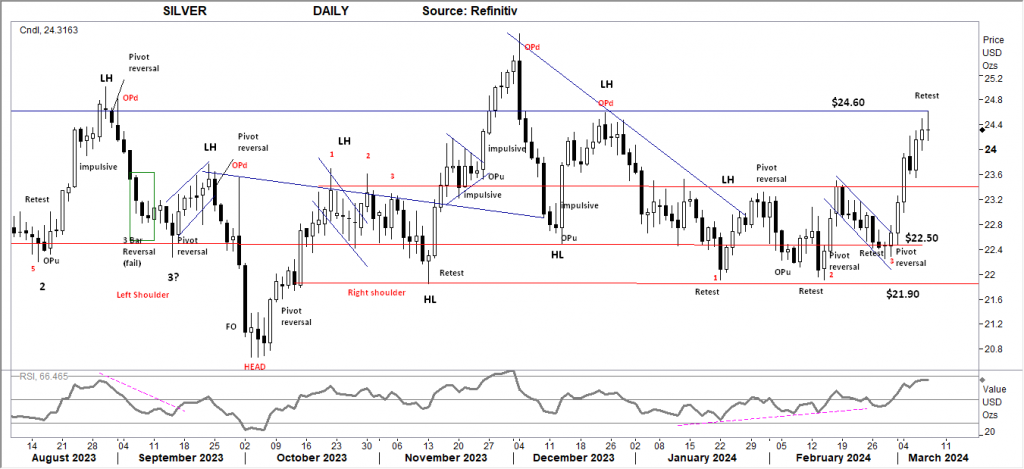
Comments from last week: Last Friday Silver set an impulsive range against the developed bull flag pattern. Traders look for a further gain over the $23.60 level to confirm the current bullish move underway. Silver remains within a consolidation area, however the 3 tests towards the $21.90 level shows strong support at this level the retest of the $22.50 level and Friday’s move higher confirms a higher low in place and the basis for a new Primary UP trend developing.
AUSTRALIAN VOLATILITY INDEX: The equities traders compass.
The current volatility closing value has moved above the 11 level following a move towards the 13 level. The closing value indicates that the XVI remains within the “bullish” level.
With the indicator moving higher early in the week, the forward pricing of PUT options (insurance) was increasing. This is observed against a rising market, indicating equity price movements may turn bearish as the cost of 3-month (insurance) Put Options is increasing, suggesting the market is moving to a protect profits mode.
For continued support of equities, the XVI should remain subdued below the “13” level.
The cost of 3-month forward PUT options is decreasing from recent elevated levels.
The XVI is the difference between the 3-month forward pricing of ETO Options and the current month. As markets anticipate events, the forward-priced option volatility changes; hence, as the forward price changes, this “skew” in pricing is measured in this XVI.
The XVI value works as an inverse correlation to the underlying market.


 Access +10,000 financial
instruments
Access +10,000 financial
instruments