
XJO WEEKLY
Price structure: Strong advance.
The Index remains within 20 points of an all time high following a sustained advance from the late October bullish OPu. This seasonal window has a few weeks to run, however given the already extended price movement from the 6800 lows, traders should now monitor price for a move below the 756 level as a signal for reversal.
Indicator: Relative Strength 14
Relative strength has moved above the 50 level again as part of the overall directional move higher in price. Only further movements towards the 70 level will remain a bullish signal for further gains, a continued move below this important 50 level would signal further Bearish momentum as sentiment may change.
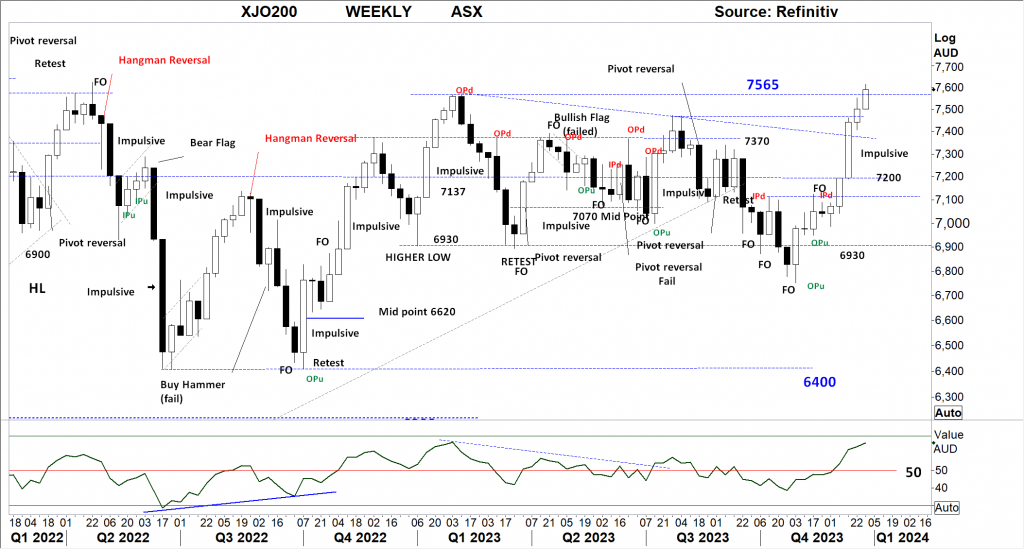
Comments last week: A very strong range (impulsive), closing towards the high has presented last week, some follow through should again be expected during this trading week.
With the current Weekly closing price remaining within the larger range between support at 6930 and resistance of 7565, the index still remains within a downward movement. The current strong rally remains a seasonally corrective movement. A further weekly close over 7565 is required to offer a continuing bullish view.
XJO DAILY
Price structure: Extended move confirmed.
The last three trading days have advanced on very low volume (holiday period). With the current extended move now a bullish corrective movement, a new retest lower could be expected as a follow on from last Fridays small range reversal bar. The Weekly (above) support level remains at 7565 with the important daily support level indicated at 7472 as the primary target on any follow through price movement lower.
Indicator: Relative Strength 14
The Relative strength Indicator (14) has turned lower into the close on Friday, as the Relative strength indicator continues to move above the 70 level, offering a strong bullish indication, the sideway movement of the indicator against the rising price now suggests a divergence sell signal is developing. The sell signal will be validated with a movement below the 70 level.
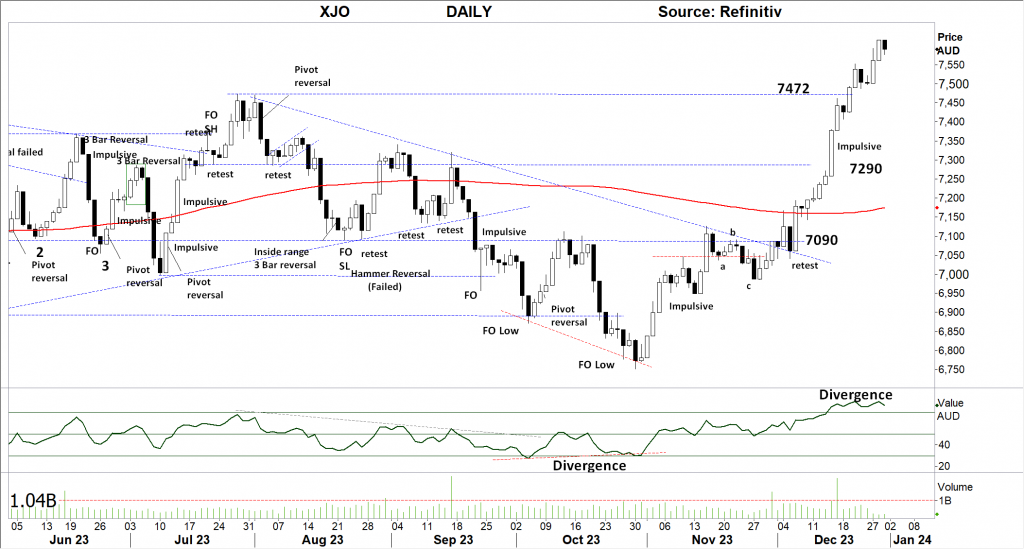
Comments last week: The XJO200 has again reclaimed the 200 day moving average, following the break above the 7090 level, significant Daily resistance levels remain, however the outside range set last Friday should follow through to the 7290 level. The Daily price movement have now entered into an UP Trend since the October low.
S&P 500 WEEKLY
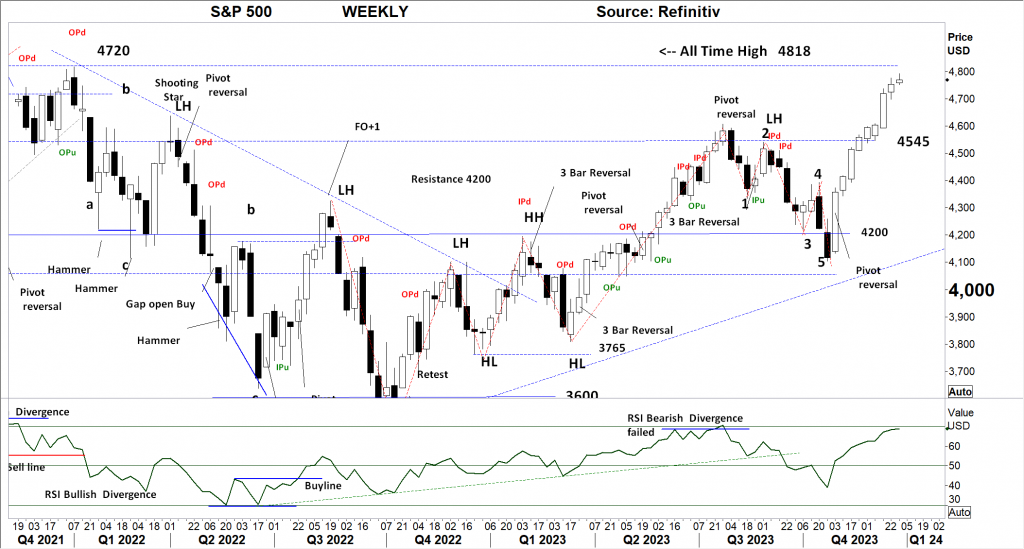
Price structure: breakout meets resistance level.
The retest of the 4818 level is being completed on short range (high to low) bars as the advance weakens. To remain bullish a close above the 4818 level must be completed on strong volume with a strong range week showing the buyers maintain full control. The 4545 level remains as the first significant support level for a retracement target.
Indicator: Relative Strength Indicator 14
Relative strength has again turned higher and moves above the 50 level towards the 70 level, but to remain bullish the RSI should remain over the 50 level with any underlying price advances. In the coming weeks this consolidation below the 4545 level may re-assert a bearish RSI signal as the Relative strength indicator turns lower.
Comments from last week:
The lndex closing tpast the highs of Q3 2023 and moving towards retesting the 2022 highs remains a very positive signal for a push to a new all-time high.
The 5-week momentum movement still remains at risk of now being an “over extended seasonal move”, the overall market remains at a level where profit taking may see a retracement back to the 4545 level and lower. In the current momentum move a further close over the 4800 level would be very bullish for a retest of the 4818 level and a further Christmas rally.
SPX DAILY
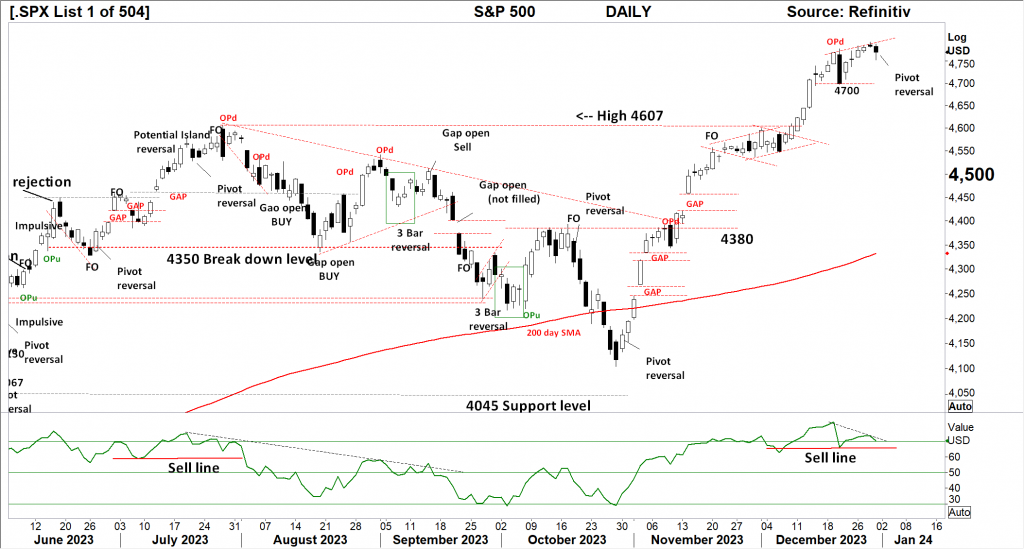
Price structure: Sell divergence.
The Opd of 2 weeks ago remains the dominant influence in this Daily view of the S&P 500. For the bullish the low of the OPd tested the 4700 level with an immediate reaction higher. Last Friday set a pivot reversal pattern, although the closing price was well off the low of the day.
Indicator: Relative Strength Indicator 14
Relative strength Indicator has moved into the 70 level indicating very strong momentum. Although not a signal of over brought, the current second and third movement into this over 70 level is often seen as a level to take profits. Currently a Sell divergence signal is being displayed with the market setting a new closing price high as the indicator sets a lower high, the sell signal line remains at the 67 level.
Comments from last week:
The small consolidation area currently forming, may show as a further breakout to test towards the 4818 level. A close below the 4600 level would be the first indication of profit taking. Traders can monitor this chart for reversal patterns in the form of an outside range down close (OPd) or a basic Pivot reversal pattern that would indicate a short term reversal. The move from the October low remains “corrective”. Further higher closes are required for true momentum breakout signal to occur.
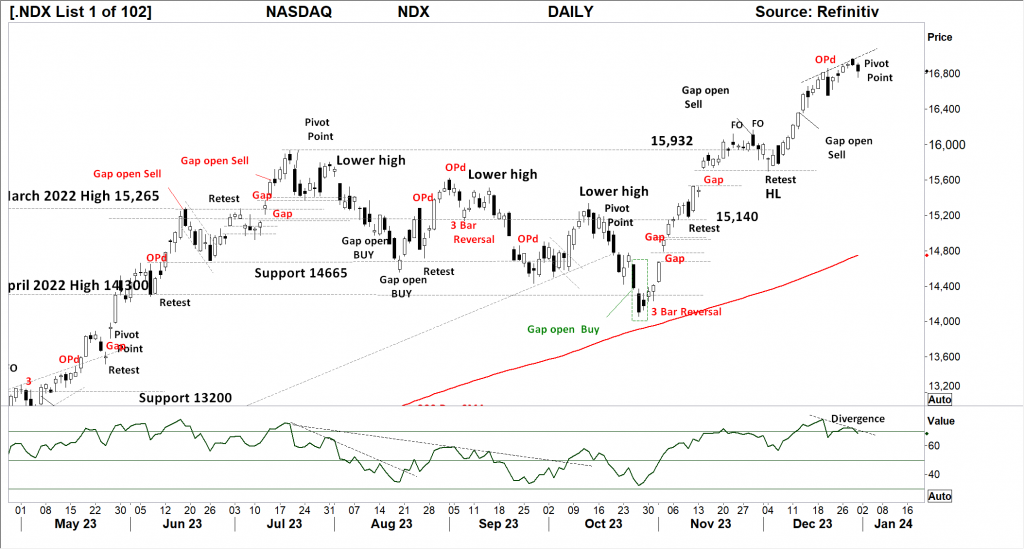
NASDAQ DAILY
Price structure: Sell divergence signal.
With the Index setting a new high following the OPd set 7 periods ago, the price ranges have become less decisive with q reverse pivot point being set last Friday. The Index remains vulnerable to profit taking with the first real support level shown at 15,932. The current underlying Primary trend remains UP. The Index remains “extended” from the 200 day moving average, with a potential top developing.
Indicator: Relative Strength 14
Relative strength has again moved to the 70 range, it remains an area to monitor for and exhaustion reversal..
The observance is the overall Relative strength is again falling as the underlying price movements of the Index move to set closing price highs. The RSI should now be monitored for a further turn lower indicating a change to negative momentum and completion of the divergence sell signal indicating a top in place.
Comments from last week:
Many unfilled Gaps remain in the current Nasdaq price advance from the October low. The Index has set a further “Gap open sell” signal, that remains a precursor signal to a price reversal should current price movement close back into this area.
USD Spot GOLD – DAILY: Bull Trap at the 5th High
The potential remains for a retest lower below the key $1982.0 level to $1960.0 The underlying Primary trend has been established as a bullish trend, only a close over the $2072 level with a follow through higher will give strong indication of a new bull market underway. In the short term the $2049 -50 level may provide some immediate support on profit taking at this level. This PM market remains at an inflection point for buyers, only further closes above the $2072 level would be deemed bullish.
Indicator: Relative Strength 14
The RSI turning lower from below the key 70 level, turning with the falling price, current consolidation in price with a breakout lower will move the indicator lower, a Relative strength reading below 50 indicates bearish momentum. Long term traders should continue to monitor this long term Daily chart for a 4th major yearly top in progress at $2072.0 with further declines in the long term.

Comments from last week:
Gold has again tested the $2049 level with a strong rally, that was immediately rejected to force the closing price below the $2049 new resistance level. The current short term trendline has been broken with the current close.
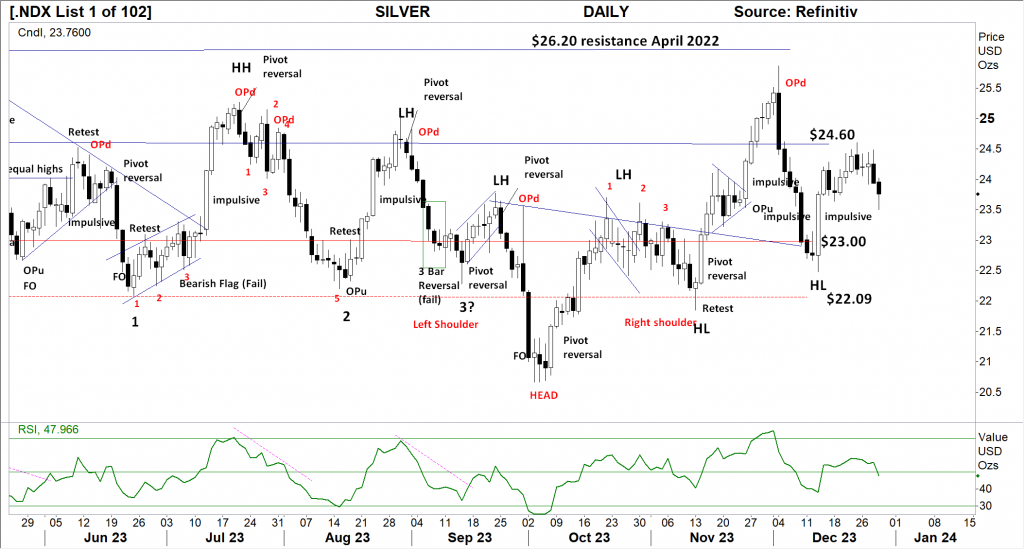
SILVER
Price structure: Head and Shoulder neckline retest remains.
Strong rejection (OPd) from below the $24.60 level to see an engulfing reversal decline towards the Head and shoulder neckline at $23.0. Last week saw another rejection at the $24.60 level, Silver remains within a broad trading range between $22.09 support and $26.20 resistance with no identifiable Primary trend.
Relative Strength 14
Current Relative strength has turned higher from below the 50 level to move sideways at this level, indicating momentum has turned neutral, if the RSI continues lower, the bearish momentum signal will show a continued price movement lower. Only a continued move higher would reflect a solid change in the underlying price momentum would alert to a potential new trend and breakout.
Comments from last week:
Strong rejection (OPd) from below the $24.60 level to see an engulfing reversal decline towards the Head and shoulder neckline at $23.0.
Silver remains within a broad trading range between $22.09 support and $26.20 resistance with no identifiable Primary trend. Last Wednesdays “impulsive range” is a strong reversal signal with the short term potential for a retest towards $24.60..
AUSTRALIAN VOLATILITY INDEX: The equities traders compass.
The current volatility closing value has moved above the 13 level, closing higher the XVI was within the “complacement” level. With the indicator now pushing higher the forward pricing of PUT options is now increasing, this is observed against a rising market indicating equity price movements may turn bearish as the cost of 3 month (insurance) Put Options is increasing (high demand).
For continued support of equities, the XVI should remain subdued below the “13” level.
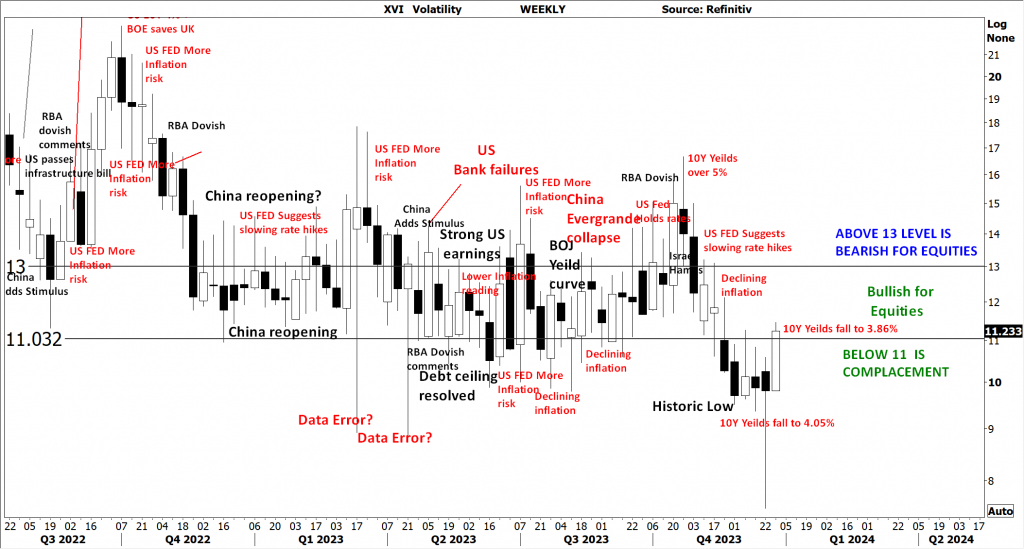
The XVI is the difference between 3-month forward pricing of ETO Options against current month. As markets anticipate events, the forward priced option volatility changes, hence as forward price changes, this “skew” in pricing is measured in this XVI. The XVI value works as an inverse observation to the underlying market.


 Access +10,000 financial
instruments
Access +10,000 financial
instruments