
XJO WEEKLY
Price structure: Fake out top
The underlying Primary trend remains UP, with current price action not indicating a meaningful reversal pattern until a close below 7632 takes place. Last week again set a fake out high (FO) where price has moved over a previous reversal high of 3 weeks prior. A weekly closing price below the 7853 level would indicate a top in place. The bigger picture indicates a Bearish wedge developing as the price range narrows.
Indicator: Relative Strength 14:
Relative Strength remains above the 50 level again as part of the overall directional move higher in price, and the higher turn may again cross the 70 level into a bullish signal. Only further movements towards the 70 level will remain a bullish signal for further gains; last week, the RSI value moved sideways in line with price consolidation. However, a new high is required over the late Q4-2023 high point. A new divergence signal may develop at this level.

Comments last week: Without follow-through lower from the previous week’s retest of the 7632 level, price action last week remains neutral until the recent high of 3 weeks ago is taken out with a close over 7853 points. The underlying Primary trend remains UP, with current price action not indicating a reversal pattern until a close below 7632 takes place. With economic strength in the recent employment numbers and a reasonable half-year reporting season completed, the index strength is strong with a substantial increase in the banks and the large industrial wesfarmers.
XJO DAILY
Price structure: Bullish breakout.
The Daily breakout on the last trading day of the month should be viewed as a window. Dressing for the quarter, with the potential to immediately reverse. Short declines are helpful within a trending market and offer many trading opportunities. The current “tentative” trendline remains intact and should be viewed as a potential support point in any future decline. A close below this line would give a bearish signal for a retest of the 7540 level. The index indicates that broader support may be developing at the smaller end of the 200 listed companies.
Indicator: Relative Strength 14:
The Relative Strength Indicator (14) turned higher into the close on Friday, as the Relative Strength Indicator had a swing higher to move towards the 70-level. A further turn higher on positive price movement would be expected. This is not the level at which traders would look for a further sell divergence, as the RSI has yet to cross the 70 level.
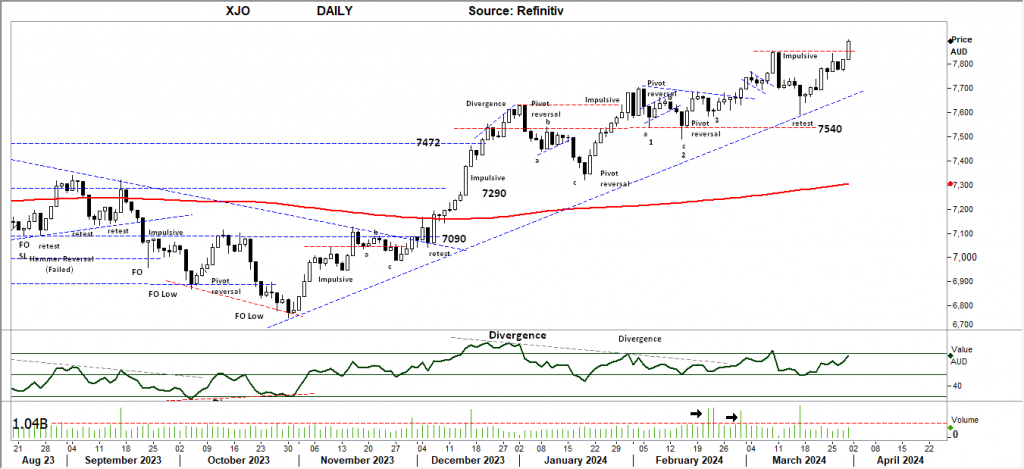
Comments last week: With the trendline broken and redrawn, it now has only 2 touches and remains “tentative.” The high close in last Friday’s price action is positive for further gains early this week. With many of the Index drivers down from recent highs, the index indicates that broader support may be developing at the smaller end of the 200 listed companies.
S&P 500 WEEKLY: Very Extended move.
The current weekly close adds to the already extended move underway. The short-term trendline could be monitored for the first breakdown level. The first Weekly support level remains at 4920. Historically, the third quarter is bearish for stocks, leading into the May period for more declines.
Indicator: Relative Strength Indicator 14
Relative strength has turned higher as the momentum indicator remains over the 70 level, but to remain a strong momentum signal, the RSI should continue a move over the 70 level with the underlying price advances. In the coming weeks, traders will monitor the RSI for a bearish divergence signal as any index price consolidation towards the 4818 level may re-assert a bearish RSI signal as the indicator will turn lower towards the 70 level and below.
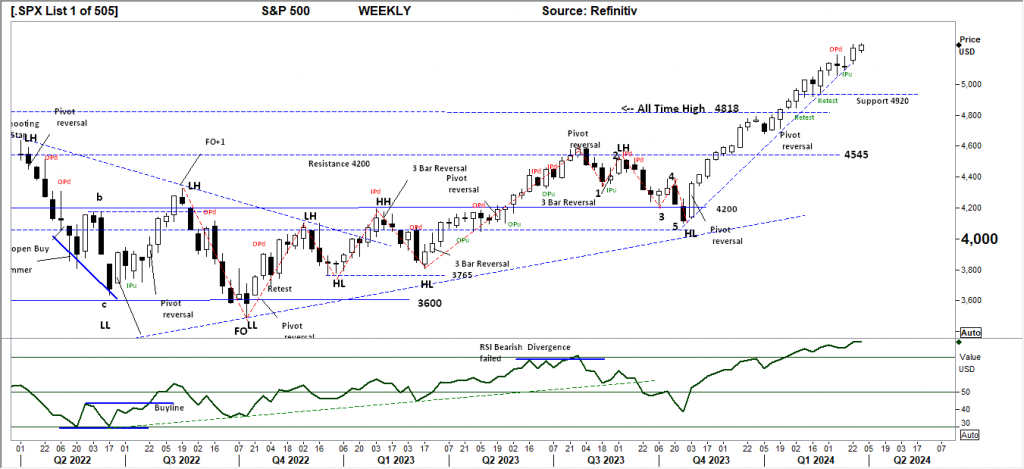
Comments from last week: A strong weekly range to set new highs with no meaningful price retracement since November 2023. This current extended move is at risk of a sharp profit-taking event. Traders entering the market at this level are buying into an extended move at risk of significant reversal.
SPX DAILY
Price structure: Consolidation
Overlapping consolidation in the shortened week has narrowed the “Wedge” pattern further. The potential for a decline into the 5000 point remains to fill the “Gap.” A close look at the price bars shows the Daily movement is a mixture of small range up closes and down closes, showing overall indecision from traders at this extended level.
Indicator: Relative Strength Indicator 14
The Relative Strength Indicator remains below the 70 level, indicating slowing momentum, and is currently turning lower. The recent second and third movement ( January – February) into this over 70 level is often seen as a level to take profits, as seen during July 2023 and December 2023. The potential Sell divergence signal has again developed, with the RSI line setting a new lower high.
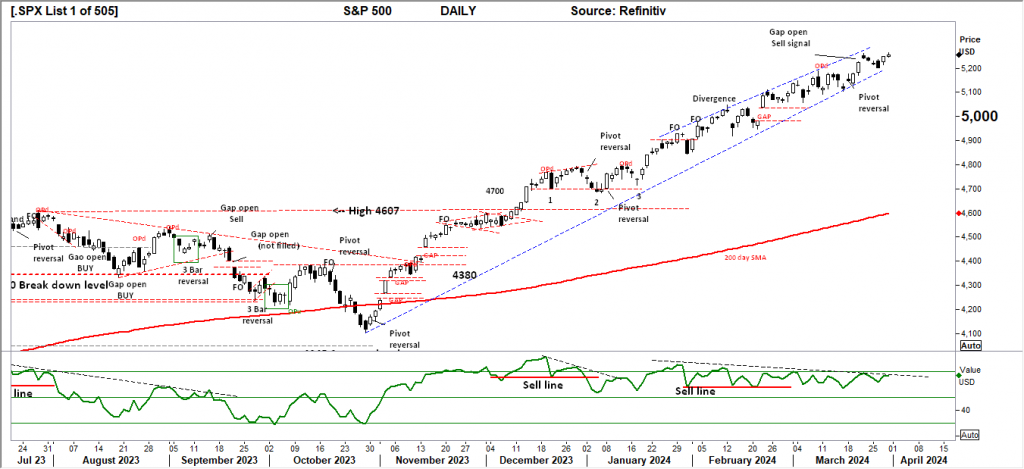
Comments from last week: The Daily chart now displays a “Gap open” sell signal. For the signal to complete a close under the low of last Wednesday’s breakout bar at 5171 points, this level would also break the short-term trendline in this long, narrowing wedge pattern. This is not the place to increase exposure, as a profit-taking event can happen very quickly.
NASDAQ DAILY
Price structure: Consolidation.
The Daily view of the Nasdaq shows further consolidation developing below the 18,428 level, with support developing at 17,790. Consolidation does not change trends but can offer some insight into the commitment of longer-term holders if a breakdown occurs lower in the support level. Seasonal weakness is ahead into the third Quarter.
Indicator: Relative Strength 14:
Relative Strength has moved sideways below the 70 level. The observation is that overall Relative strength has turned bearish for now. The failed fourth attempt to move over the 70 level is often a signal of exhaustion. The RSI should now be monitored for further movement lower below the 50 level indicating a change of momentum. This may provide some early insight into overall trend failure.

Comments from last week: Last week the Nasdaq set a Fake out (FO) to retest the OPd of 3 weeks prior, the FO bar is also the Gap open sell signal discussed in the S&P500 (above). Consolidation is developing above the “Gap” area. The current price range may persist between the OP high of 18416.0 and the “GAP” support level of 17790. Topping patterns can present 3 spike high points, 2 now completed with the OPd and last week’s FO retest of the highs. Without a real catalyst, the Nasdaq may continue to consolidate at these levels.
USD Spot GOLD – DAILY: Fake out top
Statistically, Fake Out (FO) type movements reverse with the next 1-3 trading periods. This type of FO has closed outside of the resistance point and has the potential to continue to set higher prices. Gold remains within a Primary UP trend with a valid short-term trendline now in place. This now sets the stage for further gains in the underlying gold equities market and offers traders an opportunity to participate in the current bullish run.
Indicator: Relative Strength 14
The RSI is turning sharply higher from below the key 70 level set earlier this month, with the reversal in price, this breakout higher has moved the indicator above the 70 level, but has not set a new high in line with price making a new high. The Relative Strength is now at risk of showing a bearish divergence signal. Long-term traders should continue to monitor this daily chart for a 5th major yearly top development at the $2240.0 level with further declines in the long term.

Comments from last week: The breakout discussed last week has occurred, but rejecting the $2218 price level resulted in a Fake out bar (FO) closing inside the previous high point of $2194, followed by further selling in the Friday session to set a Pivot point sell signal. The $2135 level remains the go-to support level that must hold to keep the buyers interested. Price is now clearly developing into a consolidation area above this important level, with 2 spike high points now in place. The risk is for a 3rd to develop, indicating a distribution top in place.
AUD Spot GOLD – DAILY: Impulsive move.
$AUD Gold set a new high on an impulsive move (large range), with $USD gold setting new highs while the $AUD remained stable at 0.6520 cents. This remains very bullish for local gold-producing companies. Australian Gold producers sell in Australian dollars. Based on the observations (above) in the $USD Gold price, the strong price movement remains at risk of decline.

Comments from last week: The AUD Gold price is based on the USD Gold price in Australian dollars, with both variables setting the $AUD price. With the rejection discussed in the $USD gold price (above), the potential is for a decline in this AUD price. Australian Gold producers sell in Australian dollars. Currently, the price remains strong, with all-time highs being offset by rising mine costs. Overall, the outlook remains positive.
SILVER
Price structure: Buy Pivot.
As Gold makes new highs, silver remains in the background, holding support at $24.60 and setting a pivot point (BUY) signal off support. Currently, the support level of $24.60 and the resistance level of $26.20 may provide a consolidation area for current price action. Many are calling for a Bull market in the PM, and technical traders will be aware Silver remains within a 2-year trading range. The close last week at the $25 level is a bullish signal for continuation this week, sentiment within the sector remains strong, and traders should look for buy opportunities.
Relative Strength 14:
Current Relative Strength has turned higher above the 50 level and reached the 70 level, indicating momentum has turned very Bullish. If the RSI continues higher, the earlier bullish divergence signal will give way to a strong Buy signal. Only a continued move higher and over the 70 levels would reflect a solid change in the underlying price momentum and should alert to a potential new trend and breakout.

Comments from last week: Silver has posted an OPd ( outside range) to retest the $24.60 level again, and technicians should also notice that the close on Friday was above this important level. The OP bar has a statistically high outcome of marking major swing points in price action. Currently, the support level of $24.60 and the resistance level of $26.20 may provide a consolidation area for current price action. Many are calling for a Bull market in the PM, technical traders will be aware Silver remains within a 2 year trading range.
AUSTRALIAN VOLATILITY INDEX: The equities traders compass.
The current volatility closing value has moved to close below the 11 level following a move towards the 13 level. The closing value indicates the XVI remains within the “complacent” level.
With the indicator moving higher early in the week, the forward pricing of PUT options (insurance) was increasing. This is observed against a rising market, indicating equity price movements may turn bearish as the cost of 3-month (insurance) Put Options is increasing, suggesting the market is moving to a protect profits mode.
For continued support of equities, the XVI should remain subdued below the “13” level.
The cost of 3-month forward PUT options is decreasing from recent elevated levels.
The XVI is the difference between the 3-month forward pricing of ETO Options against the current month. As markets anticipate events, the forward priced option volatility changes, hence as forward price changes, this “skew” in pricing is measured in this XVI.
The XVI value works as an inverse correlation to the underlying market.


 Access +10,000 financial
instruments
Access +10,000 financial
instruments