XAU/USD: A Trend-Follower’s Market
- Daily Analysis, Daily Report, Recent Posts, Technical Analysis, Trending Now
- April 25, 2024
Active Daily Support As can be seen from the daily chart of the AUD/NZD, the trend is evidently clear: it is to the downside: a series of lower lows and lower highs. However, we are at support from NZ$1.0587, a level delivering history as far back as early 2023. While buyers did step in from
READ MORE
Technically speaking, price action on the EUR/GBP cross has been rangebound since late 2016, which is evident on the monthly chart. However, what this ranging action has offered technical eyes is a potential Head and Shoulder’s Top pattern to work with between £0.9306, £0.9504 and £0.9066 (if you wanted to be more technical, you might
READ MORE
It was another all-time high (ATH) for the S&P 500, the Dow Jones Industrial Average and the Nasdaq 100 last week. The Nasdaq Composite Index, however, has yet to make the transition to unchartered territory, but it’s close. The latter, unlike the Nasdaq 100 which covers approximately 100 non-financial companies, covers a much broader range
READ MORE
Goldman Sachs Forecast Higher Prices for Gold The latest research out of Goldman Sachs forecasts that the price of gold will climb by 6.0% to $2,175 a troy ounce in the next 12 months. Among other factors, the research evidenced demand through central bank purchases and global geopolitical tensions. However, the authors also suggested that
READ MORE
BTC/USD etched out its first weekly loss in four weeks. However, is this enough to forecast a reversal to the downside? Weekly Resistance Welcomes Sellers We have clearly seen the major crypto pairing bump heads with sizeable resistance on the weekly timeframe at $51,952, a level boasting strong historical significance and sponsored by the Relative
READ MORE
USD/JPY at Familiar Long-Term Resistance The US dollar (USD) ended a second week in positive terrain against the Japanese yen (JPY), leading the USD/JPY currency pair back to familiar resistance on the monthly chart at ¥150.80. However, things are not looking too bright for USD/JPY bears at this point. On the one hand, the trend
READ MORE
The only way is up! No, this is not that old favourite from the late 90s. I am talking about major US cash equity indices. Global Risk-On Surge US equities gapped higher at the open on Thursday, strengthened by the blowout earnings for Q4 revenue from NVIDIA (NVDA) that encouraged a global bid across risk
READ MORE
With the recent upside in most major crypto pairings, it seems only fitting to look over Ripple’s technical price action against the US dollar (XRP/USD). Following a pullback from lows of $0.4856 in early February (off support at $0.4946), buyers and sellers have been squaring off at the underside of trendline resistance (extended from the
READ MORE
It has been quite the week for the UK. Tuesday welcomed UK wage data, which fell less than expected and illustrated sticky inflation. Headline wages (including bonuses) dipped to 5.8% (expected: 5.6%; previous: 6.7%) in the three months to December 2023, and pay that excludes bonuses also fell to 6.2% (expected: 6.0%; previous: 6.7%). Wednesday
READ MORE
It was a miss across the board for UK GDP growth, tipping the UK economy into technical recession territory. Two consecutive quarters of real GDP contracting is commonly viewed as a technical recession. According to the preliminary estimate for Q4 (2023) growth, real GDP contracted more than expected at -0.3% as per the Office for
READ MORE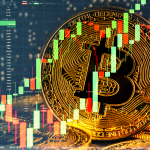
The price of Bitcoin has been on a tear against the US dollar recently. Week to date, BTC/USD has advanced nearly +9.0%, following last week’s +10.7% rally! $50,000 Cleared We did see the unit briefly make a pitstop at the underside of the $50,000 level on Tuesday, though sellers were reluctant to commit and concluded
READ MORE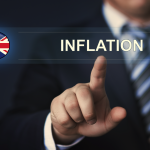
According to the Office for National Statistics (ONS), UK consumer prices steadied in January, with both headline and core inflation numbers matching prior months and undershooting economists’ estimates. In the twelve months to January, headline inflation rose 4.0% (expected: 4.2%; previous: 4.0%), and the core measure—excluding energy, food, alcohol and tobacco—came in at 5.1% (expected:
READ MORE


 Access +10,000 financial
instruments Auto open & close positions News & economic calendar Technical indicator & charts Many more tools included
Access +10,000 financial
instruments Auto open & close positions News & economic calendar Technical indicator & charts Many more tools included
By supplying your email you agree to FP Markets privacy policy and receive future marketing materials from FP Markets. You can unsubscribe at any time.
