What is Autochartist and
How Do You Use It When Trading?
What is
Autochartist and
How Do You Use
It When Trading?
Successful trading, whether in forex, commodities, stocks or indices, needs to be backed by robust analysis of the market and the conditions that affect its functioning. While fundamental analysis involves a thorough and continuous study of macro- and micro-economic factors affecting markets, technical analysis involves pattern recognition, based on previous price movements, to identify future trends.
These patterns play a key role in helping traders decide their entry points, setting stop loss orders or profit targets, and managing their portfolio.
However, it isn’t possible for every trader to master these skills or devote the required time to conduct a thorough analysis. Which is why traders use pattern recognition and scanning tools like
Autochartist, which automatically monitor the markets on their behalf. This software can easily be integrated with popular trading platforms, like MT4.
Here’s a look at the various types of patterns identified by Autochartist, its features and the benefits this tool offers.

What are the
Different Types of
Chart Patterns?
Technical analysis involves the study of market movements by identifying price and other patterns. The transitions between rising and falling trends are often identified by price patterns, helping in examining current movements and forecasting future moves.
Price patterns can be continuation patterns, which indicate a temporary interruption or pause of an existing trend, or reversal patterns, which signal a change in the prevailing trend. A third type of pattern is bilateral patterns, which indicate that the price could move either way or in other words the market is volatile.
Identifying price patterns is very useful when taking a trading position, especially when trading in CFDs or contracts for difference, which allows traders to go short as well as long. A trader may wish to sell during a bearish reversal or continuation, and buy during a bullish reversal or continuation, depending on what their analysis indicates.

Some useful chart patterns are:
1. Head and Shoulders: This type of chart pattern depicts a large peak, with slightly smaller peaks on either side. This pattern is generally used to predict a bullish-to-bearish reversal.
2. Double Top and Double Bottom: These patterns highlight trend reversal. While a double top is a bearish reversal pattern, a double bottom is a bullish reversal pattern.
3. Rounding Bottom: This chart pattern can signify a continuation of a trend or its reversal. Traders who identify this pattern, tend to buy midway around the bottom at the low point and then sell, once resistance is broken.
4. Cup and Handle: This bullish continuation pattern depicts a period of bearish sentiment, before the price moves up again.
5. Rising and Falling Wedges: These are reversal patterns, indicating a reversal of the market sentiment. While a rising wedge shows a trend line between two upwardly slanted lines of support and resistance, a falling wedge is a trend line between two downwardly sloping lines. A rising wedge indicates that the asset’s price will ultimately decline, when it breaks through the support line. On the other hand, a falling wedge generally indicates that the asset’s price will rise and break through the resistance level.
6. Flags or Pennant: These bilateral patterns show either the continuation or reversal of a trend and can, therefore, be either bullish or bearish. Although these appear similar to wedges, they are actually wider and always horizontal.
7. Triangles: While an ascending triangle is a bullish continuation pattern, a descending triangle signifies a bearish continuation of a downtrend. Another type of triangle pattern is the symmetrical pattern, which can be either bullish or bearish, depending on the market conditions, although it is definitely a continuation pattern.
All these patterns are highly useful indicators for understanding the movement of prices in the present and the future. Since these charts help identify the areas of support and resistance, they are highly useful in helping traders decide on whether to go long or short. But, as mentioned before, technical analysis is not everyone’s cup of tea. If that’s the case, then an automated tool like Autochartist can be a great help.

Fibonacci
Retracement
Technical analysts use another set of tools, called Fibonacci retracements, to draw support lines, identify resistance levels, set target prices and place stop loss orders. Fibonacci analysis can be applied when there is a noticeable upwards or downwards movement in price. It is believed that whenever an asset price moves up or down sharply, it tends to retrace its move, before its next move.
Fibonacci retracements are used to identify the level to which the retracement could occur, thereby providing traders a good opportunity to enter into new positions in the direction of the trend.
These patterns are based on key numbers, identified by Leonardo Fibonacci, a mathematician, and created by taking two extreme points (generally the peak and the trough on a price chart) and dividing the vertical distance by the Fibonacci ratios of 23.6%, 38.2%, 50%, 61.8%, and 100%.
These ratios are derived from the Fibonacci sequence of numbers that starts with zero and one and goes on by adding the previous two numbers: 0, 1, 1, 2, 3, 5, 8, 13, 21, 34, 55, 89, 144, etc. These retracements are very powerful, when used in conjunction with other technical indicators.
Harmonic ABCD
Pattern
We all know that the markets move in a rhythmic style and an ABCD pattern identifies the swings or trends that occur in this process. The pattern comprises 3 consecutive price swings or trends and looks like a lightning bolt on a price chart. Identifying this pattern helps traders decide when and where to enter and exit a trade. This pattern is useful for trading in all types of assets, over any timeframe, and in any type of market condition.
Identifying these patterns helps traders determine the risk vs. reward, prior to placing a trade. While a bullish pattern helps identify higher probability opportunities to buy, bearish patterns help identify opportunities to sell. Each turning point of this pattern, i.e. A, B, C and D, represent a significant high or low on a price chart. For both bullish and bearish versions of this chart, the lines AB and CD are called legs, while BC is called the correction or retracement.
Harmonic Patterns –
Butterfly and
Gartley
Another type of price pattern, used to predict future market movements, are harmonic patterns, which use Fibonacci numbers to define precise turning points. These trading patterns are based on the belief that trends are subdivided into smaller or larger waves that can be used to predict price direction.
The Gartley and Butterfly patterns are formed with 4 legs or price swings. In other words, they include the 3 legs of the ABCD pattern, plus an additional one. The additional leg allows that these two patterns offer higher probabilities for a reversal to occur.
While the Gartley Pattern is considered to be a retracement pattern, the Butterfly is an extension pattern. Both patterns are defined with the help of Fibonacci ratios.

What are the
Main
Features of
Autochartist?
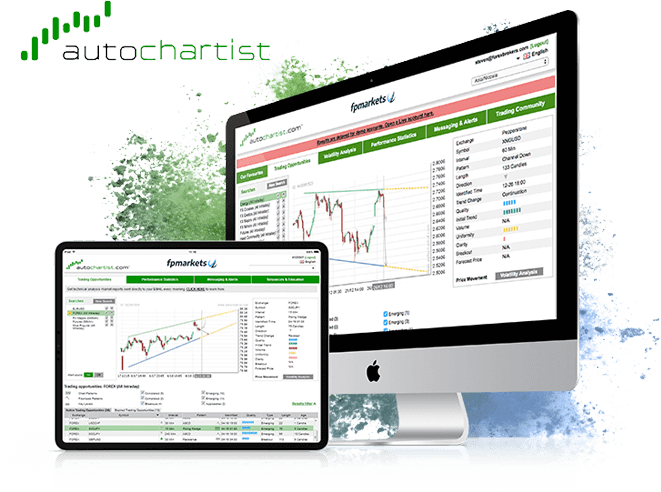
Autochartist is an advanced scanning tool that helps traders make informed trading decisions by continuously identifying chart and Fibonacci patterns. This tool allows users to filter different trading opportunities, by comparing their probability of success, after studying the patterns related to them.
This tool incorporates several features, like Powerstats, which offers traders significant statistical information about the instruments they wish to trade. It also assists traders in setting up stop loss or take profit positions, in accordance with their risk appetite. This tool is easily integrated with MetaTrader 4 and 5 and its advanced recognition engine is used to not only identify potential trading opportunities but also predict future price movements.
The main purpose of this tool is to provide users real-time insights into market movements and carry out technical analysis on their behalf. This software constantly scans the markets and provides users with price alerts, when a new opportunity comes up, keeping in mind the user’s preferences and trading strategy, based on support and resistance levels.

Support refers to a level at which an asset’s price stops falling and bounces back. Similarly, resistance refers to the level at which the price of an asset stops rising and starts declining. The appearance of these two levels is driven by the demand and supply for the asset.
When there are more buyers than sellers in the market, the price tends to rise. But there is a limit to what buyers are willing to pay and once that level is reached, buyers might close their positions. This creates resistance and the price starts declining till it reaches a level where buyers are willing to buy again (the support price). This drives the price back up towards resistance.
The Main Features of
Autochartist are:

Automated Technical Analysis with the Help of Algorithms
This highly useful software not only recognises the formation of various types of chart patterns, such as tops and bottoms, triangles and wedges, but also generates visual or audio alerts on their completion. Autochartist is capable of identifying all kinds of complex patterns, like butterfly formations, Ichimoku Cloud, Bollinger Bands and even Fibonacci retracement patterns, widely used by traders to set up support and resistance levels.

Customizable Search Pane
The software comes with a search pane that allows users to define market parametres to be used for searching. Users can tailor it to their individual trading style or even use it to get accustomed to newer markets.

Educational Resources
The software’s web interface comes with plenty of research and educational material, including articles, videos, eBooks, webinars and more. It also provides users with email alerts on the market outlook over the next two days or 48 hours.

Price Movement Scanner
Autochartist comes with a price movement scanner that highlights the price movement range on an hourly or daily basis to allow traders to understand price changes.

Volatility Analysis
The software comes with a volatility analysis function that helps chalk out expected volatility in the future, lets traders find out information such as the time of day at which markets are more volatile how to set appropriate exit levels, as well as how to select instruments which fall within acceptable risk parameters. This feature allows users to set realistic profit expectations, while remaining prepared to face the risks.

Built-in Economic Calendar
The software’s built-in economic calendar allows traders to stay updated on economic releases and news that could affect the price movement of their assets.
Why Traders Use Autochartist
As mentioned earlier, technical analysis requires a lot of time and effort. It may not be possible for every trader to understand and identify the complex patterns formed by the price trends manually. But that does not mean that they cannot trade. In these situations, software that does the groundwork, in accordance with a trader’s overall strategy, and allows the identification of key buy and sell points, is highly useful.
Autochartist does exactly that. It incorporates easy to understand, powerful market scanning tools that highlight the best trade opportunities, thereby helping traders to make quick but informed decisions. The benefits of using this tool are:
It helps even new traders to find trading opportunities, in real time, across all types of markets, including forex, commodities and indices.
Autochartist anticipates price ranges of various instruments in the near future, allowing traders to modify their strategy to take advantage of the changes in the market. Historical price trends are used to predict upward or downward momentum, allowing traders to make informed decisions.
Detailed performance statistics to review which trade setups worked and which one's did not over a defined period.
It displays identified signals directly on the price chart, allowing traders to conduct their own analysis as well, before deciding on whether to trade an Autochartist signal or not.
The combined information about chart patterns, support and resistance levels and future price movements allow traders to decide their stop loss or take profit levels. A stop loss order is placed with the broker to buy or sell once the asset reaches a certain price. It is designed to limit losses on a position. Similarly, take profit is an order that allows profit to be locked in at a certain amount. So, when the price of the instrument being traded reaches the specified price level, the position is closed automatically.
The trading opportunities identified are based on trusted theories and visually represented price graphs that are simple to evaluate and understand.
It saves a lot of time, allowing traders to concentrate on other aspects of trading. Technical analysis and chart pattern recognition require a lot of skill and time, which traders can save with this software.

It offers excellent pattern recognition capabilities. Autochartist can analyse a host of technical indicators, including different kinds of candlestick chart patterns, using the Ichimoku cloud, Bollinger bands and Fibonacci retracements:
1. Ichimoku Cloud is a collection of technical indicators that shows support and resistance levels, besides momentum and trend direction. This is done by taking multiple averages and plotting them on the chart. These figures are also used to compute a cloud, used for forecasting support and resistance levels in the future.
2. Bollinger Bands are another type of technical analysis tool that includes a volatility indicator to measure the relative high or low of an asset’s price, in relation to previous trades. The volatility level is measured through standard deviation. The bands widen when there is a price increase and narrow when there is a price decrease.
3. Fibonnaci Retracements are used to identify support and resistance levels that can be used to target price objectives.
Autochartist is a highly flexible product due to its ability to highlight thousands of potential trades in a wide range of financial markets, such as forex, commodities, metals, indices, stocks, CFDs and futures, in a single day.
It comes with visual quality indicators that allow new and novice traders better ability to interpret patterns, while allowing more experienced traders to perform advanced search functions.
Its PowerStats feature provides traders important statistical information about the instruments they trade in. This information is highly suitable for setting up stop-loss and take-profit levels, since it provides traders a better assessment of the risk and volatility involved.
Autochartist can be easily linked to established platforms, like MT4.

How to Use
Autochartist MT4?
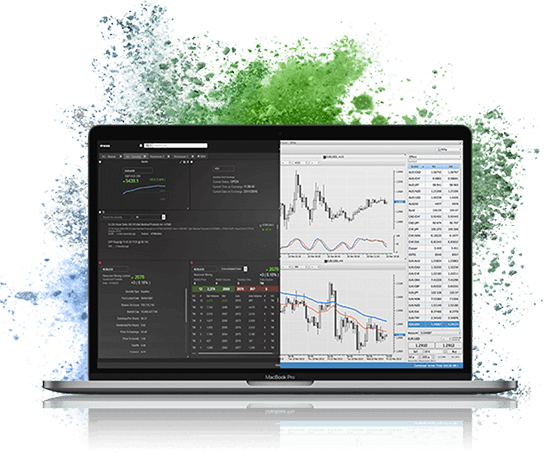
One of the best things about Autochartist is that it integrates with MT4, the most widely used trading platform in the world. Most forex brokers integrate this software automatically with their MT4 platform. However, if your forex broker does not offer this trading tool, it can easily be downloaded and installed directly. The process requires downloading of an MT4 plugin and double clicking of the installation to select the language. It will then be installed into the MT4 file on your computer. Autochartist MT4 plugin Identifies the best technical charting set ups on all available currency pairs.
In case your broker is using MT5, you need to add the Autochartist URL into the “Allow for WebRequest” for listed URL field in the Expert Advisor or EA options configuration window. Once this is done,
Autochartist will be available under the EA window. The next step is to drag and drop the tool’s web indicator directly on your trading platform.
You can then launch the application automatically in a new window, with no need to sign-in again.

Who Can Use
Autochartist?
Since the software covers most financial markets, while automatically determining technical chart pattern formations and clearly illustrating the support and resistance levels, it can be used both by intraday and swing traders. Autochartist can be used by beginners, since it allows them to incorporate and use technical analysis for their trading decisions. On the other hand, experienced traders can benefit from large volumes of information being scanned to identify trading opportunities.

Traders can use the Fibonacci, ABCD and other patterns or the Butterfly and Gartley formations identified by this tool to set up stop-loss levels and identify trade objectives. The tool also informs traders when a particular price either approaches or breakout key levels identified by it.
Traders can also use the tool’s PowerStats feature to formulate new trading plans, besides revising existing strategies. The feature provides:
1. The average movement of pips in particular time frames.
2. The potential for upside or downside momentum, based on previous history.
3. Statistical highs and lows across diverse timeframes.
4. Price moves anticipated over the weekday and even hourly timeframes.
Users can identify risk instruments through this feature, while also setting up stop loss and take profit orders. They can also go through and use the information provided in the various daily market reports, generated after the analysis of various charts and patterns, to make future trading decisions.
So, this tool can provide traders a lot of information and analysis that can aid their trade decisions. The only thing that Autochartist does not do is execute decisions on the trader’s behalf. But total reliance on any software for trading decisions is not recommended. It is best to rely on Autochartist to do the basic leg work for you, but trading decisions should be made in accordance with your own strategies and risk tolerance.
 Access 10,000+ financial instruments
 Auto open & close positions
 News & economic calendar
 Technical indicators & charts
 Many more tools included
By supplying your email you agree to FP Markets privacy policy and receive future marketing materials from FP Markets. You can unsubscribe at any time.
Source - database | Page ID - 20016