Some useful chart patterns are:
1. Head and Shoulders: This type
of chart pattern depicts a large peak, with slightly smaller peaks on either side. This pattern
is generally used to predict a bullish-to-bearish reversal.
2. Double Top and Double Bottom:
These patterns highlight trend reversal. While a double top is a bearish reversal pattern, a
double bottom is a bullish reversal pattern.
3. Rounding Bottom: This chart
pattern can signify a continuation of a trend or its reversal. Traders who identify this
pattern, tend to buy midway around the bottom at the low point and then sell, once resistance is
broken.
4. Cup and Handle: This bullish
continuation pattern depicts a period of bearish sentiment, before the price moves up again.
5. Rising and Falling Wedges:
These are reversal patterns, indicating a reversal of the market sentiment. While a rising wedge
shows a trend line between two upwardly slanted lines of support and resistance, a falling wedge
is a trend line between two downwardly sloping lines. A rising wedge indicates that the asset’s
price will ultimately decline, when it breaks through the support line. On the other hand, a
falling wedge generally indicates that the asset’s price will rise and break through the
resistance level.
6. Flags or Pennant: These
bilateral patterns show either the continuation or reversal of a trend and can, therefore, be
either bullish or bearish. Although these appear similar to wedges, they are actually wider and
always horizontal.
7. Triangles: While an ascending
triangle is a bullish continuation pattern, a descending triangle signifies a bearish
continuation of a downtrend. Another type of triangle pattern is the symmetrical pattern, which
can be either bullish or bearish, depending on the market conditions, although it is definitely
a continuation pattern.
All these patterns are highly useful indicators for understanding the
movement of prices in the present and the future. Since these charts help identify the areas of
support and resistance, they are highly useful in helping traders decide on whether to go long
or short. But, as mentioned before, technical analysis is not everyone’s cup of tea. If that’s
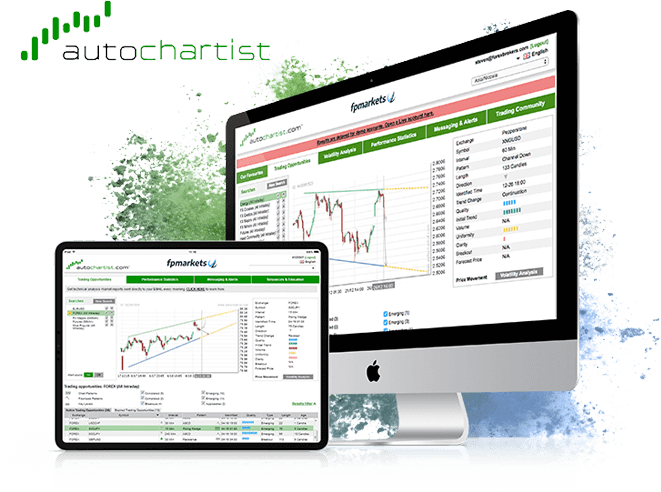
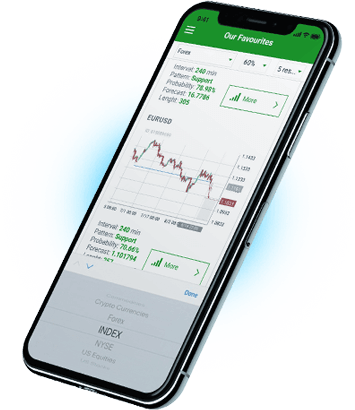
the case, then an automated tool like Autochartist can be a great help.


 Accede a más de 10.000 instrumentos financieros