Experience Trading
on the Go
on the Go
How to Buy and
Trade Shares?
How to Buy and Trade Shares?
The stock market offers plenty of opportunities to get exposure to particular industries and the global economy. Shares, stocks and equities are terms that are used interchangeably in this financial market, to denote units of ownership in companies or shareholdings. The total ownership stake in the company, after all debts are repaid, is equity, while shares or stocks are used to denote a single unit of ownership. Shareholders have rights to gain a part of the company’s earnings in cases where a dividend is paid. Shareholders may also have voting rights.
If you are interested in buying and/or trading shares, here are three basic steps:
Choose to Own Shares or Trade Them
You can buy shares outright in a long-term investment strategy or you could speculate on their prices, using derivative products like Contracts for Difference (CFDs) that reflect the value of the underlying asset, stocks in this case.
Decide on Which Shares to Trade
You can choose to trade Australian shares on the Australian Securities Exchange (ASX) or gain global exposure and trade across multiple stocks on everything from blue chips and small caps, to dividends and tech stocks. You can also trade through equity indices that track the broader stock market or a particular sector.
Open a Live Account
Open a live account to start trading shares.
Here’s a detailed guide to how to buy and trade shares.
How does the
Stock Market Work?
The stock markets operate like auction houses. They facilitate interaction between buyers and sellers, to negotiate prices and make trades. The global market works through a network of exchanges. Some of the most popular names among these are the New York Stock Exchange (NYSE) and the London Stock Exchange (LSE).
Companies list their shares on exchanges through an Initial Public Offering (IPOs), in an effort to raise capital for business expansion or other purposes. Once the stock is public, investors can start buying or trading shares. Traders buy and sell these stocks among each other, and the exchange keeps track of the supply and demand of listed stocks.
Stock prices are determined through these supply-demand factors. Buyers offer a “bid price,” which is the highest amount they are willing to pay for a share, while sellers offer an “ask price,” which is the amount they are willing to accept for the share. So, if you want to buy a stock, you need to look at the ask price and if you want to sell shares, you will have to deal with the bid price. The difference between these two specified prices is the bid-ask spread.
In stock exchanges, information on share prices and pending volume at each price point is available publicly through “order books.” You can gain access to these exchange order books, if your broker provides you a Direct Market Access (DMA) pricing model. This ensures you have price transparency and the ability to execute trades precisely. In Australia, buy orders and sell orders are allowed to overlap in the stock market’s pre-open and pre-close phases. Computer algorithms are involved in calculations that match these orders to determine the opening and closing prices. With a DMA broker, you can gain access to both these market phases and the liquidity associated with them.
Investors who expect a company to see strong growth, will buy (go long) shares, hoping to sell them at a later date at a higher price. Conversely, investors who expect a company to perform poorly going forward could sell their shares and take a profit.
Today, investors buy shares online through investment accounts or through brokers. You need to register with a stock exchange for direct exchange trading, which is why most people prefer to trade through online brokers.
Why Buy Shares
Directly?
Shares, although risky, have historically provided better returns in the long term than many other asset classes, such as cash, bonds or the housing market. According to the 2020 Credit Suisse Global Investment Returns Yearbook, the Australian stock market has provided the highest returns (real annual returns higher than 6.5%) since 1900, as compared to equities listed on indices in the US and Europe.
Even in falling markets worldwide, there has historically been support once stocks decline around 25% to 30% from their peak. In three to six months after sharp corrections, the share markets tend to rebound.
So, if you buy shares directly from the stock market, there is a chance you can sell them off later at a high price. This is based on the popular trading strategy of “buying low and selling high,” called “going long.” This is a way to contribute to your long-term investments. Moreover, you will also have the right to receive dividend payments, even if the company’s share price declines. Dividends can be further invested in other assets to create a diversified portfolio, or they can be re-invested in shares or funds, which creates compounded dividend returns.

Why Trade
Shares?
Rather than just buying or owning shares, you could speculate on their price movements through derivative instruments like Contracts for Difference (CFDs). When you trade share CFDs, you do not require direct ownership of any shares. This means that you can open a position at a fraction of the cost of owning the asset. In addition, CFDs allow you to take positions in both rising and falling markets. You can hold positions in the short and medium term, while taking advantage of small price increments in share prices.
Choose a broker with whom you can start trading CFDs on leveraged trading accounts and competitive financing rates. This means when you trade, you don’t have to put the full value of the position you are trading but pay a small deposit to cover any potential loss while trading. This is called “margin” and it is a fraction of the full contract value. Leverage allows you to gain more than what you could afford with your own capital. However, note that losses are magnified too, if the markets move in the wrong direction. With the ability to go both long and short in all market conditions, you could speculate on price movements of companies located anywhere in the world.
Here are two examples to illustrate this point.
Opening a
Long Position
with CFDs
Suppose you want to trade shares of XYZ Company. You want to open a long position, since your analysis indicates that the shares will appreciate.
Now, XYZ is trading at a sell/buy price of AUD 159/ AUD 160. You want to buy 100 share CFD units. The margin rate is 3%, which means you have to deposit only 3% of the total position value as the initial margin.
Here, your initial margin will be: (3% X (100 x 160)) = AUD 480.
Now suppose, the price moves in your favour to 165/166, and you decide to close the position by selling at 165, which is the current sell price.
The price has moved 5 points (165-160) in your favour. So, your total earnings would be 100 X 165 = AUD 16,500 and your gross profit would be 100 x 5 = AUD 500.
Your gross profit minus the commission will be your net profit.
If the price had moved to 156/157, your loss would be 100 x (156-160) = - AUD 400.
Opening a
Short Position
with CFDs
Suppose you wish to trade shares of XYZ Company, and your analysis tells you that the share price is likely to decline. Assume you are selling 100 share CFD units.
The sell/buy price of XYZ is AUD 150/ AUD 152, and the margin rate is 3%.
So, your initial margin would be (3% x (100 x 150)) = AUD 450.
Suppose your prediction is right and the price declines to AUD 140/ AUD 142. You decide to close your trade by buying back at the new buy price of AUD 142.
The price has moved (150-142) = 8 points in your favour. So, your gross profit here would be 100 x 8= AUD 800.
CFDs are flexible investment assets and offer plenty of advantages.
What are the
Advantages of
Trading Equity CFDs?

Margin Trading
CFDs are leveraged
products, so you only need to deposit a percentage of your total position. So, a smaller
amount gives you high market exposure. With a smaller cost per trade, you can aim for
greater returns. However, the potential for losses are equally magnified, due to the higher
exposure.
Potential to Trade in Rising and Falling
Markets
CFD trading is based on the price movement of an asset and doesn’t
require physical ownership of the asset. So, investors can go short in falling market
conditions. Physical shares, on the other hand, can be shorted only through a traditional
stockbroker, who would charge additional fees on top of brokerage fees.
Multi-Market Access from a Single
Account
The best full-service brokers allow you to open a CFD account that can
be used to assume positions in various markets, including forex, commodities, metal, indices and cryptocurrencies. This is a great way to diversify
your portfolio.
Tax Benefits
If you sell your shares
directly, you would be required to pay tax on capital gains. With CFDs, you can avoid paying
stamp duties and trading costs will be limited to the margin and spread.
Hedging Physical Shares with CFD Short
Selling
CFD trading provides you opportunities to hedge your portfolio against
short-term market volatility. Losses in your equity portfolio will be offset through short
positions in CFDs.
No Fixed Expiry Date and Contract
Size
You can choose to trade in any number of shares and there is no fixed
expiry date for contracts.

How to
Create a
Share Trading Plan?
To start trading in the stock market, you need a well-defined trading plan, so that you can define the parametres of an ideal trade (based upon your risk appetite) and also make logical decisions rather than emotional ones.
Here are some steps that can help build a trading plan.
1. Define Your
Trading
Objective
Decide on your trading goals and why you want to become a trader. Ask yourself these questions:
Why do I want to become a trader?
Do I understand the stock market well enough to start trading?
Do I have the skills required to be a trader?
Am I looking for passive income or do I actively want to trade?
How much time am I willing to commit to trading?
Do I want to trade in physical shares/indices or equity/indices CFDs?
2. Determine Your Risk/Reward Profile
Set the risk level you are comfortable with. Understand the fees and charges included in trading and based on that, decide on your position sizes. Leveraged trading includes significant risks, and you could lose all your account capital. It is considered prudent to not risk more than 2% to 3% of your trading capital. Your risk-reward profile will determine your:
Profit goals
Stop loss/ take profit strategies
Trading style
Account capital
Type of assets you want to trade
Leverage ratio
Trading frequency
3. Assess Your
Market
Knowledge
Evaluate your knowledge about the asset class you want to trade. Learn how stock exchanges work and how indices can track them broadly. Consider the market opening and closing hours, and the usual level of volatility. You also need to research broker profiles and choose one that suits your trading personality. Some common terms you need to be familiar with are:
4. Choose a
Trading Style
Based on your risk/reward profile and your expertise, you will need to choose a trading style. Your trading style will also be based on your personality, trading goals, time-frame commitment towards trading and attitude towards risk. Here are some common trading styles:
1. Day Trading: This involves buying and selling of shares on the same day. Positions are not held overnight.
2. Swing Trading: Price volatility ensues when a trend breaks and the new trends try to establish itself. Swing traders try to capture the price swings in this interval. Traders can hold positions for several business days or weeks to capture the medium-term market movements.
3. Position Trading: Traders hold positions for the long-term, anywhere between a few weeks to a few months and even years, depending on the current trend. Trend traders jump on an ongoing trend and exit positions when the trend breaks.
4. Scalping: A highly short-term trading strategy, traders enter and exit several trades in a day in an attempt to accumulate small profits that can lead to a considerable gain at the end of the day. Scalping is a risky strategy, usually taken up by experienced traders.

5. Maintain a
Trading Diary
Document your trades in a journal, so that you can understand your successes and mistakes. Create a detailed trading strategy with the entry point, exit point, position size, leverage and the rationale behind your investment decisions. This could be based on a technical indicator strategy or an emotion. The more detailed your diary is, the greater will be the scope of learning from your trades and not repeating mistakes.
It is a good idea to stick to your trading plan, in order to maintain discipline and objectivity while trading.

What is Technical
Analysis in
the
Stock Market?
Traders study historical market data, including stock prices and volumes, to predict future price trends and pick the right shares to trade accordingly. Technical analysis is based on the premise that market trends tend to repeat. Each stock chart has a unique trend and prices move only within the trend.
By using charts, patterns and indicators, traders attempt to predict the start of price trends, their end and consolidation, to place entry/exit positions in both short-term and long-term strategies.
Platforms like MT4 and MT5 have multiple technical indicators, chart frames, analytical objects and more to help traders make informed decisions. Moreover, traders can customise these indicators according to their style and preferences, for satisfying trading experiences. These statistical tools can be grouped into:
Trend indicators
Volume indicators
Volatility indicators
Momentum indicators
What is Fundamental
Analysis in the
Equity Market?
Fundamental analysis tries to determine whether a stock is valued correctly within the overall market. The intrinsic value of shares can be measured by studying related economic and financial factors. This includes macro-economic factors like the state of the country’s economy and a particular industry, as well as micro-economic factors, such as the company’s earnings report, press releases or new product launches.
If analysts find that the current value of a stock is higher than the current market price, they may say that the stock is undervalued and recommend a “buy” rating. Similarly, if analysts find the current value of stock is lower than the current market price, the stock is considered overvalued, in which case a “sell” recommendation might be issued. Some common reports used for fundamental analysis of shares are:
Company’s return on equity ratio
Revenue reports
Earnings Report
Profit Margin ratio
Economic Indicators like GDP, Interest Rates, Unemployment Data, CPI, PPI and more
Remember, successful traders continue to learn and grow. They use every failure as a learning opportunity, to fine tune their trading strategy. This is why they start with a demo account, to familiarise themselves with the market and the platform, before investing any real money in it.
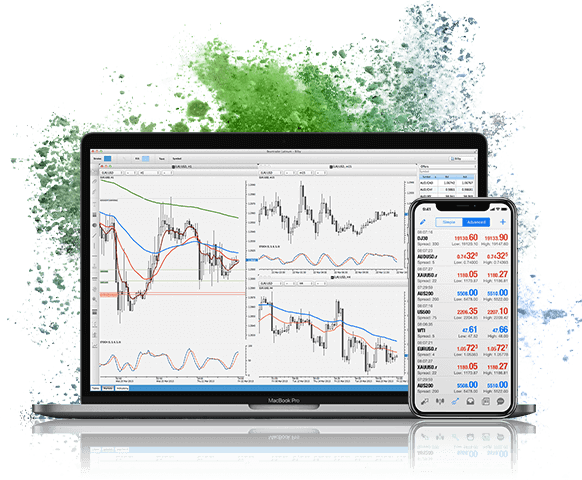
 Access 10,000+ financial instruments Auto open & close positions News & economic calendar Technical indicators & charts Many more tools included
By supplying your email you agree to FP Markets privacy policy and receive future marketing materials from FP Markets. You can unsubscribe at any time.
Source - cache | Page ID - 944
