Forex Spreads

MENU

What is Spread in Forex?

Forex or foreign exchange, is the most widely traded market in the world, boasting a daily turnover of more than $US7 trillion per day. One of the ways you pay for the opportunity to trade in the Forex market is through the broker’s spreads, or the difference between the bid and ask prices, commonly referred to as the bid/ask spread. Consequently, the size of the spread is important: a small spread reduces trading costs and a larger spread increases cost.

FP Markets works with a diverse liquidity mix. Partnerships with leading banking and non-banking financial institutions are key in consistently delivering tight spreads to our traders, beginning as low as 0.0 pips.

Click on a Product to View Our Typical Spreads

Spreads Affect Your Trades

Successful traders are always mindful of any changes in the spread, with some traders, specifically shorter-term traders, such as scalpers and day traders, potentially basing trading decisions on such changes.

High Spreads:

When the difference between the bid and ask prices is higher than usual, it could either indicate a period of low liquidity or high market volatility. For instance, non-major Forex pairs, often called ‘minor’ or ‘cross’ currency pairs, frequently reflect a higher spread than major pairs due to less liquidity, as minor currency pairs are not as widely traded as major currency pairs.

Low Spreads:

When the difference between the bid and ask prices is lower than usual, it could indicate high liquidity or a period of low market volatility. During major liquid Forex sessions like London and New York, you often experience lower spreads (particularly across major currency pairs).

What is Spread in Forex?

Spread in Forex is the difference between the bid price and the ask price: the bid/ask spread of a currency pair. The Spread cost is measured in 'pips' or ‘points’ and represents the primary cost of trading. Popular currency pairs—think major currency pairs, such as the EUR/USD and AUD/USD—have lower spreads as a result of higher levels of liquidity. An in-depth explanation can be found in our Beginner's Guide to Forex Trading.


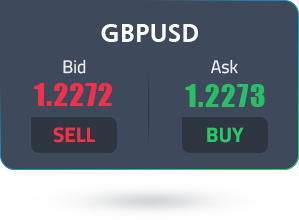
The bid price is the ‘quote price’ a trader or investor can sell at (located on the left side of the quotation), and the ask price is the quote price a trader/investor can buy at (located on the right side of the quotation). We can also think about it from a liquidity provider’s point of view: the bid price is willing buyers standing ready to receive sell orders (from traders), and the ask price represents willing sellers that are prepared to sell to buyers (buy orders from traders). This concept is fundamental to understand.


If the bid/ask rate for the EUR/USD currency pair is $1.1251/$1.1252, this means you can effectively buy 1 unit of EUR at a higher ask price of $1.1252 and sell it lower at the bid of $1.1251. The euro (EUR) is the base currency, and the US dollar (USD) is the quote currency (or term currency).


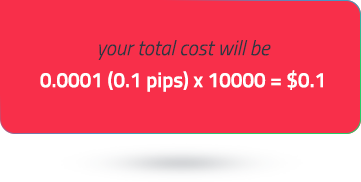
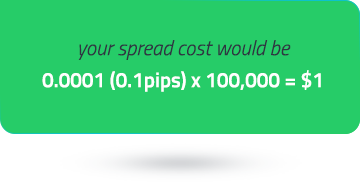
In the above example, the spread in pips—the difference between the bid and ask prices—is 0.0001 = ($1.1252 - $1.1251). The pip value, in this example, is priced to the 4th decimal place and represents 1 pip (if priced to the 5th decimal, you would see the following: 0.00010 = [$1.12520 - $1.12510]). Remember that a pip is an abbreviation for ‘percentage in point’, equivalent to 1/100 of 1% and is the smallest WHOLE unit a currency pair can move.


The current bid and ask prices are the price levels that traders can engage (trade) with the market immediately or ‘on the spot’. The ask price will always usually be slightly higher than the underlying market price, whereas the bid price is slightly below the underlying market price.


The size of the spread plays a pivotal part in Forex trading. This is particularly the case for those using trading strategies that conduct a large number of transactions in a single trading session. Trading volume, liquidity, market volatility, news, and time can all impact spreads. The spread can affect profit as spreads can widen considerably when the financial markets are volatile and cause slippage (filled at a price different from the requested fill price).


Fixed and Variable Spreads

It is important to understand the difference between fixed and variable spreads. Fixed spreads remain the same, no matter the market conditions. Variable spreads keep changing based on the supply and demand of the instruments and the overall market volatility. Choosing the optimal spread type is important to keeping trading costs to a minimum. Retail traders who trade less frequently could benefit from fixed spreads, while those who trade frequently during peak market hours (when the spreads are the tightest) might prefer variable spreads. Variable spreads are normally lower than fixed spreads, especially in calmer markets.


Trading with an FP Markets RAW account opens the door to some of the lowest spreads in the market. Our liquidity is sourced from some of the largest liquidity providers, with no markup applied. This gives us the ability to offer you the tightest spreads, starting as low as 0.0 pips during the most liquid times, something that was previously the domain of hedge funds only.


The spread of a given currency pair reveals information about market conditions such as time, volatility and liquidity. Emerging currency pairs have a greater spread than major currency pairs due to lower levels of liquidity. Interestingly, it is worth pointing out that only 8 major currencies account for approximately 85% of the Forex market turnover.


Forex Broker Spreads and Pip Value

Currency spreads are quoted in terms of two different prices: bid and ask price. The bid price is the price at which you can sell the base currency, while the ask price is the price at which you can buy the base currency.

gbp usd bid and ask prices

As an example, if the bid/ask rate for the GBP/USD is $1.2272/$1.2273, a trader can enter long the pound at the ask price of $1.2273 and short from the bid price of $1.2272. And the difference between these two prices is the bid/ask spread: the Forex spread, which, in this case, would be 1 pip, or 0.0001. As a reminder, this is found by taking the difference between the ask rate and bid rate.

Calculating the total pip value will differ depending on the currency pair, the account currency denomination and the units traded. Let’s assume the account is traded in USD, and the currency pair is EUR/USD (the account currency is the same as the quote currency).

If you are trading a 10,000-unit trade for the EUR/USD (1 Mini-Lot), the pip value, or ‘initial spread cost’, would be 1 USD = (0.0001 * 10,000 units).

If you are trading a Standard Lot (100,000 units of the base currency), your pip value or ‘initial spread cost’, would be 10 USD = (0.0001 * 100,000 units).

However, trading an account currency that matches the base currency involves dividing the pip value (usually 0.0001 with most currency pairs) by the currency pair’s exchange rate, then multiplying the resulting value by the units traded. For example, assume an account traded in GBP, and you’re trading GBP/USD. We would divide 0.0001 by the GBP/USD exchange rate: $1.2409 and multiply the resulting value by 100,000 units (trading 1 Standard Lot) to equal 8.06 GBP (rounded). So, 8.06 GBP is your pip value.

On the other hand, trading an account currency different from the currency pair traded involves substituting the account currency for the base currency. We would then divide the pip value (0.0001) by the substitute exchange rate and multiply this value by the units traded. For example, you trade with an account denominated in GBP and trade the USD/CHF currency pair. The first step involves locating the GBP/CHF exchange rate: CHF1.1149. We then divide 0.0001 by 1.1149 and multiply the resulting value by 100,000 units (assuming you are trading 1 Standard Lot) to produce a pip value of 8.97 GBP (rounded).

Understanding High and Low Forex Spreads

It is important to be aware that FX spreads can (and do) fluctuate throughout the day. Several factors influence spreads, including liquidity, volatility and market news. Currency pairs boasting higher liquidity tend to have thinner spreads (low spreads), while less traded pairs (less liquid) will have wider spreads (higher spreads). In addition, liquidity can decline ahead of major risk events (economic data), potentially leading to elevated volatility, with a decline in quiet trading sessions also generally evident. For example, the Asian session tends to have less liquidity as no other major financial centres are open.

Consequently, it pays to keep an eye on the economic calendar. Scheduled macroeconomic data can generate price fluctuations and increase volatility depending on whether economists’ expectations are met. This is sometimes exacerbated by thin liquidity and, therefore, can cause slippage.

Industry-Leading Competitive Forex Spreads

FP Markets provides variable spreads for fast trade execution. Derived from leading international financial institutions, we provide deep liquidity and real-time price quotes for various popular instruments. FP Markets deliver spreads as low as 0.0 pips on Raw Accounts and 1.0 pips on Standard Accounts.

FP Markets Forex Trading accounts

Account (MT4 - MT5)
POPULAR Account (MT4 - MT5)

MetaTrader Raw Account Commission Charges

Check our commission charges for the Raw Account based on the currency denomination of your trading account. The table has been split, based on commission per lot, to make it easier for you to calculate your costs based on trading volume.

Instrument Standard Account Raw Account
Forex & Metals Zero (Built into the spread)
Account CCY Per side Round Trip
AUD CAD SGD $3.5 $7
USD $3 $6
EUR €2.75 €5.5
GBP £2.25 £4.5
HKD $20 $40
JPY ¥250 ¥500
Commodities Zero (Built into the spread) Zero (Built into the spread)
Indices Zero (Built into the spread) Zero (Built into the spread)
Shares Zero (Built into the spread) Zero (Built into the spread)
Cryptocurrencies Zero (Built into the spread) Zero (Built into the spread)

Trade Execution Matters

Pricing alone cannot bring results without reliable and fast execution. We offer some of the world’s best trading platforms to facilitate fast execution speeds. With the help of advanced charting tools, numerous technical indicators, market news and insights, and real-time price charts, FP Markets truly offers a unique trading experience.

Download MT4, MT5, cTrader or IRESS to experience trading with tight spreads and transparent commissions.

How to Monitor Live Forex Spreads on the FP Markets MT4 or MT5 Platforms

Once the trading platform is active, press Ctrl+M to activate the Market Watch window.


For MT4, right-click anywhere on your Market Watch window and select ‘Spread’. You can then view each instrument’s spread (!) in the Market Watch interface.


For MT5, right-click anywhere on your Market Watch window and select ‘Columns’, allowing you to check the option ‘Spread’ to view the spreads for each instrument in your Market Watch interface.

Chart Bid and Ask Prices on the FP Markets MT4 or MT5 Platforms

Right-click anywhere on your chart.


For MT4, select ‘Properties’ (F8), then select the ‘Common’ tab. Following this, check the ‘Show Ask Line’ box to view the bid and ask prices on your selected chart.


For MT5, select ‘Properties’ (F8), then select the ‘Show’ tab and check the ‘Show ask price line’ box to view the bid and ask prices on your selected chart.

Spreads

(December 2023)

Spreads on our MetaTrader 4 platform are variable, with quotes from major international financial institutions. During liquid times our industry-leading spreads can go as low as 0.0 pips. Our more typical spreads are listed below.

Forex Spreads

Symbol Product Standard A/c Raw ECN A/c
  Avg Min Avg
AUDCAD Australian Dollar vs Canadian Dollar 1.3 0 0.5
AUDCHF Australian Dollar vs Swiss Franc 1.9 0 0.8
AUDJPY Australian Dollar vs Japanese Yen 1.5 0 0.4
AUDNZD Australian Dollar vs New Zealand Dollar 1.8 0 1
AUDSGD Australian Dollar vs Singapore Dollar 3.3 0 1.8
AUDUSD Australian Dollar vs US Dollar 1.3 0 0.2
BWPUSD Botswanan Pula vs US Dollar 1.7 1 1.7
CADCHF Canadian Dollar vs Swiss Franc 1.6 0 0.8
CADJPY Canadian Dollar vs Japanese Yen 1.7 0 0.6
CHFJPY Swiss Franc vs Japanese Yen 2.9 0 1.8
CHFSGD Swiss Franc vs Singapore Dollar 4.8 0 3.7
EURAUD Euro vs Australian Dollar 1.8 0 0.7
EURCAD Euro vs Canadian Dollar 2 0 0.4
EURCHF Euro vs Swiss Franc 1.8 0 0.7
EURCZK Euro vs Czech Koruna 99.2 0 81.8
EURDKK Euro vs Danish Krone 11.4 1.1 5.4
EURGBP Euro vs Great Britain Pound 1.4 0 0.3
EURHUF Euro vs Hungarian Forint 229.8 0 16.3
EURJPY Euro vs Japanese Yen 1.6 0 0.5
EURMXN Euro vs Mexican Peso 63.2 0 43.2
EURNOK Euro vs Norwegian Krone 70.5 0 63
EURNZD Euro vs New Zealand Dollar 2.6 0 1.5
EURPLN Euro vs Polish Zloty 18.4 0 15.1
EURSEK Euro vs Swedish Krona 68.2 0 62.7
EURSGD Euro vs Singapore Dollar 2.4 0 1.3
EURTRY Euro vs Turkish Lira 1218.6 6.7 1215.6
EURUSD Euro vs US Dollar 1.2 0 0.1
EURZAR Euro vs South African Rand 84.1 0 72.6
GBPAUD Great Britain Pound vs Australian Dollar 2 0 0.9
GBPCAD Great Britain Pound vs Canadian Dollar 2.2 0 0.7
GBPCHF Great Britain Pound vs Swiss Franc 2.3 0 1.2
GBPDKK Great Britain Pound vs Danish Krone 27.6 5.1 21.6
GBPJPY Great Britain Pound vs Japanese Yen 2 0 0.9
GBPMXN Great Britain Pound vs Mexican Peso 76.8 0 56.8
GBPNOK Great Britain Pound vs Norwgian Crona 59.5 0 52
GBPNZD Great Britain Pound vs New Zealand Dollar 3.7 0 2.2
GBPPLN Great Britain Pound vs Polish Zloty 36.3 15 34.8
GBPSEK Great Britain Pound vs Swedish Krona 103.5 11.9 98.8
GBPSGD Great Britain Pound vs Singapore Dollar 3.1 0 1.9
GBPTRY Great Britain Pound vs Turkish Lira 1591.9 110.9 1584.9
GBPUSD Great Britain Pound vs US Dollar 1.4 0 0.3
NZDCAD New Zealand Dollar vs Canadian Dollar 1.3 0 0.5
NZDCHF New Zealand Dollar vs Swiss Franc 1.8 0 1
NZDJPY New Zealand Dollar vs Japanese Yen 1.8 0 0.7
NZDSGD New Zealand Dollar vs Singapore Dollar 3 0 1.9
NZDUSD New Zealand Dollar vs US Dollar 1.5 0 0.3
USDBRL US Dollar vs Brazilian Real 31.4 0 21.4
USDCAD US Dollar vs Canadian Dollar 1.5 0 0.4
USDCHF US Dollar vs Swiss Franc 1.8 0 0.7
USDCLP US Dollar vs Chilean Peso 589.5 60 589.5
USDCNH US Dollar vs Chinese Yuan 1.9 0 0.8
USDCOP US Dollar vs Colombian Peso 4754.3 0 4754.3
USDCZK US Dollar vs Czech Koruna 86 0 68.8
USDDKK US Dollar vs Danish Krone 14.7 0 8.7
USDHKD US Dollar vs Hong Kong Dollar 6.8 0.2 5.7
USDHUF US Dollar vs Hungarian Forint 227.2 0 13.8
USDINR US Dollar vs Indian Rupee 21.1 9.9 11.1
USDJPY US Dollar vs Japanese Yen 1.3 0 0.3
USDKES US Dollar vs Kenyan Shilling 10545.7 7862.4 10545.7
USDKRW US Dollar vs Korean Won 59.9 19 49.9
USDMXN US Dollar vs Mexican Peso 39.8 0 33.8
USDNOK US Dollar vs Norwegian Krone 61.4 0 52.9
USDPLN US Dollar vs Polish Zloty 18.1 0 14.4
USDSEK US Dollar vs Swedish Krona 58.1 0 49.4
USDSGD US Dollar vs Singapore Dollar 1.6 0 0.8
USDTHB US Dollar vs Thai Baht 175.9 0 155.9
USDTRY US Dollar vs Turkish Lira 339.6 10.1 337.1
USDTWD US Dollar vs New Taiwan dollar 2.8 0 2.8
USDUGX US Dollar vs Ugandan Shilling 338.4 240.8 338.4
USDZAR US Dollar vs South African Rand 54.5 0 43.6
USDZMW US Dollar vs Ugandan Shilling 1201.8 360.3 1201.8

Metal Spreads

Symbol Product Standard A/c Raw ECN A/c
    Min Avg
XAGAUD Silver vs Australian Dollar 0.03 0.004 0.022
XAGEUR Silver vs Euro 0.02 0.004 0.012
XAGUSD Silver vs US Dollar 0.02 0 0.012
XAUAUD Gold vs Australian Dollar 0.62 0.06 0.52
XAUEUR Gold vs Euro 0.37 0 0.19
XAUUSD Gold vs US Dollar 0.2 0 0.07
XPDUSD Palladium vs US Dollar 9.96 - -
XPTUSD Platinum vs US Dollar 2.91 - -
XPBUSD Lead vs US Dollar 3.62 2 3.48
XZNUSD Zinc vs US Dollar 3.39 2.27 3.25
XNIUSD Nickel vs US Dollar 21.47 15.44 21.33
XALUSD Aluminum vs US Dollar 3.44 1.95 3.3
XCUUSD Copper vs US Dollar 5.24 3.05 5.1
XAUGBP Gold vs Great Britain Pound 0.37 0.06 0.25
XAUSGD Gold vs Singapore Dollar 0.72 0.04 0.53
XAGSGD Silver vs Singapore Dollar 0.024 0.005 0.018
XAUCNH Gold vs Chinese Renminbi 3.57 0.66 2.55

CFD Indices Spreads

Symbol Product   Standard A/c
    Min Avg
AUS200 Australia 200 Index vs Australian Dollar Cash - 1.55
CHINA50 China A50 Index vs US Dollar Cash - 7.69
EURO50 Euro 50 Index vs Euro Cash - 1.84
FRA40 CAC 40 Index vs Euro Cash - 1.89
GER40 German 40 Index vs Euro Cash - 1.29
HK50 Hang Seng Index vs Hong Kong Dollar Cash - 4.46
ITA40 Italy 40 index vs Euro Future - 15
JP225 Japan 225 Index vs Japanese Yen Cash - 4.9
SPA35 Spain 35 Index vs Euro Cash - 6.6
UK100 UK100 Index vs Great Britain Pound Cash - 1.23
US100 US Tech 100 Index vs US Dollar Cash - 1.49
US30 US 30 Index vs US Dollar Cash - 1.39
US500 US 500 Index vs US Dollar Cash - 0.51
USDX USD Index Basket vs US Dollar Future - 0.05
VIX VIX Index Cash vs US Dollar Future - 0.15

CFD Commodities (MT4/MT5)

Symbol Product   Standard A/c
    Min Avg
COCOA Cocoa vs US Dollar Cash - 3.1
COFFEE US Coffee vs US Dollar Future - 0.69
CORN Corn vs US Dollar Cash - 0.71
SOYBEANS Soybeans vs US Dollar Cash - 1.11
WHEAT Wheat vs US Dollar Cash - 2.11
COTTON Us Cotton No.2 vs US Dollar Future - 2.2
SUGAR Us Sugar No.11 vs US Dollar Future - 2.06
WTI West Texas Intermediate Crude Oil vs US Dollar Future - 0.02
XBRUSD Brent Crude Oil vs US Dollar Cash - 0.03
XNGUSD Natural Gas vs US Dollar Cash - 0.02
XTIUSD West Texas Intermediate Crude Oil vs US Dollar Cash - 0.03
BRENT Brent Crude Oil vs US Dollar Future - 0.03

Cryptocurrency Spreads

Symbol Product   Standard A/c
    Min Avg
ADAUSD Cardano vs US Dollar - 0.0046
BCHUSD Bitcoin Cash vs US Dollar - 1.94
BTCUSD Bitcoin vs US Dollar - 26.94
DOGUSD Dogecoin vs US Dollar - 0.0017
DOTUSD Polkadot vs US Dollar - 0.06
EOSUSD EOS vs US Dollar - 0.0041
ETHUSD Etherium vs US Dollar - 4.05
LNKUSD Chainlink vs US Dollar - 0.066
LTCUSD Litecoin vs US Dollar - 1.13
RPLUSD Ripple vs US Dollar - 0.001
SOLUSD Solana vs US Dollar - 1.076
XLMUSD Stellar vs US Dollar - 0.00242

Source - cache | Page ID - 48

Get instant Updates in Telegram