1. Overview
The Tick Chart Trader shows tick charts in a variety of styles, and allows quick trading using either
keyboard or mouse.
The tick charts are compiled from the time that the app starts running. It
does not provide access to historic tick data.
The app provides five styles of chart:
•
Tick charts
• Tick speed
• Timed charts
• Tick candles
• “Versus” charts
The app also provides extra-fast position entry and exit, on a FIFO basis,
using either the keyboard or mouse.
2. Charts
2.1 Tick charts
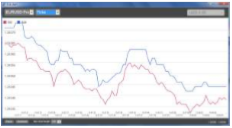
Tick charts show each change in the bid or ask price; the chart updates whenever either price changes. The amount of time between each point on the chart can vary depending on how active the market is.
2.2 Tick speed
The tick-speed chart shows each tick, plus grey bars indicating the time between tick. The time is a rolling average, calculated over the number of ticks specified by the numeric field in the toolbar – for example, the average speed of the last 5 ticks. The smaller the grey bars, the faster that ticks are appearing.

2.3 Timed charts
Timed charts show each individual tick, but the x-axis of the chart is divided into equal amounts of time. Therefore, the chart can show bursts of activity interspersed with periods where the lines are flat because no new ticks occur.
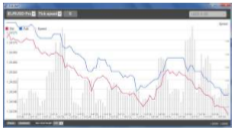
(This chart covers the same period as the tick chart example above.)
2.4 Tick candles
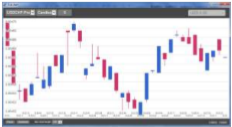
The candle chart shows traditional candles – with an open, high, low, and close – but based on a number
of ticks rather than a duration of time. For example, if the period for the chart is set to 5 ticks,
then each candle could represent anything from one second if the market is
active (i.e. all 5 ticks
happen within a single second) through to as much as a minute if the market is quiet (i.e. it takes a 60
seconds for 5 different ticks to happen).
Candle charts are based on the mid price of each tick (i.e. the average of the bid and ask).
2.5 Versus charts
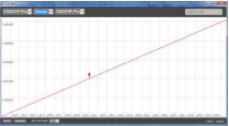
“Versus” charts show the activity on one symbol versus another, plotted against each other. The chart shows the current mid prices, and per-second historic snapshots.
A chart of two different symbols plotted against each other shows the correlation in their movements.
In the following example there is quite strong negative correlation between the two symbols:
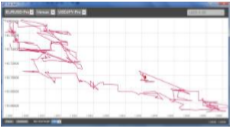
A chart of a symbol against itself is more useful than may immediately appear: it shows the current price in relation to the high-low range of the period covered by the chart.
3. Trading
All trading through the Tick Chart Trader app is on a FIFO basis. For example, if you place a buy order
and then a sell order, then the sell closes the previous buy even if you are using a trading platform
such as MT4 which allows “hedged” orders. The trading functionality in the
Tick Chart Trader app is
designed for people who want quick entry and exit from a single position in each symbol.
3.1 Placing orders with the mouse
You can place buy and sell orders by clicking on the bid and ask prices in the bottom-right of the
app. This displays a pop-up panel with buy or sell pre-selected depending on whether you clicked on the
ask price or bid price. The trade size from the field in the footer is copied into the pop-up panel.
You can close an open position by clicking on the position/profit marker in the top-right of the app.
This pre-fills the dealing panel with an order which closes your position. For example, if you are long
0.30 lots, then the panel will be pre-filled with a sell order for 0.30.
However, you can change the contents of the dealing panel before placing the order. For example, you
can click on the bid price, pre-filling the dealing panel with a sell order, but then change that to a
buy order before placing the trade.
You can close the panel without placing a trade by clicking anywhere outside it.
3.2 Placing orders with the keyboard
You can trade with the keyboard using the B, S, and C keys.
B has the same effect as clicking on the ask price: it pre-fills the dealing panel for a buy order. S
is equivalent to clicking on the bid price; it pre-fills the panel for a sell order. C has the same
effect as clicking on the position/profit marker.
After pressing one of these keys you can then either amend the order details, or simply press the
spacebar rather than having to click on the “Place order” button. (You can move from the “Place order”
button to the volume field using the standard keyboard shortcut Shift+Tab.)
You can close the panel without placing a trade by pressing the Esc key.
3.3 Placing quick orders using the Ctrl key
For extra-fast order entry, you can use the Ctrl key. You need to turn this option by using any of
the above facilities for opening the dealing panel. (You do not need to place a trade; you can turn on
the Ctrl option and then cancel the dealing panel.)
Using the Ctrl key is then equivalent to opening the trading panel (using either mouse or keyboard)
and then clicking on the “Place order” button without changing the pre-filled settings.
In other words:
• Ctrl+C, or holding down Ctrl while clicking on the position/profit marker, closes your current open
position.
• Ctrl+B, or holding down Ctrl while clicking on the ask price, places a new buy order using the
trade size shown in the footer.
• Ctrl+S, or holding down Ctrl while clicking on the bid price, places a new sell order using the
trade size shown in the footer.
4. Options and settings
You can change options and settings for the app using the controls in the bottom-left corner of its window.
4.1 History length
The history-length setting does two things:
• It controls how many ticks are displayed on the chart (number of seconds rather than ticks in the
case of “versus” charts).
• It controls how much tick history is recorded for symbols which are not
currently being displayed.
For example, if the history-length is set to 100 and you are currently looking at EUR/USD, then the
software will only show the most recent 100 ticks but it will be recording an unlimited number of ticks
for EUR/USD. You can change the value from 100 to e.g. 200 in order to see more of the EUR/USD history
(provided that 200 ticks have been received).
However, the software will have only stored the most
recent 100 ticks for any other symbol which is not being displayed, such as GBP/USD, and after changing
the setting the software will only record a maximum of 200 ticks for these symbols.
4.2 Pause chart
The Pause button suspends drawing of the chart. The software continues to collect ticks, and it updates the current price and the position/profit marker.
4.3 Download
The Download button downloads the entire available tick history for the selected symbol as a TSV file, showing the date, bid price, and ask price.
 Uzyskaj dostęp +10.000 instrumentów finansowych
 Automatycznie otwieraj i zamykaj pozycje
 Aktualności i kalendarz ekonomiczny
 Wskaźniki techniczne i wykresy
 I wiele innych narzędzi
Podając swój adres e-mail, wyrażasz zgodę na politykę prywatności FP Markets i otrzymujesz przyszłe materiały marketingowe od FP Markets. W każdej chwili możesz zrezygnować z subskrypcji.
Source - database | Page ID - 23775