Trading Course for Beginners: Course 3

MENU

Lesson 2: Getting Started with Technical Indicators

Reading Time: 10 Minutes

Demanding professions require specialised tools to perform at the highest level, and it’s no different in trading and investing in the financial markets.

Technical analysis basics are a prerequisite if trading through a chart-based methodology is the goal. Mathematical calculations—derived largely from price movement and volume studies—form technical indicators and provide one component of chart analysis that help market participants interpret market movement.

Although indicators are acknowledged by most technical analysts or chartists, new traders commonly make the mistake of overloading charts with different indicators to seek trading opportunities. This more is better approach can result in what’s known as analysis paralysis. Consequently, it’s imperative that traders, irrespective of whether adopting a day trading approach (short-term timeframes) or following more of an investment style (position trading), have a deep understanding of each indicator used to frame trading decisions.

Technical Indicators: Beginner’s Guide

It’s important to realise that technical indicators are not designed to deliver 100 per cent accuracy; they’re designed to help put the odds in your favour and complement trading strategies. An advocate of indicators seldom defends generating investment decisions exclusively through trading indicators. Additional technical analysis tools tend to be considered, such as support and resistance levels, Fibonacci studies, trendlines, candlestick patterns, and price patterns.

Within the field of technical analysis, indicators fall under the umbrella of two primary groups: leading and lagging.

• Leading indicators are designed to forecast or anticipate price action. Hence, if a leading indicator correctly forecasts a price trend, a trader can jump into the market before the price moves and potentially ride a large portion of the trend. However, like all technical indicators, leading indicators are prone to false signals.

• Lagging indicators, as their name implies, lag market action. Lagging indicators are in place to help confirm a market move, effectively providing delayed feedback. Think of this as an indicator that follows price action. Lagging indicators are commonly adopted by trend traders as they help validate an unfolding trend.

Like chart types can be broken down into line charts, bar charts, and candlestick charts, technical indicators can be further subdivided into a number of key categories:

• Trend Following Indicators

Trend following indicators are often lagging—a classic trend following method is composed of two moving averages that generate signals when they cross each other.

Simple Moving Averages, or SMAs, generally follow trends. The SMA is derived from taking the average closing price over a number of periods. The more periods used, the less sensitive the moving average is to market movements, meaning the trend must be stronger before a signal develops.

The 200-day SMA is a common value used amongst longer-term traders, while the 50-day SMA is employed by swing traders (a medium-term approach). SMA crossovers, as noted above, are popular methods, as are acting on a price close beyond the SMA’s value.

Figure 1.1 displays an example of a USD/JPY daily chart with a 200-day SMA and a 50-day SMA applied.

Figure 1.1 (USD/JPY Daily Chart – TradingView)

• Momentum Indicators

Momentum indicators measure the speed of price change.

Alongside the MACD (Moving Average Convergence Divergence) and the Stochastics indicator, the relative strength index (RSI) serves as a popular example of a momentum-based oscillator, usually regarded as a leading indicator and represented by a value between zero and one hundred. The RSI’s primary uses consist of identifying overbought and oversold conditions, divergences, as well as failure swing tops and bottoms.

Generally, an RSI value beyond 70 implies overbought conditions, signalling a bearish reversal. Under 30, though, is regarded as oversold which highlights a possible bullish reversal. In addition, the RSI can be used as a trend confirmation tool through the 50.00 centreline. When the RSI value moves north of 50.00, this is seen as validation of a bullish trend, namely average gains exceeding average losses. Indicator divergence is another technique employed by RSI users that occurs when price and indicator diverge: for example, the currency pair (or any financial instrument) develops a lower low at the same time the indicator forms a higher low.

Figure 1.2 is an example of a EUR/USD daily chart with the RSI applied.

Figure 1.2 (EUR/USD Daily Chart – TradingView)

• Volume Indicators

Indicators derived from volume are created to track a security’s strength. Depending on the market traded, trading volume is based on the total number of shares that have changed hands (stock market), the total number of contracts completed (futures and options) and the movement of ticks (in foreign exchange [Forex market]).

Volume is considered to precede price through divergence. At its simplest, volume decreasing in a rising market can be interpreted as a warning sign of a potential reversal. Still, volume is rarely used in isolation. Analysis of price action is necessary together with volume studies.

On charts, market participants tend to set volume at the bottom of a price chart, depicted in the shape of vertical bars showing the change in shares, contracts, or ticks. Figure 1.3 illustrates a daily chart of GBP/USD showing tick volume

Figure 1.3 (GBP/USD Daily Chart – TradingView)

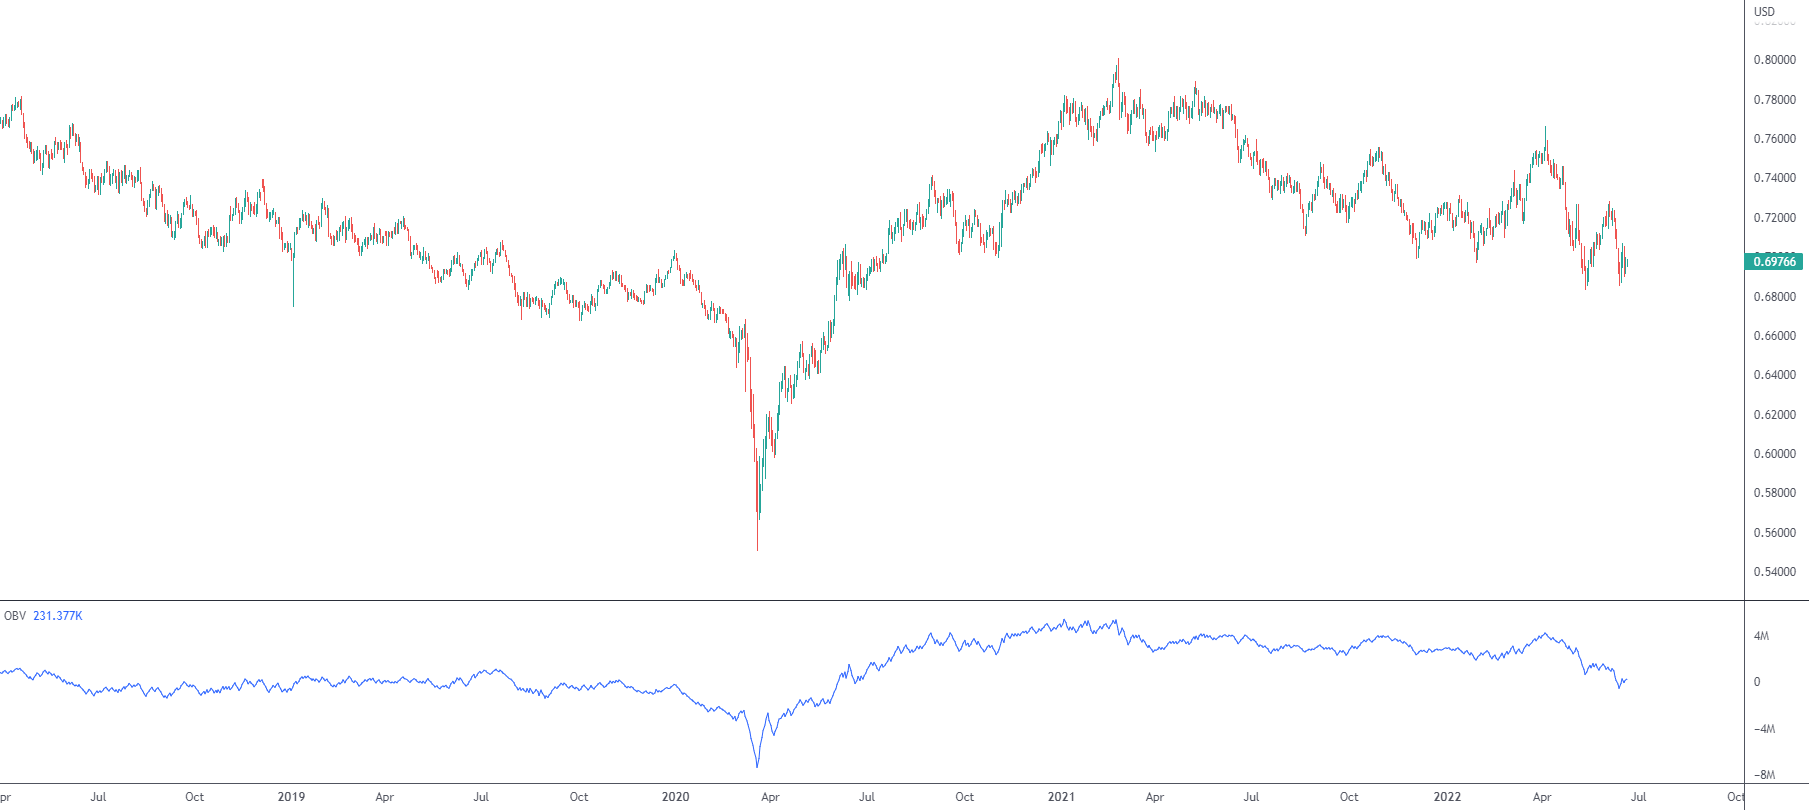
Traders and investors, however, are not limited to volume bars. A plethora of volume indicators are available, including On Balance Volume (OBV), shown in figure 1.4. This indicator measures a security’s buying and selling volume in the form of a cumulative indicator, meaning adding volume on positive days and subtracting volume on negative days. The OBV represents a leading indicator that can aid trend confirmation, confirm breakouts, as well as recognise divergences.

Figure 1.4 (AUD/USD Daily Chart – TradingView)

Other indicator categories to take into account are relative strength and volatility indicators:

• Not to be confused with the Relative Strength Index (see above), relative strength analysis involves dividing two markets from each other, usually a stock price with a market average, such as the S&P 500.

• Bollinger bands, a lagging indicator that measures market volatility, is a widely used indicator among technical analysts. Bollinger bands consist of a middle band—the default setting is a 20-period simple moving average—and upper and lower bands. These upper and lower bands are set above and below the moving average by a number of standard deviations (two standard deviations is the default setting). Traders use this indicator in a number of ways, but the two most familiar strategies are the Bollinger Squeeze and Bollinger Bounce.

Empieza a hacer trading
en cuestión de minutos.

bullet Accede a más de 10.000 instrumentos financieros
bullet Apertura y cierre automático de posiciones
bullet Noticias y agenda económica
bullet Indicadores técnicos y gráficos
bullet Muchas más herramientas incluídas

Al proporcionar su correo electrónico, usted acepta la política de privacidad de FP Markets y está de acuerdo en recibir futuros mensajes de marketing por parte de FP Markets. Puede darse de baja en cualquier momento.


Source - database | Page ID - 4643

Get instant Updates in Telegram