Trading Course for Beginners: Course 1

MENU

Lesson 4: What is Technical Analysis?

Reading Time: 8 Minutes

1. What is Technical Analysis?

Technical analysis has experienced rapid growth over the years, a broad approach examining historical price and volume data to forecast trends in financial markets. Although technical analysis is employed in a number of trading strategies (and trading styles), fundamental analysis is outside of its purview. Fundamental analysts, particularly in foreign exchange (or ‘Forex’), assess a country’s economic landscape through microeconomics and macroeconomics. Many traders and investors, however, adopt both technical and fundamental analysis to generate investing decisions.

2. Brief History of Technical Analysis

Charles Henry Dow—the founder of the Dow-Jones Financial news service and the founder of the Wall Street Journal—is considered by many technical analysts (or ‘chartists’) as the ‘father’ of modern technical analysis. Dow was the first to establish an index in 1896 that measured price moves in US-based equities, now recognised as the Dow Jones Industrial Average. Nevertheless, it’s important to note that the first index created by Dow was the Dow Jones Railroad Average in 1884, acknowledged today as the Dow Jones Transportation Average.

While Dow never formulated his principles into text, Robert Rhea refined Dow’s work and wrote a book in 1932 called The Dow Theory: An Explanation of its Development and an Attempt to Define its Usefulness as an Aid to Speculation. The evolution of Dow Theory is best described in Rhea’s book, with a key focus on trend structure. Rhea presented three basic trends, the primary trend, the secondary trend and the minor trend.

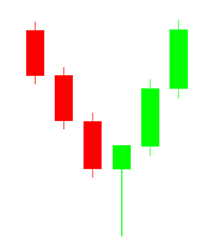
Other notable developments in technical analysis are Steve Nison’s work with Japanese Candlestick patterns. Nison is responsible for bringing candlestick patterns to the Western world in his 1991 book called: Japanese Candlestick Charting Techniques. Candlestick formations such as the hammer pattern and evening star configuration are widely employed within the technical community.

3. Chart Types

Three types of price charts commonly used by technical analysts to view price data are the line chart, the bar chart and the Japanese candlestick chart.

• A line chart is presented in the shape of a continuous line, often calculated by way of closing prices.

• The western bar chart—sometimes referred to as ‘OHLC’ charts—presents the open, high, low and close (OHLC) data of each bar printed across different time periods (or timeframes).

• A Japanese candlestick chart delivers a variation of the OHLC values which, for many traders, is easier to analyse. The key difference between a bar and candlestick is the candlestick’s ‘real body’ (between opening and closing price action) allow traders to quickly determine price direction—bar charts display the body by way of a vertical line.

The candlestick chart remains a popular way to view market data.

4. Popular Technical Analysis Tools

The main objective of technical analysis is to create a trading edge through market patterns, statistics and risk management, all of which should be detailed in a well-defined trading plan to highlight trading opportunities.

Technical analysts have a plethora of tools at their disposal. Beginner traders and investors must understand the mechanics behind each technical indicator and drawing tool used before applying them to generate trading signals.

Support and Resistance:

Support levels denote the lowest point at which a currency pair’s price (or stock’s price) has fallen, while resistance levels indicate the highest point at which the currency pair has risen. When price movement decreases to a price level that encourages market participants to purchase, support manifests itself, and vice versa for resistance.

Support and resistance are considered the ‘backbone’ for many technical-based trading methodologies (trading systems). Newer traders often adopt objective methods of identifying support and resistance. Pivot point levels and psychological figures are two widely used approaches. Fibonacci ratios may also be used to determine support and resistance, yet the application is open to subjectivity.

Trendlines:

Trendlines are one of the first drawing tools most up-and-coming technicians learn about. Primarily functioning to help market participants define trend, trendlines function well as ascending and descending support and resistance.

An upward trend line, or an ‘uptrend line’, develops when prices experience higher highs and lower lows. By linking the rising lows, an upward trendline is formed. A trendline tracks the progress of a rising market and provides early signs of a trend reversal (or downtrend) in the event of a breach.

Chart Patterns (Price Patterns):

Well-known bullish and bearish chart patterns are the head and shoulders pattern, double-bottom and double-top formations, as well as triangle structures, flags and pennants. Each configuration is organised by way of clear guidelines which must be followed in order to take advantage of the pattern’s predictive capability.

Examples of Technical Indicators:

Moving Averages:

Smoothing out market data over a defined period of time, moving averages are a common view on trading charts.

The 50-day and 200-day simple moving average crossover approach can be used by a beginner trader to track a market’s price trend and deliver long-term buy and sell entry signals. A short-term moving average breakout above the longer-term moving average is often labeled as a ‘Golden Cross’, and a ‘Death Cross’ is identified when a shorter-term moving average crosses lower.

Moving Average Convergence Divergence (MACD) Indicator:

The MACD is a combination of a trend-following indicator and momentum indicator, showing a connection between two moving averages of a security's price.

The Relative Strength Index (RSI):

A momentum oscillator that measures the ‘speed of price change’ to establish whether a stock or currency pair is overvalued (overbought) or undervalued (oversold).

Parabolic SAR:

This is considered one of the most effective technical analysis indicators for determining the direction of price and also for determining when the direction of future price movements.

Bollinger Bands:

Bollinger bands—a volatility indicator—helps trading and investors gauge a market’s volatility, answering the question whether a market is high or low compared to an average. Mean-reversion strategies often employ Bollinger Bands.

Empieza a hacer trading
en cuestión de minutos.

bullet Accede a más de 10.000 instrumentos financieros
bullet Apertura y cierre automático de posiciones
bullet Noticias y agenda económica
bullet Indicadores técnicos y gráficos
bullet Muchas más herramientas incluídas

Al proporcionar su correo electrónico, usted acepta la política de privacidad de FP Markets y está de acuerdo en recibir futuros mensajes de marketing por parte de FP Markets. Puede darse de baja en cualquier momento.


Source - database | Page ID - 4128

Get instant Updates in Telegram