Experience Trading
on the Go
on the Go

Lesson 5: What is Fundamental Analysis in the Forex Market?
Fundamental Analysis in Forex Trading: Factors that Affect Currencies
Reading Time: 11 Minutes
Estimating future price movements in the currency market is challenging for many. Globally, the foreign exchange market commands the biggest slice of the financial ‘cake’, claiming an eye-watering US$6.6 trillion in global FX market turnover.
Traders will use a variety of tools to assist them in predicting the price movement, most commonly technical analysis and fundamental analysis are methods that traders use to get a gauge of potential movement in the market.
Fundamental Analysis Defined
Currency pair in forex refers to, two currencies are paired together and quoted through a ‘base’ and ‘quote’ currency. The euro in EUR/USD (a major currency pair) is the base currency and represents one unit; the US dollar is the quote currency and provides the value of a currency: the euro in this case.
Fundamental analysis studies economic developments of a country, events influencing the supply and demand of their respective exchange rates, either positively or negatively. Analysts employing fundamental analysis tend to approach markets using a macro-driven theme.
Macro analysis, or top-down approach, focuses on broad economic factors. This involves a comprehensive assessment of the economy, evaluating aspects such as economic indicators—interest rates, growth and inflation—as well as central bank policy.
Fundamental analysis is composed of three core elements:
• Central bank policies
• Economic indicators
• Geopolitical events
These three components working in harmony should translate to clearer market trends and present potential trading opportunities. If one of these areas is in disorder, interpreting a fundamental picture becomes difficult.
Fundamental analysis essentially informs traders and investors why the market advances and declines, and provides a trade decision: to buy, sell or trade flat.
Central Banks
A country’s central bank is charged with the duty of regulating banking institutions and implementing monetary and fiscal policies.

Well-known central banks:
• United States Federal Reserve (or ‘Fed’)
• European Central Bank (ECB)
• Bank of England (BoE)
• Bank of Japan (BoJ)
• Reserve Bank of Australia (RBA)
Everything begins with the central bank and they’re assessment of economic indicators. Traders and investors attempt to anticipate a central bank’s actions by evaluating economic indicators and reacting to the outcomes from the forecast (Actual versus Variance). The market projects a forecast for an economic indicator and subsequently responds to the actual figure released.
Ultimately, trading opportunities present themselves when economic data harmonises with a central bank’s sentiment. This—coupled with a well-defined technical approach to fine tune entry techniques—delivers an overall trading picture to operate with.
Central Bank Announcements:
Major central banks meet every 4-6 weeks. The Fed and BoE meet every six weeks (8 times per year), while the RBA meets 11 times each year. Market trend, or ‘market direction’, is derived from the sentiment within the market, with the central bank acting as a stabilizer by using monetary policy. It is therefore crucial market participants recognise the arrangement of these central bank meetings and understand the terminology used.
Central bank governors are the head of their respective central banks. The head of the US Federal Reserve currently is Jerome H. Powell; Andrew Bailey heads the Bank of England and the governor of the Reserve Bank of Australia is Philip Lowe.
Central Banks: Why Are They important?
Central banks assess the current market sentiment at each meeting and consider whether any changes need to be made for the near-term monetary policy. The members will review data gathered over the last 6 weeks to assess on what measures need to be taken such as changing the current interest rates or using quantitative easing.
A country’s central bank raising rates can be categorised by way of a ‘hawkish bias’; what they’re essentially doing here is talking up the prospect of raising rates. The prospect of cutting rates is also an option on the table for central banks, emphasising a ‘dovish bias’. Either a hawkish or dovish tone can translate into big price moves in financial markets. If economic conditions remain unchanged, the central bank is likely to adopt a neutral stance: no bias.
Typically, the central bank meeting is accompanied by a statement and, of course, the interest rate decision. These are critical to understand. The statement is the primary avenue employed to communicate with investors regarding monetary policy (actions undertaken by a central bank): the outcome of the vote on interest rates alongside other policy measures and economic commentary. In addition, here you will find what the central bank’s forward projections are. A week or so later, the ‘minutes’ are available: a more comprehensive analysis of the statement and the talking points discussed in the meeting.
See here for the latest US Federal Open Market Committee (FOMC) Statement.
Out of the interest rate decision and statement, you’re looking for market sentiment—the direction provided by central banks and the core overall trends in the market.
The first two weeks of every month is ‘usually’ clear in terms of central bank sentiment, following a fresh statement from the bank.
Economic Indicators
Economic indicators, as their name implies, are statistics—often on a macroeconomic scale—designed to measure economic activity. Traders and investors use these indicators to analyse the well-being of a country’s economy. Government organisations and private groups release several economic reports on a weekly, monthly and quarterly basis, each measuring activity in a particular segment of the economy.

Widely followed indicators are employment/unemployment (payrolls), inflation (consumer price index [CPI]), growth (or gross domestic product [GDP]), retail sales, the stock market, industrial production (Producer Price Index [PPI]) and housing figures. In terms of release schedules, approximately five key economic indicators are released each week.
No single indicator provides a clear picture of the economy’s health. At best, each indicator provides a ‘snapshot’ of current conditions. But when piecing the economic indicators together, you should get a clearer picture of how the economy is faring.
However, it is crucial to understand that some economic indicators are more important than others at certain points in time. Inflation, as of this article, is important. Significant indicators to watch can be found on the statements from central banks in their forward guidance.
Economic Calendar
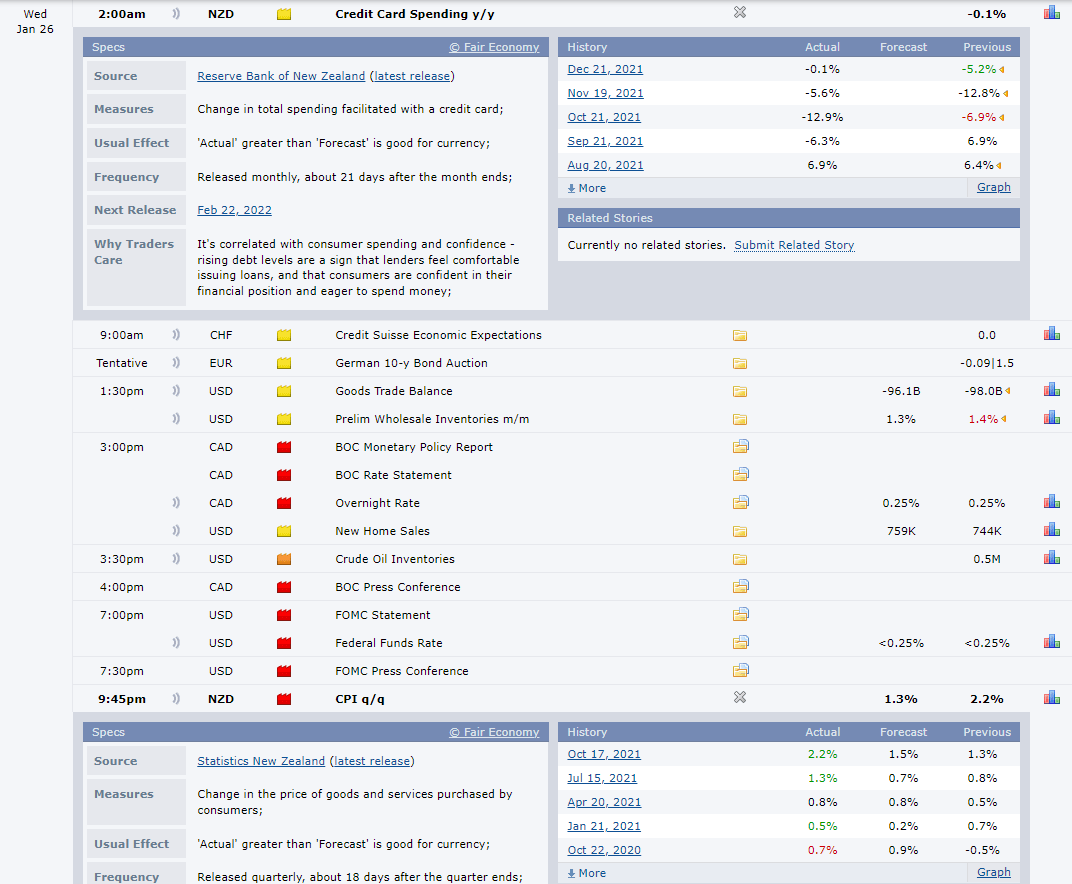
Forex Factory’s economic calendar is widely used among independent Forex traders and investors.
High-impacting economic releases are marked red. Orange represents potentially medium-impacting events and yellow indicates a low-expected impact on price levels, or price action.
We also have Previous or ‘Prior’, ‘Forecast’ and ‘Actual’ figures. Forecasts are generally a collection of economists’ views which are then averaged.
New Forex traders might want to note what the Q/Q and Y/Y labels refer to. As we can see with the New Zealand Credit Card spending Y/Y (see calendar below), Y/Y means data compared with corresponding data from a year earlier.
Q/Q seen with the New Zealand CPI data (inflation) is a measure from one quarter to the next. And, M/M is a measure from one month to the next.
 (Source: Forex Factory Economic Calendar)
Geopolitical Events
Geopolitical tensions can complicate technical analysis and fundamental analysis, distorting the general flow of key fundamental drivers in the market. However, absent of disruptive geopolitical events, trending markets become visible.
Geopolitics events are divided into wars and conflicts, terrorist attacks and international tensions. US-China trade is a good example and the ‘Brexit’ situation (United Kingdom exit from the European Union).
The announcements surrounding geopolitical issues are usually not scheduled, unlike the central bank announcements and economic data. As you can imagine, this may cause confusion in currency markets and make them difficult to trade.
Conclusion
To wrap things up, fundamental market analysis in the Forex market looks at three core components: the central bank’s ‘direction’, economic indicators to provide instant bias, and the geopolitical situation. To aid timing, we use technical analysis to fine tune entries.
Like technical analysis, fundamental analysis involves broad study and is beyond the scope of an article to detail each element. For that reason, the objective of this article is to provide a foundation in which to build from.
 Access 10,000+ financial instruments
 Auto open & close positions
 News & economic calendar
 Technical indicators & charts
 Many more tools included
By supplying your email you agree to FP Markets privacy policy and receive future marketing materials from FP Markets. You can unsubscribe at any time.
Source - cache | Page ID - 1080