外汇 或 Forex 是世界上交易最广泛的市场,每天的交易量超过 7 万亿美元。 通过外汇经纪商的点差,或买价和卖价之间的差额,也称为买/卖价差,交易者获得进入外汇市场进行交易的机会。 因此,点差的大小很重要:小的点差会降低交易成本,而较大的点差会增加成本。
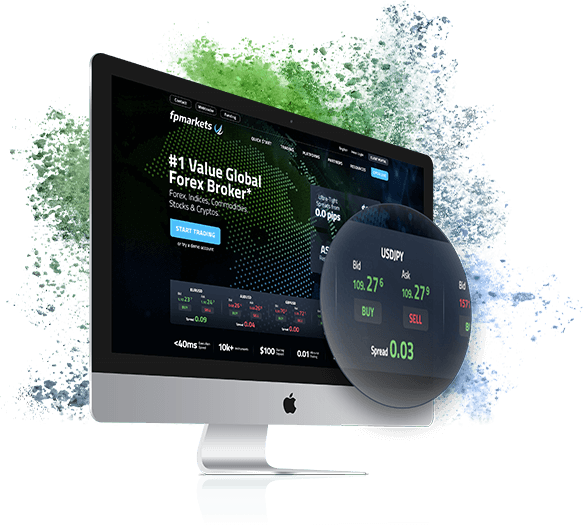
FP Markets 采用多样化的流动性组合。 与领先的银行和非银行金融机构合作,持续为我们的交易者提供低至 0.0 点的超低点差。
什么是外汇点差?
什么是外汇点差?

外汇 或 Forex 是世界上交易最广泛的市场,每天的交易量超过 7 万亿美元。 通过外汇经纪商的点差,或买价和卖价之间的差额,也称为买/卖价差,交易者获得进入外汇市场进行交易的机会。 因此,点差的大小很重要:小的点差会降低交易成本,而较大的点差会增加成本。
FP Markets 采用多样化的流动性组合。 与领先的银行和非银行金融机构合作,持续为我们的交易者提供低至 0.0 点的超低点差。

点差与交易息息相关
点差与交易息息相关
成功的交易者总是留意点差的任何变化,一些交易者,
特别是短期交易者,例如剥头皮交易者和日间交易者,
可能会根据这些变化做出交易决策
Successful traders are always mindful of any changes in the spread, with some traders, specifically shorter-term traders, such as scalpers and day traders, potentially basing trading decisions on such changes.
高点差
当买价和卖价之间的价差高于通常水平时,这可能意味着一段时期的流动性较低或市场波动较大。例如,非主要外汇对(通常称为“次要”或“交叉”货币对)由于流动性较低,经常反映出比主要货币对更高的价差,因为次要货币对的交易不如主要货币对广泛。
低点差
当买价和卖价之间的价差低于通常水平时,这可能意味着流动性较高或市场波动较小。 在伦敦和纽约等主要流动性外汇交易时段,您经常会遇到较低的点差(尤其是主要货币对)。
什么是外汇点差?
外汇交易中的点差是指买入价和卖出价之间的差异,也即货币对的买入/卖出价差。点差成本以“点”或“点值”计量,代表交易的主要成本。受欢迎的货币对——例如主要货币对,如欧元/美元和澳元/美元——由于较高的流动性而具有较低的点差。
买入价是交易员或投资者可以卖出的“报价价格”(位于报价的左侧),而卖出价是交易员或投资者可以购买的“报价价格”(位于报价的右侧)。我们也可以从流动商的角度来思考:买入价表示愿意购买者随时准备接受卖出订单(来自交易员),而卖出价则代表愿意出售者准备向买家出售(来自交易员的买入订单)。这个概念是理解的基础。
如果欧元/美元货币对的买入/卖出价为$1.1251/$1.1252,这意味着您可以以较高的卖出价$1.1252有效地购买1单位的欧元,并以较低的买入价$1.1251卖出。欧元(EUR)是基础货币,美元(USD)是报价货币(或计价货币)。
在上述例子中,以点为单位(买价和卖价之间的差异)为0.0001 =(1.1252美元 - 1.1251美元)。在这个例子中,点值被定价到小数点后4位,表示1个点(如果定价到小数点后5位,你会看到以下内容:0.00010 = [1.12520美元 - 1.12510美元])。请记住,一个点是“百分之一点”的缩写,相当于1/100的1%,是货币对可以波动的最小整数单位。
当前的买入价和卖出价是交易者可以立即或“即时”与市场进行(交易)的价格水平。 卖价通常总是略高于基础市场价格,而买价则略低于基础市场价格。
点差的大小在外汇交易中起着至关重要的作用。 这尤其适用于那些喜欢在单个交易时段进行大量交易的交易策略。 交易量、流动性、市场波动、新闻和时间都会影响点差。 点差可以影响利润,因为当金融市场波动剧烈时,点差可能会大幅扩大,并导致滑点(以与请求的成交价格不同的价格成交)。
固定点差和浮动点差
了解固定点差和浮动点差之间的区别非常重要。无论市场条件如何,固定点差保持不变。而浮动点差根据市场的供求和波动性而不断变化。选择最佳的点差类型对于将降至交易成本至关重要。那些交易频率较低的零售交易者可能会受益于固定点差,而那些在市场高峰时段频繁交易(此时点差最小)的交易者可能更喜欢浮动点差。通常情况下,浮动点差比固定点差低,特别是在市场较为平静时。
使用FP Markets Raw账户交易将为您打开市场超低点差之门。我们的流动性来自一些最大的流动性供应商,没有额外加价。这使得我们能够为您提供最低的点差,尤其是在市场活跃的时段,点差从0.0点起,这此以前只有对冲基金才能享有。
主要货币对的点差反映了市场的交易条件,比如时间、波动性和流动性。由于流动性较低,次要货币对的点差比主要货币对更大。有趣的是,值得指出的是,有8种主要货币约占外汇市场交易量的85%左右。
外汇交易商的点差和点值
货币点差由两种不同的价格决定:卖价和买价。买价是您可以卖出基础货币的价格,卖价是您可以买入基础货币的价格。
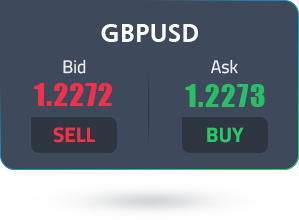
例如,如果GBP/USD货币对的买价/卖价为1.2272/1.2273,交易者可以以1.2273美元的卖价做多英镑,以1.2272美元的买价做空英镑。而这两个价格之间的差异就是买价/卖价点差:也就是外汇点差,在这个例子中是1个点,即0.0001。回顾一下,这是通过计算卖价和买价之间的差异得出的。
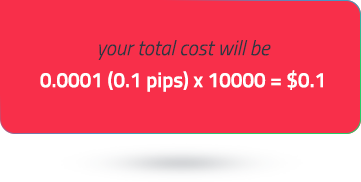
计算总的点值将根据货币对、账户货币计价单位和交易单位的不同而有所不同。让我们假设账户以美元交易,货币对为EUR/USD(账户货币与报价货币相同)
如果您进行了10,000单位的EUR/USD交易(1迷你手),每个点的价值,或者称为“初始点差成本”,将会是1美元 =(0.0001 * 10,000单位)。
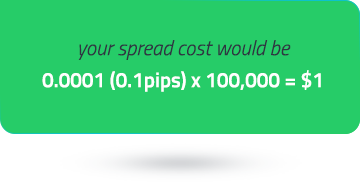
如果您进行标准手(100,000单位的基准货币)的交易,每个点的价值,或者称为“初始点差成本”,将会是10美元 =(0.0001 * 100,000单位)。
然而,使用与基础货币相匹配的账户的货币进行交易,需要将每个点的价值(通常是大多数货币对的0.0001)除以货币对的汇率,然后再将得出的值乘以交易的单位。举个例子,假设账户以英镑(GBP)计价,而您正在交易GBP/USD货币对。我们将0.0001除以GBP/USD的汇率:1.2409美元,然后再乘以100,000单位(交易1个标准手),得出8.06英镑(四舍五入)。所以,8.06英镑就是您的每个点的价值。
另一方面,如果使用与交易的货币对不同的账户货币,需要将账户货币替代为基础货币。然后,我们将0.0001(每个点的价值)除以替代汇率,再将得出的值乘以交易的单位。举个例子,假设您使用以英镑(GBP)计价的账户,并交易USD/CHF货币对。第一步是找到GBP/CHF的汇率:1.1149瑞士法郎。然后我们将0.0001除以1.1149,再乘以100,000单位(假设您交易1个标准手),得出8.97英镑(四舍五入)的每个点的价值。
理解外汇点差的高低
理解外汇点差的高低
值得注意的是,外汇交易的点差在一天之中每时每刻都是波动的。影响点差的因素很多,包括流动性、波动性和市场新闻等。流动性较高的货币对通常会有较窄的点差(低点差),而交易较少的货币对(流动性较低)则会有较宽的点差(高点差)。此外,在重大风险事件(经济数据)之前流动性可能会下降,可能导致波动率上升,而在较安静的交易时段流动性也普遍下降。例如,亚洲交易时段通常流动性较低,因为其他主要金融中心都尚未开放。
因此,密切关注经济日历是值得的。预测的宏观经济数据可以根据经济学家的预期是否得以实现而引发价格波动并增加波动性。这在流动性不足的情况下有时会加剧,因此可能会导致滑点。

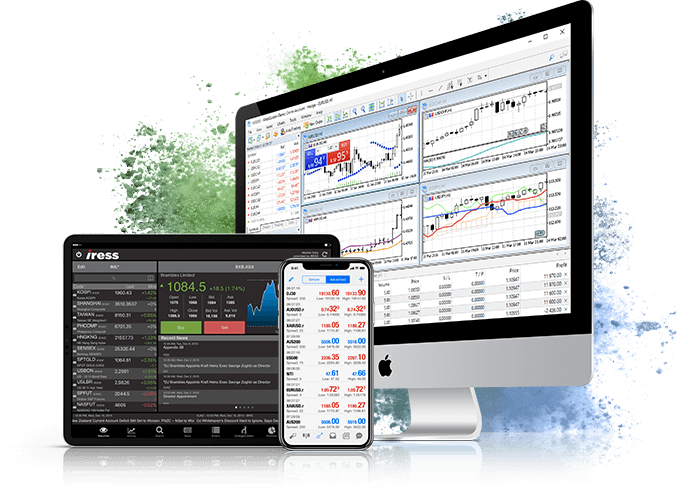
行业领先的具有竞争力的外汇点差
FP Markets提供浮动点差,以实现快速交易执行。我们的点差来自领先的国际金融机构,为各种热门交易产品提供深度流动性和实时报价。在Raw账户上,FP Markets的点差低至0.0,而在标准账户上为1.0。
如何在 FP Markets MT4 平台上查看实时外汇点差
如何在 FP Markets MT4 平台上查看实时外汇点差

打开交易平台,按下Ctrl+M键,跳出“市场报价”窗口。
对于MT4平台,右键点击“市场报价”窗口的任意位置,然后选择“点差”选项。这样您就可以在“市场报价”界面中查看每个交易工具的点差。
对于MT5平台,右键点击“市场报价”窗口的任意位置,然后勾选“点差”选项,以查看“市场报价”界面中每个交易工具的点差。
在FP Markets的MT4或MT5平台上查看图表上的买价和卖价:
在FP Markets的MT4或MT5平台上查看图表上的买价和卖价:
在图表上的任意位置右键点击。
对于MT4平台,选择“属性”(F8),然后选择“常规”选项卡。接着,勾选“显示买价线”框,即可在所选图表上查看买价和卖价。
对于MT5平台,选择“属性”(F8),然后选择“显示”选项卡,勾选“显示买价线”框,即可在所选图表上查看买价和卖价。
外汇点差 - 常见问题
外汇中的点差是买入价和卖出价之间的差额。 点差成本以“点”衡量,是交易的主要成本。 货币对的价差可能受到多种因素的影响,包括波动性和流动性。
外汇点差是通过货币对当前买价和卖价之间的差值来计算的。 例如,欧元/澳元货币对的报价为 A$1.6162/A$1.6163。 只需从卖出价 ($A1.6163) 中减去买入价 ($A1.6162) 即可确定点差:0.0001。
给定货币对的价差揭示了有关市场状况的信息,例如时间、波动性和流动性。
较大的点差可能会影响交易机会,这在短期交易方式中最为明显,例如剥头皮和日间交易,可能会增加交易成本并降低风险/回报。 对于长期交易方式(例如波段交易或头寸交易)来说,价差扩大的影响通常很小。
高(宽)价差被定义为大的买/卖价差。 例如,一个交易产品通常的点差为 1 点,我们假设现在的点差为 7 点,那么该产品的买入价可能为 1.0050 美元,卖出价为 1.0057 美元,显示出较大的价差;若按照通常1点的点差,1.0050 美元的相同买入价,对应卖出价为 1.0051 美元(这是 1 点差),即低价差。
点差
点差
我们的
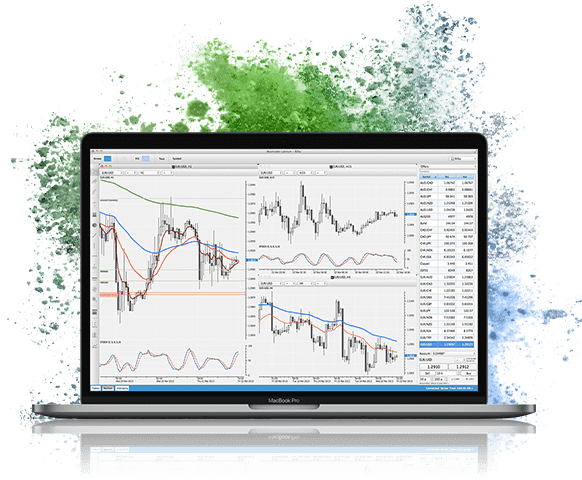
MetaTrader 4
平台上点差是浮动的,报价来自主要的国际金融机构。在流动性充足的时候,我们的行业领先点差可以低至0.0点。
以下是我们更典型的点差列表:
我们的
MetaTrader 4
平台上点差是浮动的,报价来自主要的国际金融机构。在流动性充足的时候,我们的行业领先点差可以低至0.0点。
以下是我们更典型的点差列表:
外汇点差

| 产品代码 | 交易产品 | 标准账户 | ECN账户 | ||
|---|---|---|---|---|---|
| 平均点差 | 最小点差 | 平均点差 | |||
| AUDCAD | Australian Dollar vs Canadian Dollar | 1.3 | 0 | 0.5 | |
| AUDCHF | Australian Dollar vs Swiss Franc | 1.9 | 0 | 0.8 | |
| AUDJPY | Australian Dollar vs Japanese Yen | 1.5 | 0 | 0.4 | |
| AUDNZD | Australian Dollar vs New Zealand Dollar | 1.8 | 0 | 1 | |
| AUDSGD | Australian Dollar vs Singapore Dollar | 3.3 | 0 | 1.8 | |
| AUDUSD | Australian Dollar vs US Dollar | 1.3 | 0 | 0.2 | |
| BWPUSD | Botswanan Pula vs US Dollar | 1.7 | 1 | 1.7 | |
| CADCHF | Canadian Dollar vs Swiss Franc | 1.6 | 0 | 0.8 | |
| CADJPY | Canadian Dollar vs Japanese Yen | 1.7 | 0 | 0.6 | |
| CHFJPY | Swiss Franc vs Japanese Yen | 2.9 | 0 | 1.8 | |
| CHFSGD | Swiss Franc vs Singapore Dollar | 4.8 | 0 | 3.7 | |
| EURAUD | Euro vs Australian Dollar | 1.8 | 0 | 0.7 | |
| EURCAD | Euro vs Canadian Dollar | 2 | 0 | 0.4 | |
| EURCHF | Euro vs Swiss Franc | 1.8 | 0 | 0.7 | |
| EURCZK | Euro vs Czech Koruna | 99.2 | 0 | 81.8 | |
| EURDKK | Euro vs Danish Krone | 11.4 | 1.1 | 5.4 | |
| EURGBP | Euro vs Great Britain Pound | 1.4 | 0 | 0.3 | |
| EURHUF | Euro vs Hungarian Forint | 229.8 | 0 | 16.3 | |
| EURJPY | Euro vs Japanese Yen | 1.6 | 0 | 0.5 | |
| EURMXN | Euro vs Mexican Peso | 63.2 | 0 | 43.2 | |
| EURNOK | Euro vs Norwegian Krone | 70.5 | 0 | 63 | |
| EURNZD | Euro vs New Zealand Dollar | 2.6 | 0 | 1.5 | |
| EURPLN | Euro vs Polish Zloty | 18.4 | 0 | 15.1 | |
| EURSEK | Euro vs Swedish Krona | 68.2 | 0 | 62.7 | |
| EURSGD | Euro vs Singapore Dollar | 2.4 | 0 | 1.3 | |
| EURTRY | Euro vs Turkish Lira | 1218.6 | 6.7 | 1215.6 | |
| EURUSD | Euro vs US Dollar | 1.2 | 0 | 0.1 | |
| EURZAR | Euro vs South African Rand | 84.1 | 0 | 72.6 | |
| GBPAUD | Great Britain Pound vs Australian Dollar | 2 | 0 | 0.9 | |
| GBPCAD | Great Britain Pound vs Canadian Dollar | 2.2 | 0 | 0.7 | |
| GBPCHF | Great Britain Pound vs Swiss Franc | 2.3 | 0 | 1.2 | |
| GBPDKK | Great Britain Pound vs Danish Krone | 27.6 | 5.1 | 21.6 | |
| GBPJPY | Great Britain Pound vs Japanese Yen | 2 | 0 | 0.9 | |
| GBPMXN | Great Britain Pound vs Mexican Peso | 76.8 | 0 | 56.8 | |
| GBPNOK | Great Britain Pound vs Norwegian Krone | 59.5 | 0 | 52 | |
| GBPNZD | Great Britain Pound vs New Zealand Dollar | 3.7 | 0 | 2.2 | |
| GBPPLN | Great Britain Pound vs Polish Zloty | 36.3 | 15 | 34.8 | |
| GBPSEK | Great Britain Pound vs Swedish Krona | 103.5 | 11.9 | 98.8 | |
| GBPSGD | Great Britain Pound vs Singapore Dollar | 3.1 | 0 | 1.9 | |
| GBPTRY | Great Britain Pound vs Turkish Lira | 1591.9 | 110.9 | 1584.9 | |
| GBPUSD | Great Britain Pound vs US Dollar | 1.4 | 0 | 0.3 | |
| NZDCAD | New Zealand Dollar vs Canadian Dollar | 1.3 | 0 | 0.5 | |
| NZDCHF | New Zealand Dollar vs Swiss Franc | 1.8 | 0 | 1 | |
| NZDJPY | New Zealand Dollar vs Japanese Yen | 1.8 | 0 | 0.7 | |
| NZDSGD | New Zealand Dollar vs Singapore Dollar | 3 | 0 | 1.9 | |
| NZDUSD | New Zealand Dollar vs US Dollar | 1.5 | 0 | 0.3 | |
| USDBRL | US Dollar vs Brazilian Real | 31.4 | 0 | 21.4 | |
| USDCAD | US Dollar vs Canadian Dollar | 1.5 | 0 | 0.4 | |
| USDCHF | US Dollar vs Swiss Franc | 1.8 | 0 | 0.7 | |
| USDCLP | US Dollar vs Chilean Peso | 589.5 | 60 | 589.5 | |
| USDCNH | US Dollar vs Chinese Yuan | 1.9 | 0 | 0.8 | |
| USDCOP | US Dollar vs Colombian Peso | 4754.3 | 0 | 4754.3 | |
| USDCZK | US Dollar vs Czech Koruna | 86 | 0 | 68.8 | |
| USDDKK | US Dollar vs Danish Krone | 14.7 | 0 | 8.7 | |
| USDHKD | US Dollar vs Hong Kong Dollar | 6.8 | 0.2 | 5.7 | |
| USDHUF | US Dollar vs Hungarian Forint | 227.2 | 0 | 13.8 | |
| USDINR | US Dollar vs Indian Rupee | 21.1 | 9.9 | 11.1 | |
| USDJPY | US Dollar vs Japanese Yen | 1.3 | 0 | 0.3 | |
| USDKES | US Dollar vs Kenyan Shilling | 10545.7 | 7862.4 | 10545.7 | |
| USDKRW | US Dollar vs Korean Won | 59.9 | 19 | 49.9 | |
| USDMXN | US Dollar vs Mexican Peso | 39.8 | 0 | 33.8 | |
| USDNOK | US Dollar vs Norwegian Krone | 61.4 | 0 | 52.9 | |
| USDPLN | US Dollar vs Polish Zloty | 18.1 | 0 | 14.4 | |
| USDSEK | US Dollar vs Swedish Krona | 58.1 | 0 | 49.4 | |
| USDSGD | US Dollar vs Singapore Dollar | 1.6 | 0 | 0.8 | |
| USDTHB | US Dollar vs Thai Baht | 175.9 | 0 | 155.9 | |
| USDTRY | US Dollar vs Turkish Lira | 339.6 | 10.1 | 337.1 | |
| USDTWD | US Dollar vs New Taiwan dollar | 2.8 | 0 | 2.8 | |
| USDUGX | US Dollar vs Ugandan Shilling | 338.4 | 240.8 | 338.4 | |
| USDZAR | US Dollar vs South African Rand | 54.5 | 0 | 43.6 | |
| USDZMW | US Dollar vs Zambian Kwacha | 1201.8 | 360.3 | 1201.8 | |
贵金属点差
| 产品代码 | 交易产品 | 标准账户 | ECN账户 | ||
|---|---|---|---|---|---|
| 最小点差 | 平均点差 | ||||
| XAGAUD | Silver vs Australian Dollar | 0.03 | 0.004 | 0.022 | |
| XAGEUR | Silver vs Euro | 0.02 | 0.004 | 0.012 | |
| XAGUSD | Silver vs US Dollar | 0.02 | 0 | 0.012 | |
| XAUAUD | Gold vs Australian Dollar | 0.62 | 0.06 | 0.52 | |
| XAUEUR | Gold vs Euro | 0.37 | 0 | 0.19 | |
| XAUUSD | Gold vs US Dollar | 0.2 | 0 | 0.07 | |
| XPDUSD | Palladium vs US Dollar | 9.96 | - | - | |
| XPTUSD | Platinum vs US Dollar | 2.91 | - | - | |
| XPBUSD | Lead vs US Dollar | 3.62 | 2 | 3.48 | |
| XZNUSD | Zinc vs US Dollar | 3.39 | 2.27 | 3.25 | |
| XNIUSD | Nickel vs US Dollar | 21.47 | 15.44 | 21.33 | |
| XALUSD | Aluminum vs US Dollar | 3.44 | 1.95 | 3.3 | |
| XCUUSD | Copper vs US Dollar | 5.24 | 3.05 | 5.1 | |
| XAUGBP | Gold vs Great Britain Pound | 0.37 | 0.06 | 0.25 | |
| XAUSGD | Gold vs Singapore Dollar | 0.72 | 0.04 | 0.53 | |
| XAGSGD | Silver vs Singapore Dollar | 0.024 | 0.005 | 0.018 | |
| XAUCNH | Gold vs Chinese Renminbi | 3.57 | 0.66 | 2.55 | |
差价合约指数点差
| 产品代码 | 交易产品 | 标准账户 | |||
|---|---|---|---|---|---|
| 最小点差 | 平均点差 | ||||
| AUS200 | Australia 200 Index vs Australian Dollar Cash | - | 1.55 | ||
| CHINA50 | China A50 Index vs US Dollar Cash | - | 7.69 | ||
| EURO50 | Euro 50 Index vs Euro Cash | - | 1.84 | ||
| FRA40 | CAC 40 Index vs Euro Cash | - | 1.89 | ||
| GER40 | German 40 Index vs Euro Cash | - | 1.29 | ||
| HK50 | Hang Seng Index vs Hong Kong Dollar Cash | - | 4.46 | ||
| ITA40 | Italy 40 index vs Euro Future | - | 15 | ||
| JP225 | Japan 225 Index vs Japanese Yen Cash | - | 4.9 | ||
| SPA35 | Spain 35 Index vs Euro Cash | - | 6.6 | ||
| UK100 | UK100 Index vs Great Britain Pound Cash | - | 1.23 | ||
| US100 | US Tech 100 Index vs US Dollar Cash | - | 1.49 | ||
| US30 | US 30 Index vs US Dollar Cash | - | 1.39 | ||
| US500 | US 500 Index vs US Dollar Cash | - | 0.51 | ||
| USDX | USD Index Basket vs US Dollar Future | - | 0.05 | ||
| VIX | VIX Index Cash vs US Dollar Future | - | 0.15 | ||
大宗商品差价合约 (MT4/MT5)
大宗商品差价合约 (MT4/MT5)
| 产品代码 | 交易产品 | 标准账户 | |||
|---|---|---|---|---|---|
| 最小点差 | 平均点差 | ||||
| COCOA | Cocoa vs US Dollar Cash | - | 3.1 | ||
| COFFEE | US Coffee vs US Dollar Future | - | 0.69 | ||
| CORN | Corn vs US Dollar Cash | - | 0.71 | ||
| SOYBEANS | Soybeans vs US Dollar Cash | - | 1.11 | ||
| WHEAT | Wheat vs US Dollar Cash | - | 2.11 | ||
| COTTON | Us Cotton No.2 vs US Dollar Future | - | 2.2 | ||
| SUGAR | Us Sugar No.11 vs US Dollar Future | - | 2.06 | ||
| WTI | West Texas Intermediate Crude Oil vs US Dollar Future | - | 0.02 | ||
| XBRUSD | Brent Crude Oil vs US Dollar Cash | - | 0.03 | ||
| XNGUSD | Natural Gas vs US Dollar Cash | - | 0.02 | ||
| XTIUSD | West Texas Intermediate Crude Oil vs US Dollar Cash | - | 0.03 | ||
| BRENT | Brent Crude Oil vs US Dollar Future | - | 0.03 | ||
加密货币点差
| 产品代码 | 交易产品 | 标准账户 | |||
|---|---|---|---|---|---|
| 最小点差 | 平均点差 | ||||
| ADAUSD | Cardano vs US Dollar | - | 0.0046 | ||
| BCHUSD | Bitcoin Cash vs US Dollar | - | 1.94 | ||
| BTCUSD | Bitcoin vs US Dollar | - | 26.94 | ||
| DOGUSD | Dogecoin vs US Dollar | - | 0.0017 | ||
| DOTUSD | Polkadot vs US Dollar | - | 0.06 | ||
| EOSUSD | EOS vs US Dollar | - | 0.0041 | ||
| ETHUSD | Etherium vs US Dollar | - | 4.05 | ||
| LNKUSD | Chainlink vs US Dollar | - | 0.066 | ||
| LTCUSD | Litecoin vs US Dollar | - | 1.13 | ||
| RPLUSD | Ripple vs US Dollar | - | 0.001 | ||
| SOLUSD | Solana vs US Dollar | - | 1.076 | ||
| XLMUSD | Stellar vs US Dollar | - | 0.00242 | ||
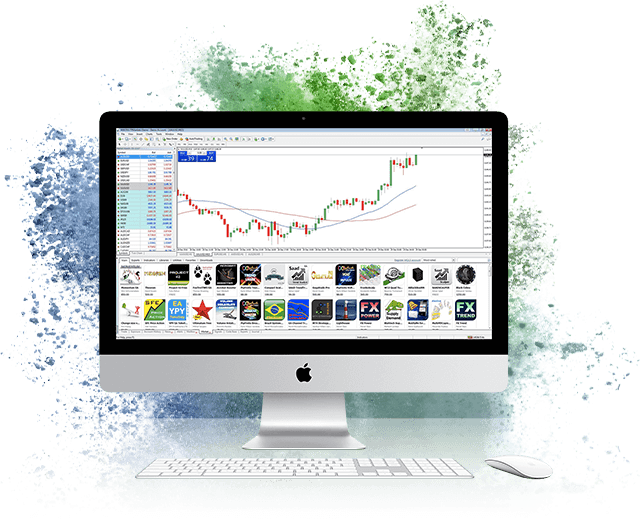
 可交易10,000+金融产品 支持自动交易系统 提供最新新闻播报&财经日历 多种技术指标&图表 提供更多交易工具
通过提供电子邮件,您接受 FP Markets的 隐私政策 并同意接收FP Markets 发来的邮件。 您可以随时取消订阅。