
As the US dollar continues to find grip at higher levels—underpinned by a rally in US government yields—the price of spot gold (XAU/USD) is in relatively deep water.
Higher-Timeframe Picture Shows Gold Approaching Support
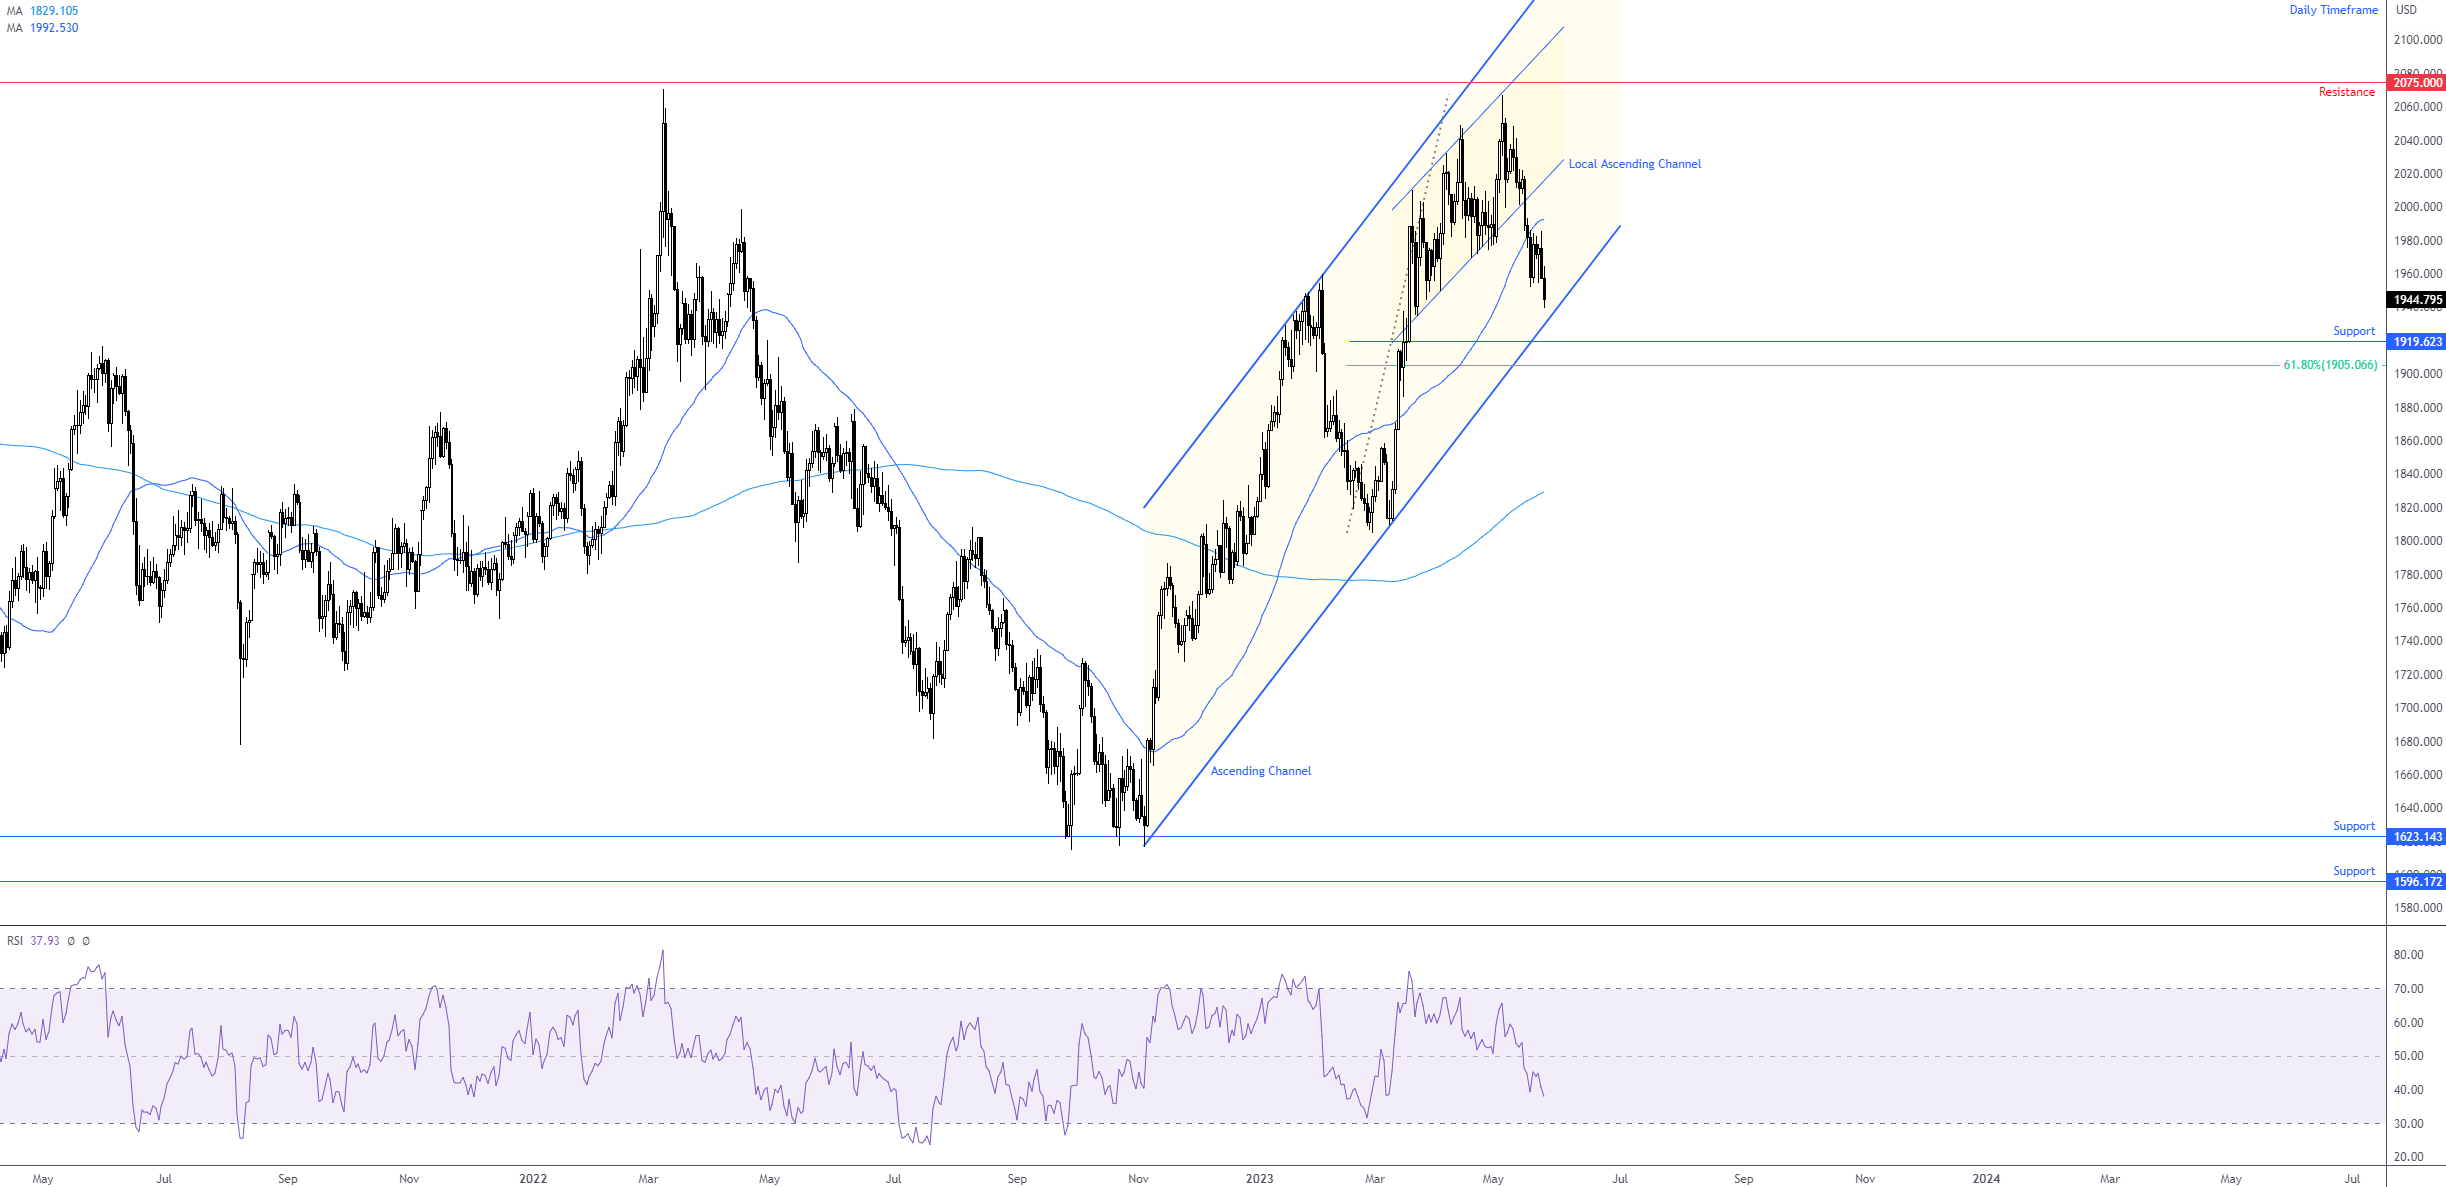
Medium-term price action on the daily chart exhibits scope to extend losses. The longer-term ascending channel is interesting (drawn from $1,641 and $1,959). Note that price action FAILED to touch gloves with the upper boundary in recent trading, pencilling in highs just ahead of the all-time high of $2,075. This tells me that sellers are more active at this point, a bearish vibe that was further emphasised through not only negative divergence out of the Relative Strength Index (RSI), but also price action taking out the lower boundary of a local ascending channel (taken from $2,009 and $1,934) and subsequently pursuing ground south of the 50-day simple moving average at $1,992. Furthermore, note that the RSI is cementing position under the 50.00 centreline (negative momentum) and shows room to press lower.
The current position of price will also likely draw more attention to the yellow metal, as the longer-term channel support is poised to welcome gold. Should sellers continue to command control and tunnel lower here, support at $1,919 could be challenged (a level braced by additional Fibonacci support [61.8%] at $1,905). If price manoeuvres under the aforementioned support zone, we could see the unit take aim as far south as the 200-day simple moving average at $1,829.
Daily Chart:
 Short-Term Support Breach?
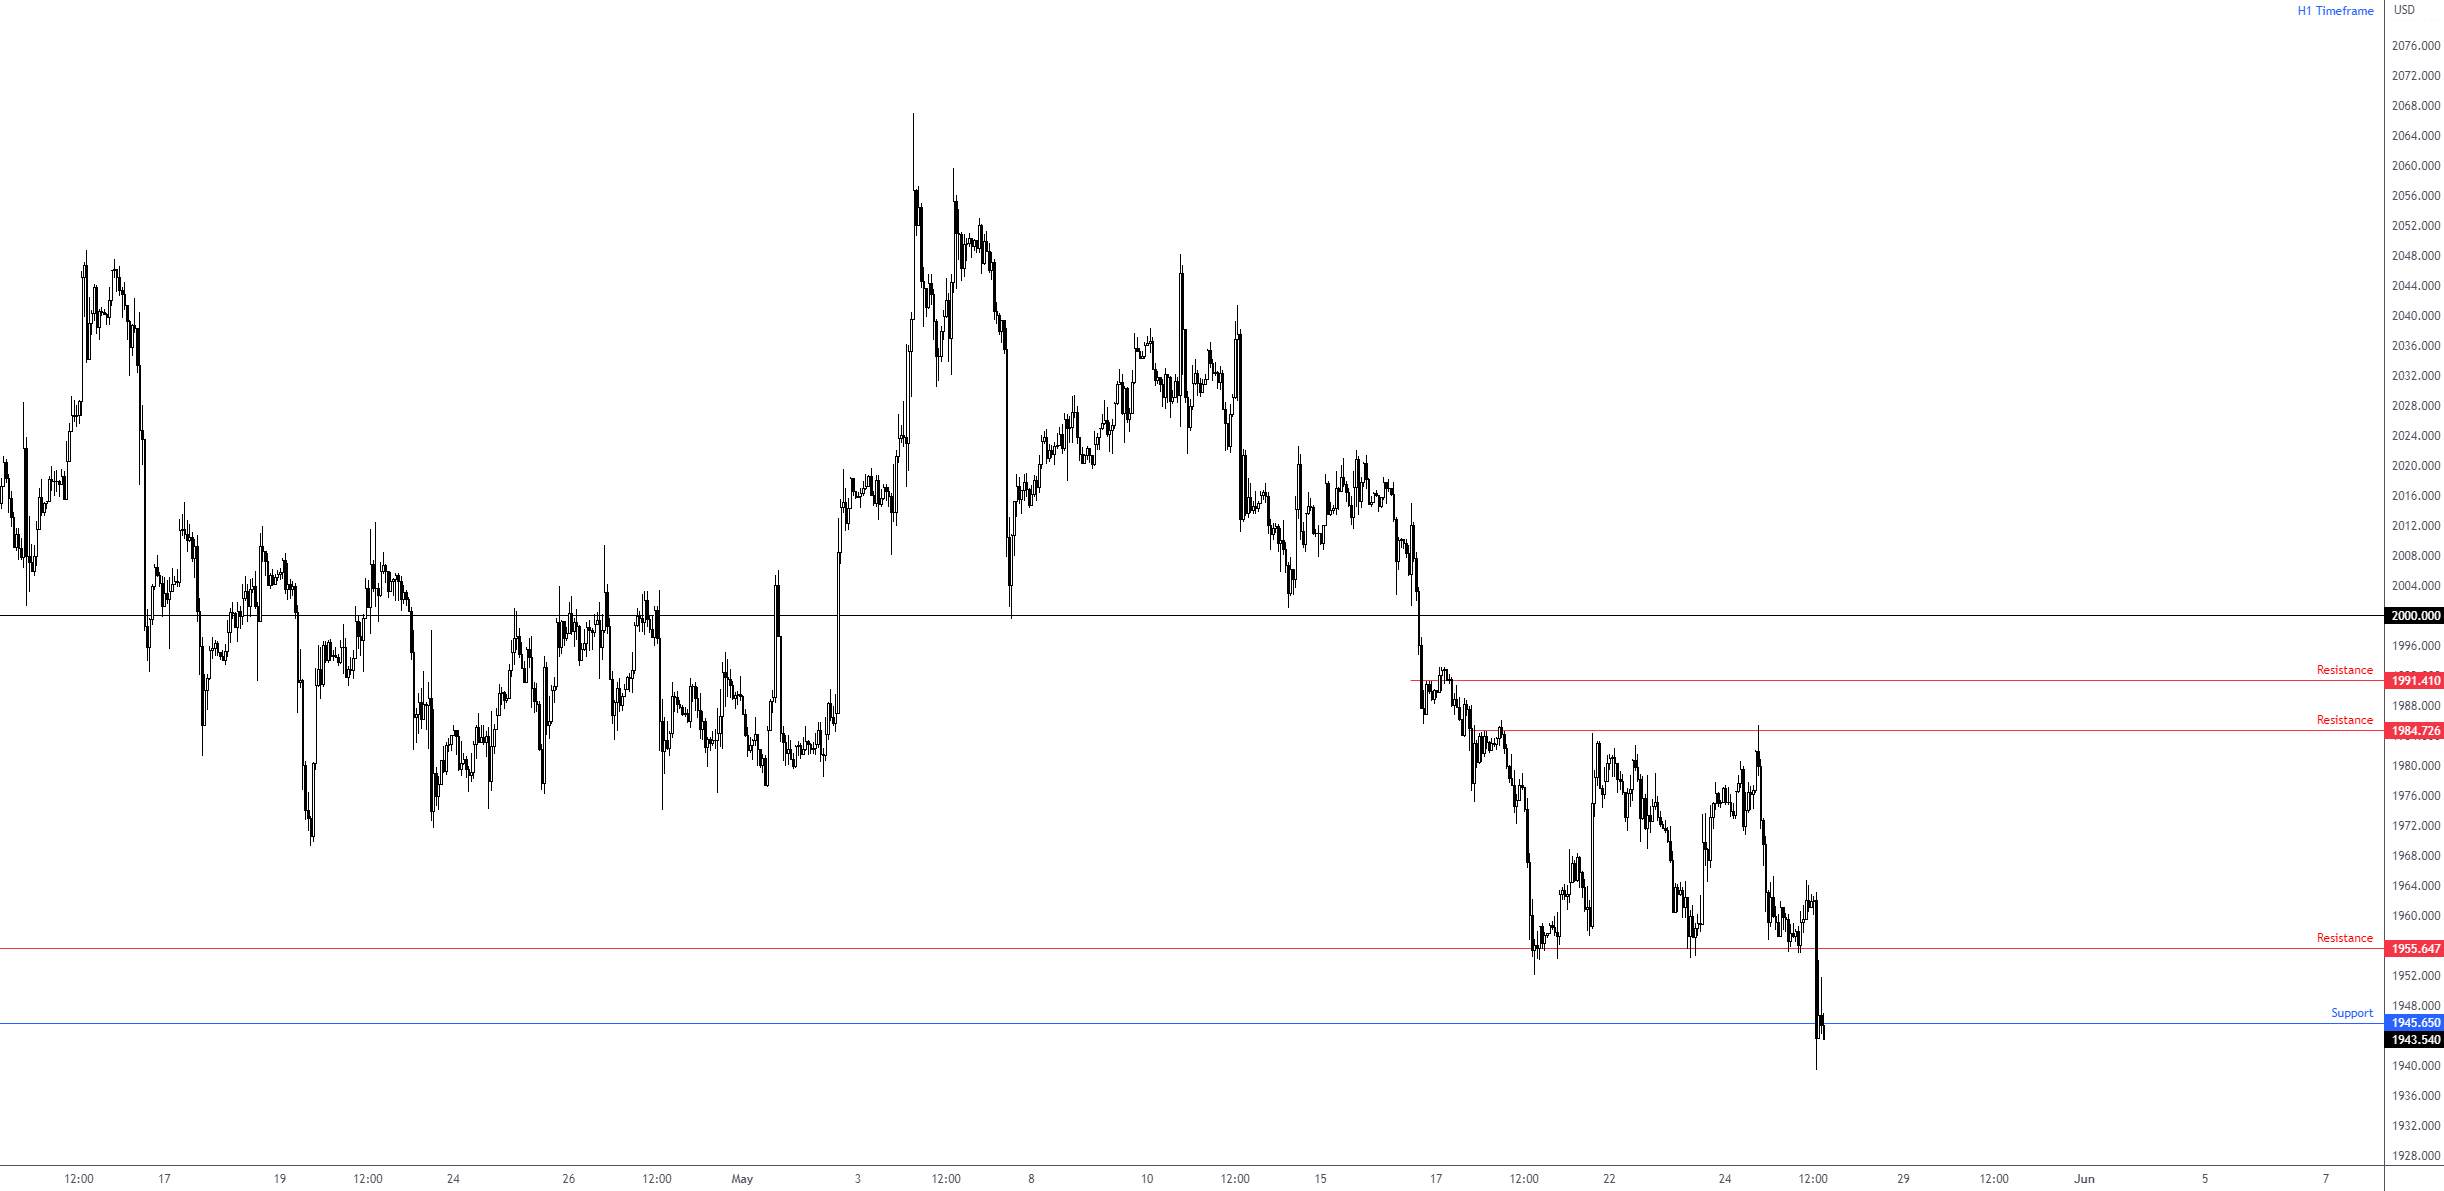
While the bigger picture (daily chart) displays room to push lower, H1 support at $1,945 is vulnerable. Overhead resistance at $1,955 remains on the radar, but the zone surrounding the base (often recommended to draw support/resistance as a zone rather than a defined price point) has been tested.
Therefore, a decisive H1 close south of current support could encourage breakout selling, targeting the longer-term daily channel support noted above.
H1 Chart:
 Charts: TradingView
DISCLAIMER:
The information contained in this material is intended for general advice only. It does not take into account your investment objectives, financial situation or particular needs. FP Markets has made every effort to ensure the accuracy of the information as at the date of publication. FP Markets does not give any warranty or representation as to the material. Examples included in this material are for illustrative purposes only. To the extent permitted by law, FP Markets and its employees shall not be liable for any loss or damage arising in any way (including by way of negligence) from or in connection with any information provided in or omitted from this material. Features of the FP Markets products including applicable fees and charges are outlined in the Product Disclosure Statements available from FP Markets website, www.fpmarkets.com and should be considered before deciding to deal in those products. Derivatives can be risky; losses can exceed your initial payment. FP Markets recommends that you seek independent advice. First Prudential Markets Pty Ltd trading as FP Markets ABN 16 112 600 281, Australian Financial Services License Number 286354.


 Access +10,000 financial
instruments
Access +10,000 financial
instruments