Financial trading refers to the practice of buying and selling financial assets – through either an organised public exchange or an over-the-counter market (OTC) – typically using short-term timeframes. Investing, on the other hand, generally seeks larger returns over extended periods via buying and holding.
CFDs, or contract for differences, are leveraged products, financial instruments offering a unique and cost-effective method of trading the financial markets. Despite their relative infancy, introduced in the early 1990s as a way of hedging exposure using leverage, nobody could have anticipated the immense popularity CFDs have gained.
CFD products trade OTC through a network of CFD brokers (CFD providers), and operate by mirroring the price of underlying markets. CFDs represent an agreement, or contract, between buyers and sellers to exchange the difference between the opening price and closing price.
Equity CFDs
Traders often confuse CFDs with underlying instruments (also sometimes referred to as underlying securities or underlying assets); a CFD position, or CFD trade, is based on an agreement. In terms of share CFDs (think Apple [AAPL] or Google [GOOGL] stock), therefore, no physical shares change hands.
One of the benefits of CFDs is the freedom to easily trade rising and falling markets (long [buy] and short [sell]). Another appealing feature of CFD products is the ability to hedge share positions, executing a position in the opposite direction of a share trade to offset any potential losses.
Trading Approach
Two primary ways of analysing the financial markets are fundamental and technical analysis, with the latter generally a favoured path among retail traders (retail investors).
Fundamental analysis typically informs traders of what to buy, while technical analysis suggests when to buy.
Fundamental analysis
Fundamental analysts, in terms of equities trading, attempt to gather insight from the economic environment, both domestically and globally. Additionally, analysts also look at interest rates, along with the company’s structure and earnings (from financial statements), to calculate intrinsic value in search of undervalued stocks. This is a price, a fair value, where investors believe the stock should be trading.
If stocks trade above their intrinsic value, it’s a candidate to be sold because it may be overvalued. Conversely, stocks trading below their intrinsic value can be considered undervalued and represent a potential buying opportunity.
Fundamental analysis can be broken down into two categories, quantitative and qualitative.
Quantitative analysis is measured in numerical terms. Within financial statements, analysts focus on variables such as earnings, debt, EPS (earnings per share) and the P/E ratio (price-to-earnings ratio). Analysts use these metrics to compare companies in the same industry.
Qualitative analysis cannot be measured numerically – values that essentially cannot be quantified. An example of qualitative analysis is a term coined by Warren Buffet: economic moat. This represents a company’s ability to retain its position and keep competitors at bay.
Technical analysis
Technical analysis is the opposite of fundamental analysis.
Technical analysis involves the study of historical price trends to forecast the future direction of a stock. Price movement and volume are key components.
Technical analysis is incredibly adaptable, used across a number of different trading strategies and trading styles: scalpers, day traders, swing traders, and position (long term) traders, for example.
Trading strategies can include moving averages, Fibonacci studies, and various technical indicators, such as the relative strength index (RSI). Price-action studies have also become increasingly popular: the application of things like support and resistance levels, supply and demand areas, and trendline studies. Regardless of the trading strategy employed, risk-management and money-management systems are also necessary additions to any trading plan.
CFD Trading – Fees and Charges
Share CFDs traded with FP Markets, based on Iress trading platforms, incur a commission instead of a marked up spread.
Compared with the MT4 platform, which offers approximately 50 share CFDs, Iress has more than 10,000 share CFDs to choose from.
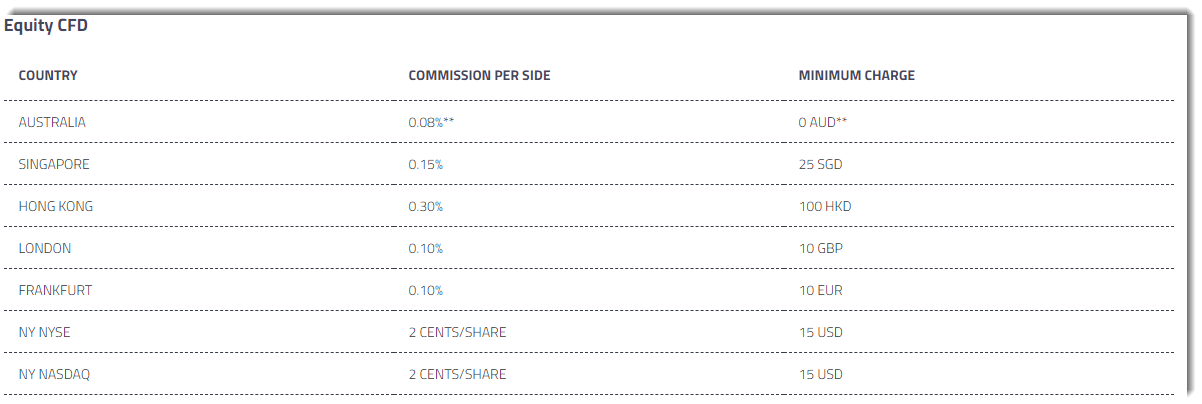
As shown in figure 1.A, the commission structure based on US share CFDs is 2 cents each share. For countries other than the US, the commission is calculated as a percentage of the position value. Note, however, minimum charges apply, as demonstrated below (underlined).
Also, bear in mind, commission rates apply to each side of the trade – Commission Per Side.
UK Share CFDs
Commission rates for London (UK) share CFDs (figure 1.A), which is 0.10% per side, with a minimum charge of £10.
Vodaphone, a household name in many countries around the world regarding mobile telecommunications, currently trades at 129.42p. This value does not represent £129.42p. UK share prices are quoted in pence. 129.42 pence is approximately £1.29.
A 1000-unit trade-in Vodaphone at a share price of 129.42p incurs a commission of approximately £1.29 per side, or a £2.58 round-turn charge.
1000 units x Vodaphone’s share price of £1.29 = £1,290, the position’s total value. Multiply this value by 0.10% = £1.29 per side, or £2.58 in total commissions.
Commission, in the case of this trade, is less than the minimum £10 charge. FP Markets, therefore, would apply a £10 commission in its place.
(FIGURE 1.A)
US Share CFDs
The commission structure for US share CFDs (figure 1.A), is based on 2 cents each share, with a minimum commission charge of $15.
Unlike UK shares, US equities are quoted in dollars.
Bank of America, an American multinational investment bank, currently trades at $22.90.
A 1000-unit trade in Bank of America at a share price of $22.90, with a total position value of $22,900, incurs a $20 commission per side, or a $40 round-turn charge.
1000 units x $0.02 (commission per unit) = $20, above the $15 minimum commission charge.
Dividends
Unlike purchasing shares outright, shareholder rights are limited to CFDs.
CFD positions, however, are adjusted to offset changes from dividends. A dividend credit is received when entered into a long position (buy), though short selling share CFDs can bring with it a dividend debit.
Financing
While MT4 incurs a swap debit/credit, share CFDs incur what is known as financing. Similarly, this is a debit/credit for any CFD positions held overnight.
Executing and holding a long CFD position overnight will invite interest; holding a short position, however, could have the trader receive interest from FP Markets. For more detailed information, check out this page.
Start Trading
For those looking to start trading, consider opening a demo account (this is a simulated trading account using live market prices). Here, you’ll have the ability to familiarise yourself with the platform’s functions.
To help stay informed, new and experienced traders can also visit our dedicated Trader’s Hub, a space where industry experts analyse global markets using technical and fundamental analysis.
Disclaimer: The information contained in this material is intended for general advice only. It does not take into account your investment objectives, financial situation, or particular needs. FP Markets has made every effort to ensure the accuracy of the information as at the date of publication. FP Markets does not give any warranty or representation as to the material. Examples included in this material are for illustrative purposes only. To the extent permitted by law, FP Markets and its employees shall not be liable for any loss or damage arising in any way (including by way of negligence) from or in connection with any information provided in or omitted from this material. Features of the FP Markets products including applicable fees and charges are outlined in the Product Disclosure Statements available from FP Markets website, www.fpmarkets.com, and should be considered before deciding to deal with those products. Derivatives can be high risk; losses can exceed your initial payment. FP Markets recommends that you seek independent advice. First Prudential Markets Pty Ltd trading as FP Markets ABN 16 112 600 281, Australian Financial Services License Number 286354.


 Access +10,000 financial
instruments

