Charts: Trading View
US Dollar Index:
According to the US Dollar Index, the US dollar wrapped up the week on the ropes, shedding more than 1.0%. Month over month, however, the buck trades 0.3% lower, poised to snap a four-month bullish phase, shaped by way of a monthly long-legged doji indecision candle.
Overall, the technical (medium- and long-term) picture remains largely unchanged (italics):
Apart from a 7-year range (forming a pennant chart pattern [considered a continuation signal], taken from 103.82 and 88.25), monthly movement has been higher since early 2008. This is reinforced by the uptrend visible on the daily timeframe, exhibiting well-defined upward action since May 2021. The upside bias is also shown through the 50-day simple moving average (current: 110.51) crossing above the 200-day simple moving average (current: 103.70) in August 2021 (‘Golden Cross’).
In terms of price, the monthly timeframe is comfortably north of support at 109.25 and communicates scope to reach Quasimodo resistance at 119.07. Rupturing the aforementioned barrier, together with the 121.02 July high (2001), unearths the pennant pattern’s profit objective at an ‘ambitious’ 134.40. A closer reading of price on the daily timeframe shows we rejected space just south of Quasimodo resistance at 115.09 at the end of September, drawn from 2002. Subsequent action witnessed a test of a well-placed decision point from 109.31-110.24 at the beginning of October. Note that the decision point is situated near the 50-day simple moving average, an acceleration trendline support, drawn from the low 95.17, as well as a potential AB=CD bullish pattern (100% projection at 109.19) that’s complemented by neighbouring Fibonacci ratios. As for the daily chart’s relative strength index (RSI), the indicator is toying with the upper boundary of familiar support between 40.00 and 50.00 (active since August 2021). Interestingly, however, the monthly timeframe’s RSI is nearing the March 2015 high at 82.87 within overbought territory (though it must be noted that the RSI can remain overbought for prolonged periods in trending environments).
Technical Expectation:
Technical evidence continues to favour USD bulls, despite October threatening to close lower. The lower side of the daily timeframe’s decision point at 109.31-110.24, together with the daily accelerating trendline support and the daily AB=CD bullish formation is space likely viewed favourably among technical (bullish) traders this week (confluence). The combination of monthly support at 109.25 (with room to move higher), the long-term uptrend and daily RSI support strengthens the aforementioned technical confluence. As a result, continued defence of the daily decision point AREA is anticipated, followed by an eventual break of the daily Quasimodo resistance from 115.09 that could see the index refresh 20-year tops.
 EUR/USD:
Europe’s single currency outperformed its US counterpart last week, adding 1.42%. While Friday engulfed Thursday’s action on the daily timeframe (not a bullish outside reversal as there must be a down move that precedes the formation), this is not a market I see buyers voicing confidence in.
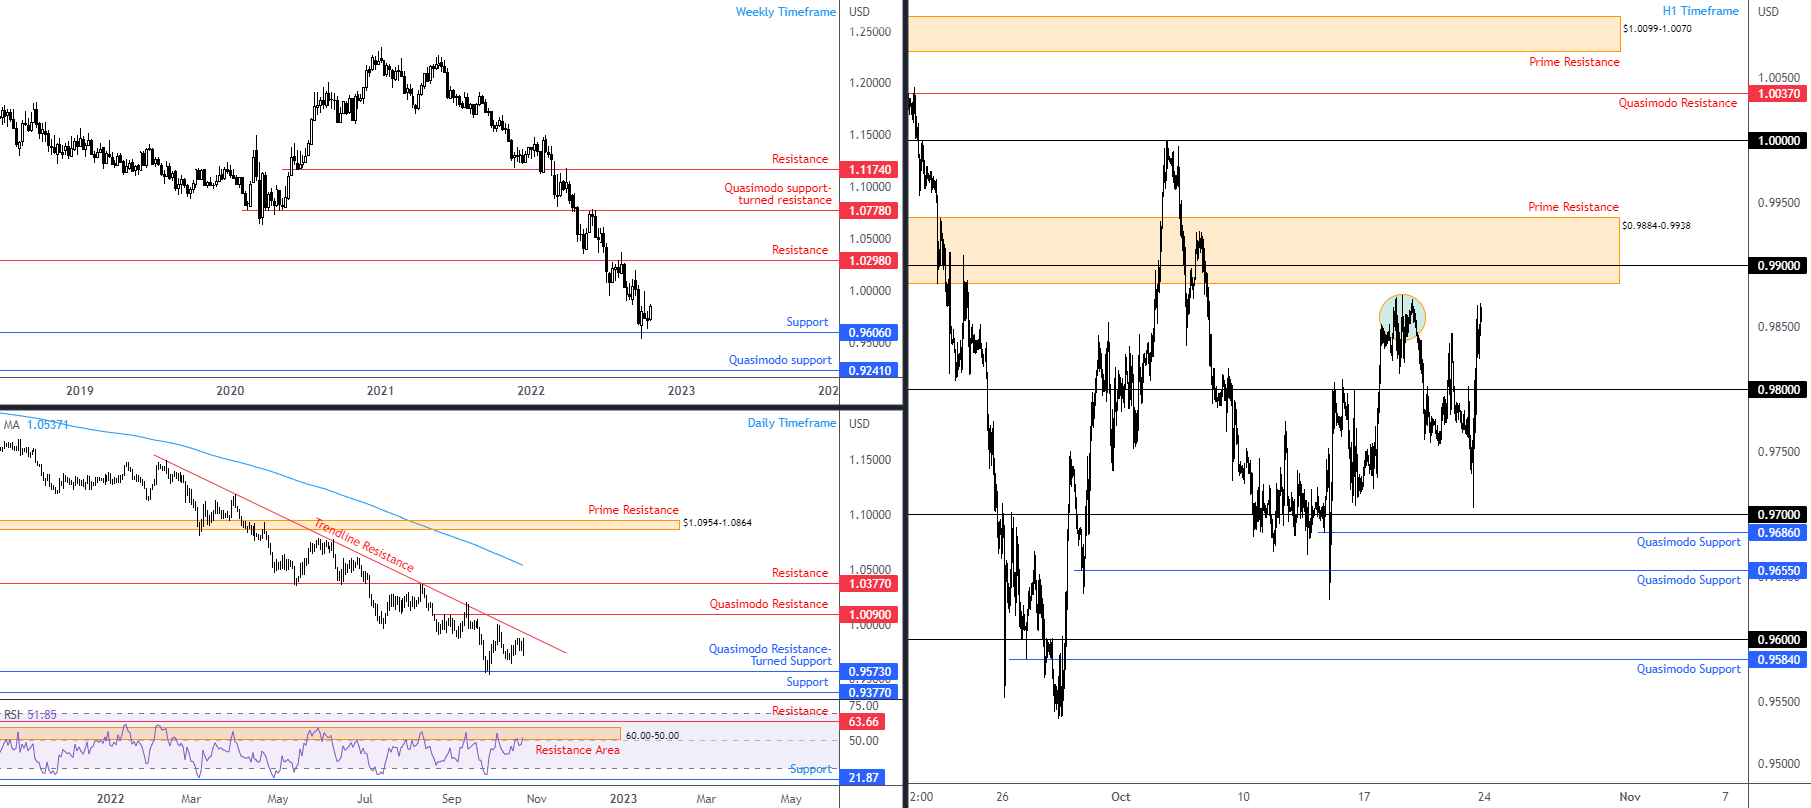
Front and centre, of course, is trend direction. Price action on the weekly timeframe has been entrenched in an unmistakable bear trend since pencilling in a top in early 2021 with heavy-handed pullbacks in short supply. Additionally, the daily timeframe’s price movement continues to work under its 200-day simple moving average ($1.0537), with the downside bias also recognised by way of the daily timeframe’s trendline resistance, extended from February’s high of $1.1495. Adding to the bearish narrative is the daily chart’s relative strength index (RSI) retesting resistance between 60.00 and 50.00. Note that this area has been active since October 2021 and is common to view such resistance in downtrends.
Higher timeframe support to remain aware of this week and possibly as we step into November are weekly support from $0.9606 and daily Quasimodo resistance-turned support from $0.9573. Beyond the aforesaid barrier, daily support calls for attention at $0.9377.
Drilling down to the H1 timeframe, price seesawed around the $0.98 psychological barrier since Wednesday, forging a high of $0.9846 on Thursday and a low of $0.9705 on Friday. The week concluded at an interesting position and will perhaps intrigue technical traders in early trading. We closed within striking distance of around $0.9874 tops (green circle), located a whisker south of prime resistance from $0.9884-0.9938, an area I’ve touched upon a handful of times last week. While $0.9884-0.9938 is likely to appear this week (in order to take advantage of any liquidity [buy-stops] above $0.9874) the currency pair may also witness a stop-run north of $0.99 (which is housed within the noted prime resistance), consequently hauling price higher into the zone’s range (to test the daily trendline resistance) before sellers attempt to make a show. Regarding support, $0.98 is an obvious location in the short term.
Technical Expectation:
According to chart studies, H1 prime resistance from $0.9884-0.9938 and intersecting daily trendline resistance is space likely to appeal to bears should the noted zones welcome price action. Notably, this is bolstered by the longer-term bearish trend and daily RSI resistance from between 60.00 and 50.00.
 AUD/USD:
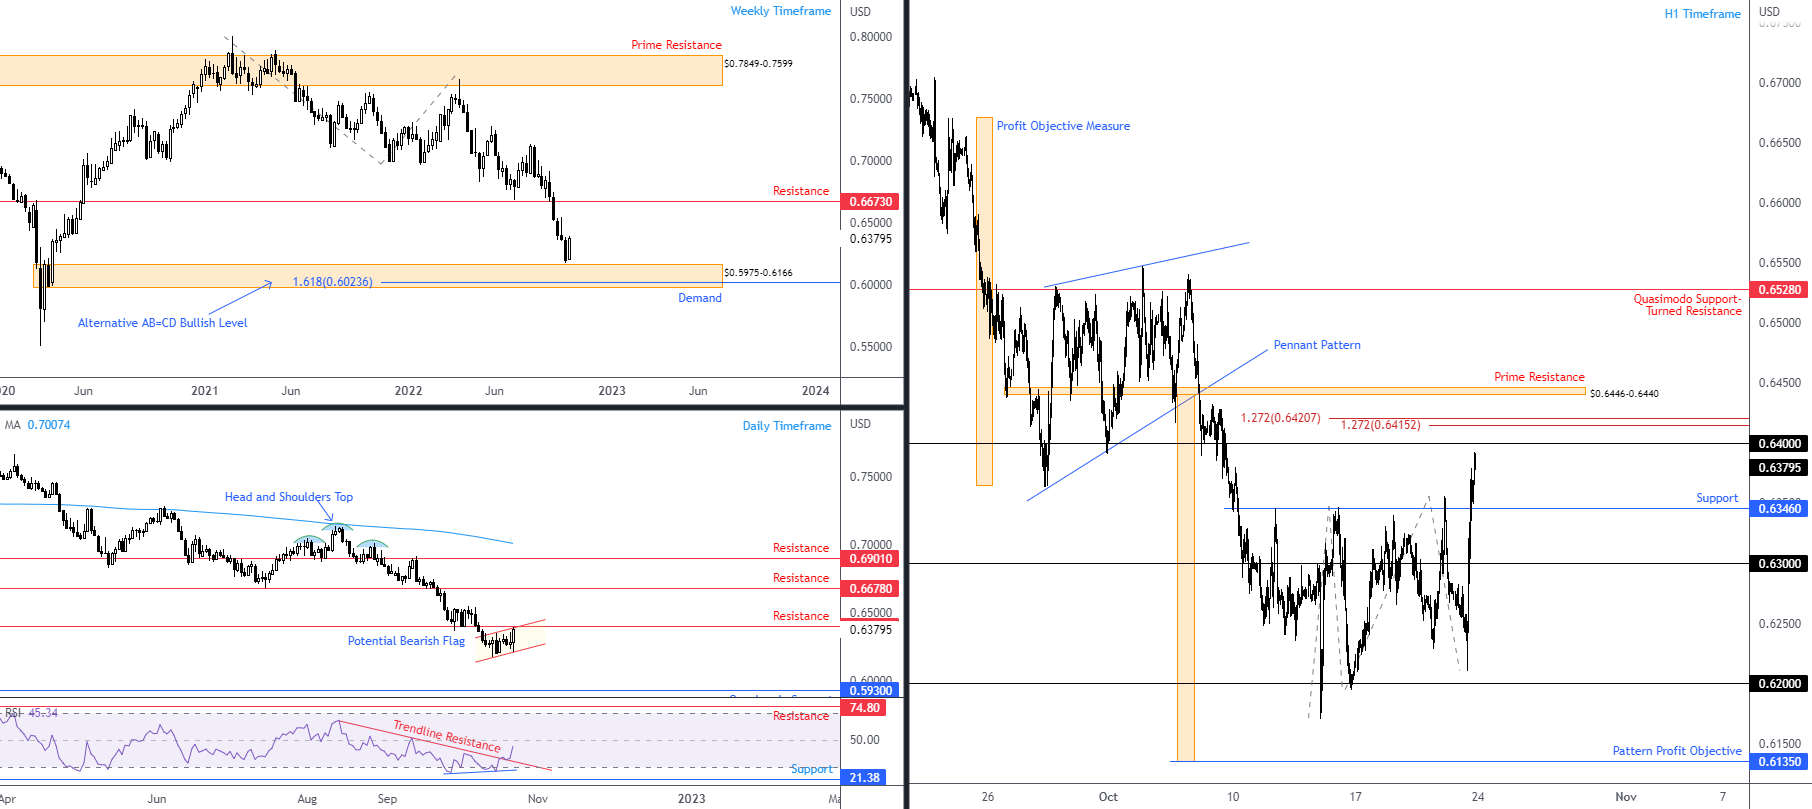
Procyclical currencies had a stellar week. The Australian dollar, in line with broader (upbeat) risk sentiment, climbed nearly 3.0% versus the US dollar and snapped a five-week losing streak for the beleaguered AUD/USD pair. Curiously, price forged its recent bottom a whisker above weekly demand at $0.5975-0.6166, a base that houses a 1.618% Fibonacci projection ratio at $0.6024 (an ‘alternate’ AB=CD pattern). While last week did indeed erase the prior week’s losses, is it enough to create an environment of confidence in this market? The trend says no, though if we see a pullback on the weekly scale, resistance is limited until $0.6673. Price has reflected a bear trend since $0.8007 (22nd Feb high [2021]) on the weekly; the monthly timeframe has also portrayed a longer-term downtrend since August 2011, indicating the rally from the pandemic low of $0.5506 (March 2020) to a high of $0.8007 (February 2021) on the weekly timeframe is viewed as a deep pullback among chartists.
Meanwhile, on the daily timeframe, the relative strength index (RSI), a popular momentum gauge, observed a trendline resistance breach, drawn from the high 64.39. This follows positive (regular) divergence and draws the indicator’s value to within touching distance of the 50.00 centreline. You will also note price movement is nearing the underside of resistance at $0.6401 and is testing the upper boundary of a potential bearish flag pattern (low: $0.6170 high: $0.6347). $0.6401 resistance, therefore, will be a test for bulls this week. A close higher suggests strength and further buying to at least daily resistance at $0.6678 (nearby the weekly resistance), whereas a rejection, and close below the daily bearish flag pattern’s lower limit, signals moves into the current weekly demand zone.
Short term, the H1 timeframe has buyers and sellers battling for position nearby the underside of $0.64. This will be of interest to traders early week (round numbers tend to generate attention). However, it’s the price levels above this psychological level that may draw attention. Two 1.272% Fibonacci projection ratios at $0.6421 and $0.6415, as well as prime resistance at $0.6446-0.6440 are key areas to be mindful of. A whipsaw above $0.64, therefore, could have sellers attempt to fade buy-stop momentum north of the figure at the aforementioned resistances, which might pull the currency pair back to support at $0.6346.
Technical Expectation:
While a surge in buying unfolded above weekly demand last week at $0.5975-0.6166, bearish technical elements overshadow any bullish indications now: the combination of the long-term downtrend, daily resistance at $0.6401 and a potential daily bearish flag.
Should a (bull trap) stop-run above $0.64 emerge, therefore, into either the H1 1.272% Fibonacci projection ratios at $0.6421 and $0.6415 or prime resistance at $0.6446-0.6440, this will likely see H1 price target at least support from $0.6346.
 USD/JPY:
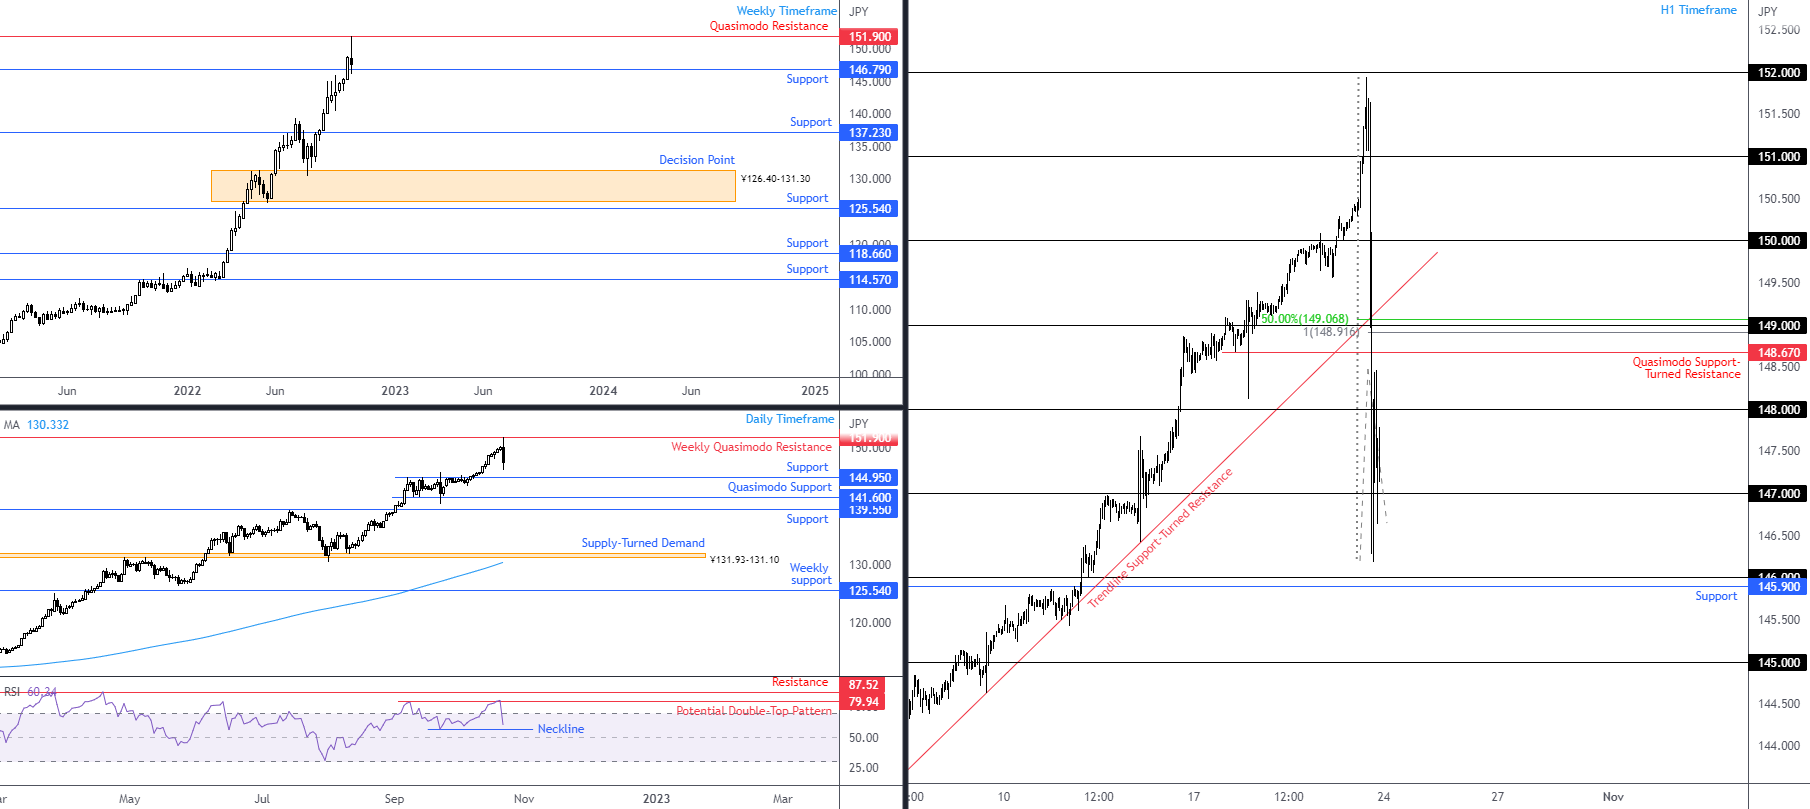
Despite refreshing 24-year tops of ¥151.94, Friday witnessed a sharp 560-pip sell-off amid US trading hours, touching a low of ¥146.18. This, according to Reuters, is likely due to Japanese authorities intervening in markets to stem the slide of the country’s currency.
The week, therefore, ended on the back foot, down 0.72% and snapping a nine-week winning streak. This saw weekly price action scrape the lower side of Quasimodo resistance at ¥151.90 almost to the pip before dropping in on weekly support from ¥146.79. Overall, Friday’s dramatic sell-off has not made much of a dent in weekly structure, yet if further selling transpires this week and clears ¥146.79, dropping to weekly support at ¥137.23 could be on the table. But for now, at least, buyers remain in control and the long-term trend is intact (higher since 2021).
Out of the daily timeframe, following the rejection of the weekly resistance, an unmistakable daily bearish outside reversal materialised on Friday, aided by the daily chart’s relative strength index (RSI) potential double-top at 79.94. The pattern’s neckline can be seen at 56.73 (blue line). To the downside on the price chart, support falls in at ¥144.95.
Across the page on the H1 timeframe, Friday’s movement took the currency pair from just beneath ¥152 at 12 pm to just ahead of ¥146 at 4 pm GMT. As you can see, ¥147 stood ground, despite the initial offensive, and sponsored a pullback to ¥148. The two aforementioned levels, therefore, will be talking points in early trading this week. Outside of this area, Quasimodo support-turned resistance at ¥148.67 is visible, accompanied closely by ¥149, a 50.0% retracement at ¥149.07, a 100% projection at ¥148.92 and a trendline support-turned resistance, drawn from the low ¥143.52. While beneath ¥147 turns attention to ¥146 and support from ¥145.90.
Technical Expectation:
The combination of ¥149, the H1 Quasimodo support-turned resistance at ¥148.67, the daily timeframe’s bearish outside reversal and weekly Quasimodo resistance at ¥151.90 could be enough to encourage further short-term selling if ¥149-148.67 enters the fray this week. However, any bearish episode must contend with not only weekly support from ¥146.79, but also the current long-term uptrend.
As a result of the above, this is a tricky market to forecast; it’ll be interesting to see how market participants react to Friday’s movement this week.
 GBP/USD:
Sterling finished higher for a second consecutive week against the US dollar, climbing 1.06%. But this changes little in the overall scheme of things.
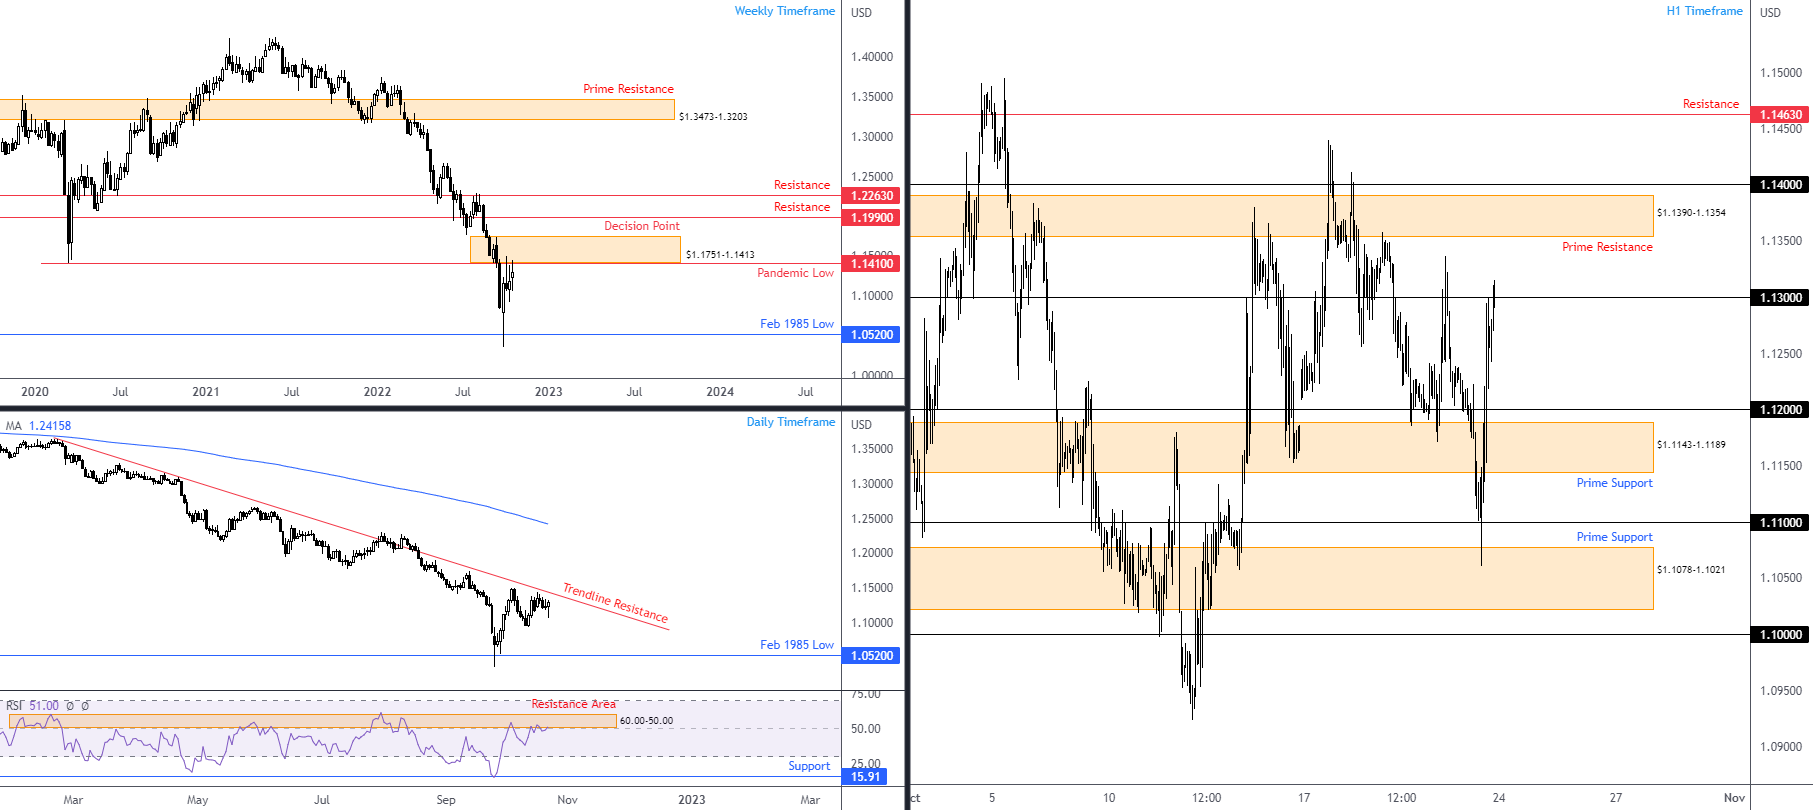
The weekly timeframe’s price action emphasises a bearish environment. At the forefront of the technical observations is the clear-cut bearish trend seen since topping at $1.4250 in June 2021. Furthermore, the monthly timeframe demonstrates that the overall long-term downtrend has been soft since late 2007 tops at $2.1161. I also drew attention to resistance at $1.1410 and neighbouring decision point at $1.1751-1.1413 in previous research, both of which have proved a critical juncture for the currency pair so far. Overhead, I continue to note trendline resistance, extended from the high $1.3643, joined by the relative strength index (RSI) resistance zone between 60.00 and 50.00, in place since February this year. Downside support on the bigger picture remains centred on the 1985 February low of $1.0520 and record low of $1.0355. Another clear observation from the daily timeframe is that October has largely been rangebound thus far, despite trading higher by 1.3% on the month.
Prime support on the H1 timeframe at $1.1078-1.1021 greeted the unit after price whipsawed under $1.11 heading into Friday’s US session. Follow-through buying materialised, pushing through $1.12 and testing the mettle of $1.13. Note that Friday’s recovery established another prime support marked at $1.1143-1.1189, which is somewhere short-term traders may view a rebound take place from should the area welcome a test this week. Above $1.13 is a prime resistance also to be aware of at $1.1390-1.1354, sheltered south of $1.14.
Technical Expectation:
The weekly and daily timeframe’s technical resistances, the 19-month downtrend and the daily RSI resistance suggests any upside efforts could be short-lived. As a result, a whipsaw above $1.13 on the H1 timeframe could take shape, action that might encourage sellers into the market from prime resistance at $1.1390-1.1354. Should this come to fruition, and we drive back under $1.13, prime support on the H1 timeframe may subsequently welcome price action at $1.1143-1.1189.
 DISCLAIMER:
The information contained in this material is intended for general advice only. It does not take into account your investment objectives, financial situation or particular needs. FP Markets has made every effort to ensure the accuracy of the information as at the date of publication. FP Markets does not give any warranty or representation as to the material. Examples included in this material are for illustrative purposes only. To the extent permitted by law, FP Markets and its employees shall not be liable for any loss or damage arising in any way (including by way of negligence) from or in connection with any information provided in or omitted from this material. Features of the FP Markets products including applicable fees and charges are outlined in the Product Disclosure Statements available from FP Markets website, www.fpmarkets.com and should be considered before deciding to deal in those products. Derivatives can be risky; losses can exceed your initial payment. FP Markets recommends that you seek independent advice. First Prudential Markets Pty Ltd trading as FP Markets ABN 16 112 600 281, Australian Financial Services License Number 286354.


 Access +10,000 financial
instruments
Access +10,000 financial
instruments