
Charts: Trading View
(Italics: Previous Analysis)
US Dollar Index:
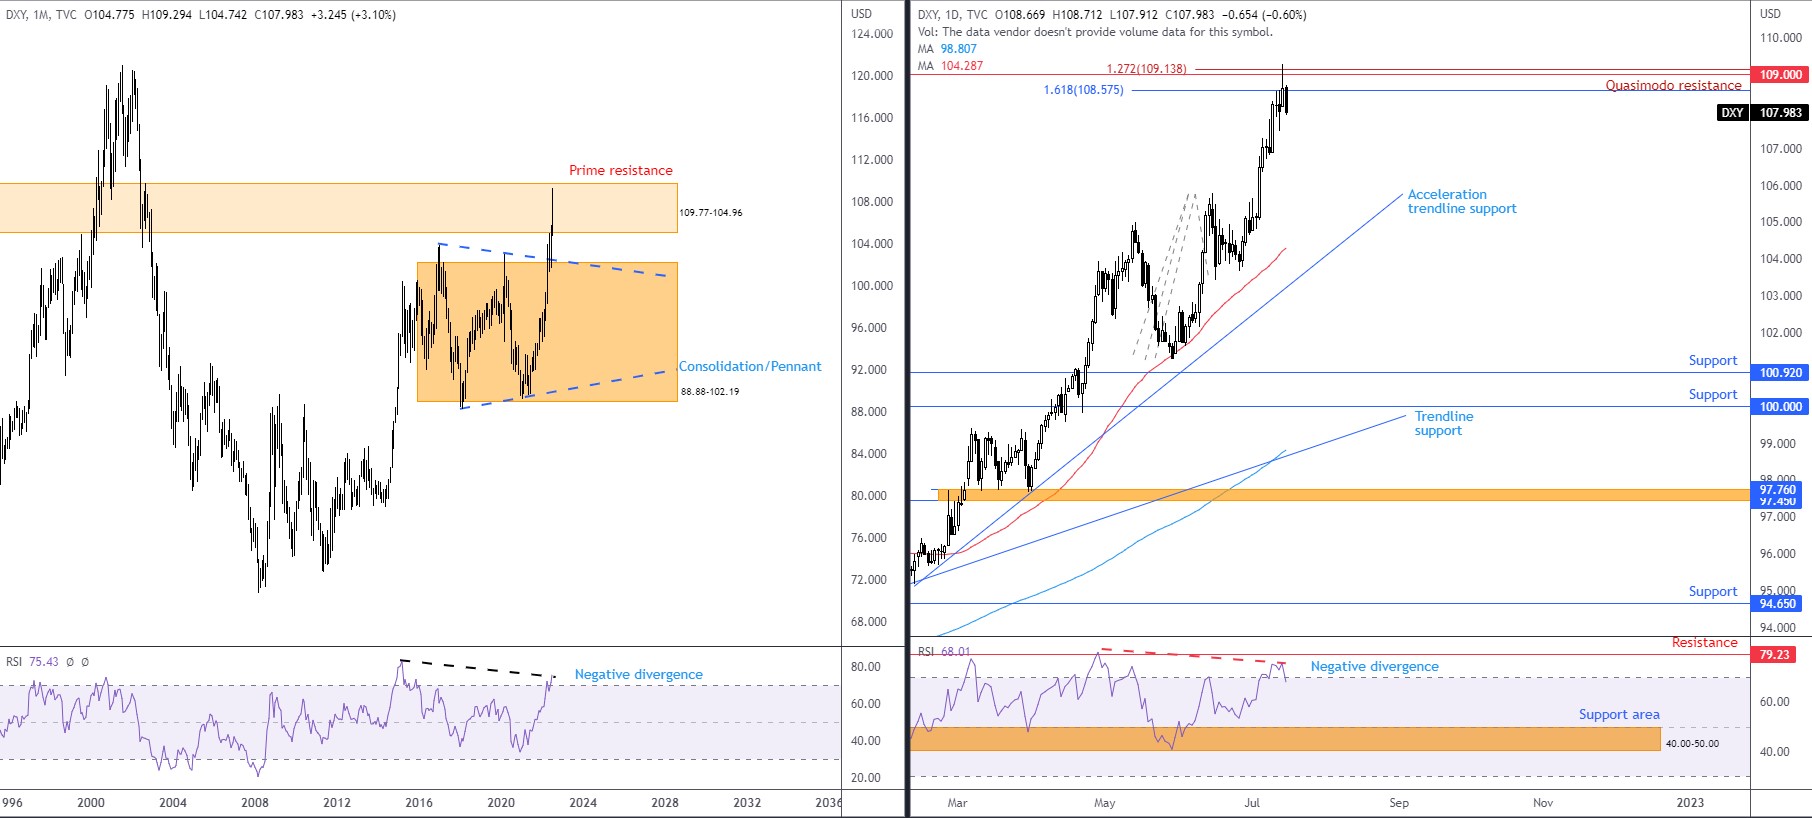
Against a basket of six international currencies, the heavyweight US dollar continued to outperform for a third consecutive week, adding 1.0 per cent and refreshing two-decade tops to 109.29. In what seems an unrelenting bid, momentum, however, appears to be subsiding. Displayed through the relative strength index (RSI) on the daily and weekly timeframes, the indicator is on the verge of chalking up negative divergence. In fact, daily flow has also exited overbought territory, further confirming that momentum to the upside may be losing steam.
Technical structure reinforces the prospect of a USD slowdown. The monthly timeframe remains within the walls of prime resistance at 109.77-104.96, together with the monthly timeframe’s RSI demonstrating early negative divergence within overbought status. Thus, potential negative divergence is realised on the monthly, weekly, and daily timeframes. Furthermore, on the daily timeframe, resistance structure recently made a show between 109.14 and 108.58, made up of a 1.272% Fibonacci projection, a 1.618% Fibonacci expansion, and a Quasimodo resistance level.
The question, however, is whether the noted resistances and RSI signals are enough to put the brakes on?
Trend studies remain unchanged on the daily chart and underpins additional buying. Direction on the daily timeframe has exhibited well-defined upward movement since price made contact with support from 89.69 in May 2021. The upside bias is also shown through the 50-day simple moving average (104.29) crossing above the 200-day simple moving average (trading at 98.81) in August 2021 (‘Golden Cross’). The uptrend garners additional support after breaking out of the upper limit of a near-six-year consolidation at 88.88-102.19 on the monthly timeframe, movement that led to price testing current monthly prime resistance.
Technical Expectation:
Technically, monthly prime resistance at 109.77-104.96, RSI negative divergences across the higher timeframes, and daily resistance between 109.14 and 108.58 could provoke a bearish development over the coming weeks/months.
The current uptrend, however, places a question mark on a bearish narrative. Any sellers in this market are likely to want to see decisive bearish movement before committing, possibly in the form of a topping pattern. Otherwise, a daily close north of 109.14 seats buyers in a favourable light and ultimately highlights a breakout bullish theme which undermines monthly prime resistance.
 EUR/USD:
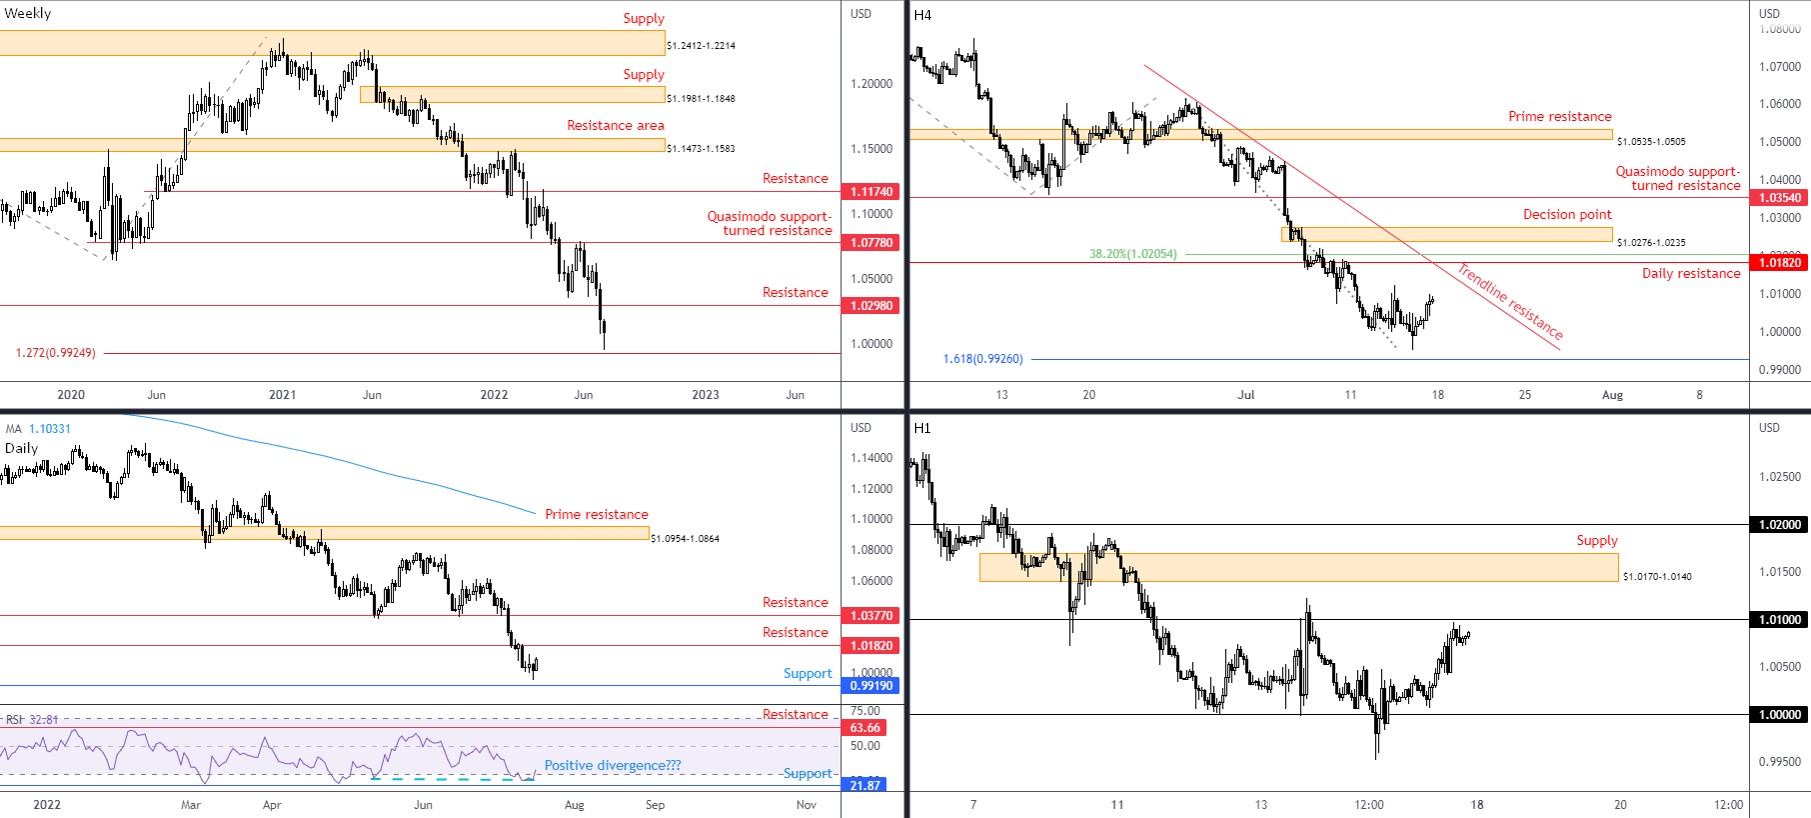
Offering up a third consecutive losing week—movement touching as far south as $0.9952 (lowest value since early December 2002), Europe’s single currency evidently remains on the ropes against its US counterpart.
Visible from the weekly timeframe, EUR/USD has been lower since the beginning of 2021. Establishing a series of lower lows and lower highs, the general direction in this market reflects a primary bear trend, with prolonged pullbacks (or sometimes referred to as ‘secondary trends’) in short supply. Additionally, the monthly timeframe has been to the downside since topping in April 2008. The three back-to-back weekly bearish candles witnessed recent movement absorb support at $1.0298, a level perhaps adopting the position of resistance in future trading. Weekly support in focus this week is the 1.272% Fibonacci projection from $0.9925.
Bonding closely with $0.9925 on the weekly timeframe is support on the daily timeframe at $0.9919. Overhead resistance calls for attention at $1.0182, closely followed by resistance at $1.0377 (nestled a touch above weekly resistance at $1.0298). Interestingly, while weekly and daily charts emphasise a decisive downtrend, the (daily) relative strength index (RSI) shows the indicator’s value penetrated oversold space and threw light on indicator support at 21.87. Another technical observation, of course, is early positive divergence. Though do be aware that this indicator can deliver a number of false reversal signals in trending environments.
Out of the H4 timeframe, price action left the 1.618% Fibonacci projection at $0.9926 unchallenged and launched an end-of-week recovery. The daily resistance highlighted above at $1.0182 is also key on the H4 chart, complemented by H4 trendline resistance, extended from the high $1.0606, and a 38.2% Fibonacci retracement ratio at $1.0205. The $1.0276-1.0235 decision point also remains a striking zone higher up, as the base formed prior to probing daily support at $1.0182. And given the area remains fresh (untested), it will likely draw attention if confronted this week.
A closer assessment of price action on the H1 timeframe displays that it’s really all about psychological levels right now, in particular parity ($1.00). An aggressive stop-run beneath parity unfolded on Thursday with enough force to instigate a ‘bear trap’. Subsequent action observed a recovery to within range of $1.01, a level recognised beneath supply at $1.0170-1.0140 (formed a handful of pips below daily resistance at $1.0182).
Technical Expectation:
I see substantial resistance on the bigger picture (weekly and daily timeframes) between $1.0377 and $1.0182. This—coupled with the distinct downtrend—sellers continue to have the upper hand, suggesting a test of the weekly timeframe’s $0.9925 Fibonacci support, joined by the daily support from $0.9919.
Short term, two possible scenarios are on the table, both of which align with the higher timeframe’s bearish vibe. First is a simple whipsaw above $1.01 on the H1 timeframe to supply $1.0170-1.0140; this could be sufficient to draw a bearish scene. Secondly, failure to garner resistance from the $1.01 region could see the daily resistance from $1.0182 prove a worthier ceiling for sellers, in light of the H4 confluence surrounding the level.
 AUD/USD:
Shaped by way of a ‘hammer’ candlestick formation, last week watched the weekly timeframe probe support between $0.6632 and $0.6764 (composed of a 100% Fibonacci projection, a price support, and a 50% retracement). Despite this market reflecting a downtrend since $0.8007 (22nd Feb high [2021]), the support area and bullish candlestick signal is likely to make some pay attention in the technical community.
Adding to the trend studies, here’s where I left off in the previous weekly technical insight (italics):
The monthly timeframe has portrayed a downtrend since August 2011, indicating the rally from the pandemic low of $0.5506 (March 2020) to a high of $0.8007 (February 2021) on the weekly timeframe is likely viewed as a deep pullback among chartists. Downside from the 2021 February top (an early primary bear trend), therefore, is potentially seen as a move to explore lower over the coming weeks/months.
Aiding weekly support is support on the daily timeframe at $0.6678; as you can see, price action came within a whisker of testing the noted level on Thursday. To the upside, $0.6901 is seen as a resistance level, a prior Quasimodo support base. Medium term, interested buyers are likely to want to view a daily close north of $0.6901 prior to committing. Another consideration buyers are likely to be aware of is the daily chart’s relative strength index (RSI): a move back above the 50.00 centreline would inform traders that average gains are exceeding average losses (positive momentum).
Lower on the curve, traders will acknowledge price action on the H4 timeframe closed above trendline resistance (taken from the high $0.7283) on Friday. This is a reasonably significant trendline and, therefore, should the currency pair occupy space above the descending line this week, this is considered favourable for buyers, targeting at least supply coming in at $0.6901-0.6862 (sharing chart space with daily Quasimodo support-turned resistance at $0.6901).
The H4 trendline resistance break, accompanied by the higher timeframes exhibiting space to climb, does not bode well for the H1 timeframe’s resistance zone between $0.6813 and $0.68 (forged from several Fibonacci ratios, a Quasimodo support-turned resistance, and the $0.68 psychological figure). Technically, any rejection of the aforementioned resistance is unlikely to surpass the H1 38.2% Fibonacci retracement at $0.6759.
Technical Expectation:
Although a clear downtrend is in force, weekly, daily and H4 technical structure hints at higher prices this week, at least until H4 supply from $0.6901-0.6862.
As a result, a move lower from H1 resistance between $0.6813 and $0.68 will likely be recognised as a dip-buying opportunity from the H1 38.2% Fibonacci retracement at $0.6759. Alternatively, failure to tempt sellers from H1 resistance could motivate a breakout above the said H1 resistance zone and open the door for breakout buyers to take aim at the current H4 supply base.
 USD/JPY:
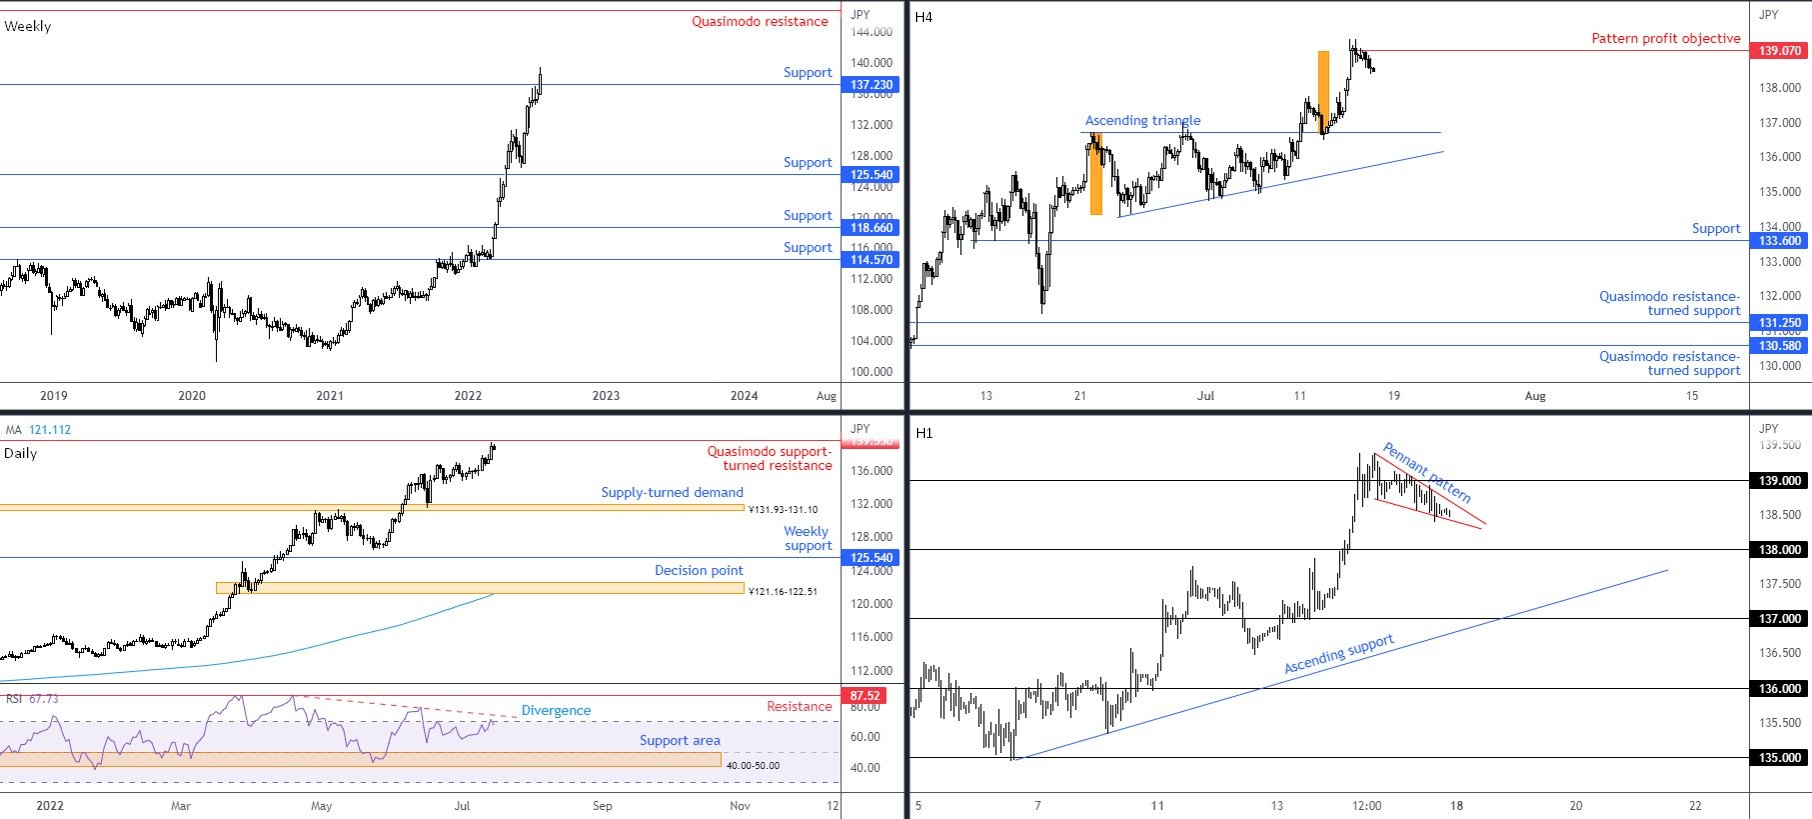
It was another upbeat week for the USD/JPY currency pair, booking a 1.8 per cent gain and refreshing highs to ¥139.39, levels not seen since September 1998. Needless to say, the primary bull trend remains in full swing. A conclusive break of resistance on the weekly timeframe at ¥137.23 also deserves notice, a level perhaps serving as support this week. What’s technically interesting is the breach possibly prepares the ground for further upside as limited resistance is seen until a Quasimodo formation at ¥146.79.
Meanwhile on the daily timeframe, Quasimodo support-turned resistance is seen at ¥139.55 which could hamper upside attempts. A close north of this barrier bodes well for current weekly breakout buyers north of ¥137.23. Another potential headwind for the currency pair, nevertheless, is the lack of momentum. According to the daily timeframe’s relative strength index (RSI), the popular momentum gauge has demonstrated reduced momentum since the indicator delivered negative divergence on 14th June. Indicator support between 40.00 and 50.00, therefore, is an obvious base to monitor this week, an area serving as a ‘temporary’ oversold zone since May 2021 (common in strongly trending environments). If further buying takes shape, however, indicator resistance is in sight at 87.52.
The H4 timeframe served pattern traders well last week, observing a retest of the upper boundary of a breached ascending triangle pattern (¥136.71 and ¥134.27) and a subsequent test of the pattern’s profit objective at ¥139.07 in the second half of the week. As evident from the chart, sellers have emerged from ¥139.07 by way of a pennant pattern on the H1 timeframe, between ¥139.38 and ¥138.71. This formation is typically viewed as a continuation pattern, therefore should a break to the upside occur, overthrowing ¥139 on the H1 and also ¥139.07 on the H4 might materialise, to target at least ¥139.55 on the daily scale.
Technical Expectation:
Having noted that ¥137.23 on the weekly timeframe could serve as support, in a market decisively trending higher, this indicates H1 price may form a breakout above its pennant pattern and close north of ¥139. In turn, this might attract additional buying to overrun ¥139.07 on the H4 to attack ¥139.55 on the daily. But ultimately, according to the weekly timeframe, there’s scope for considerably higher prices.
 GBP/USD:
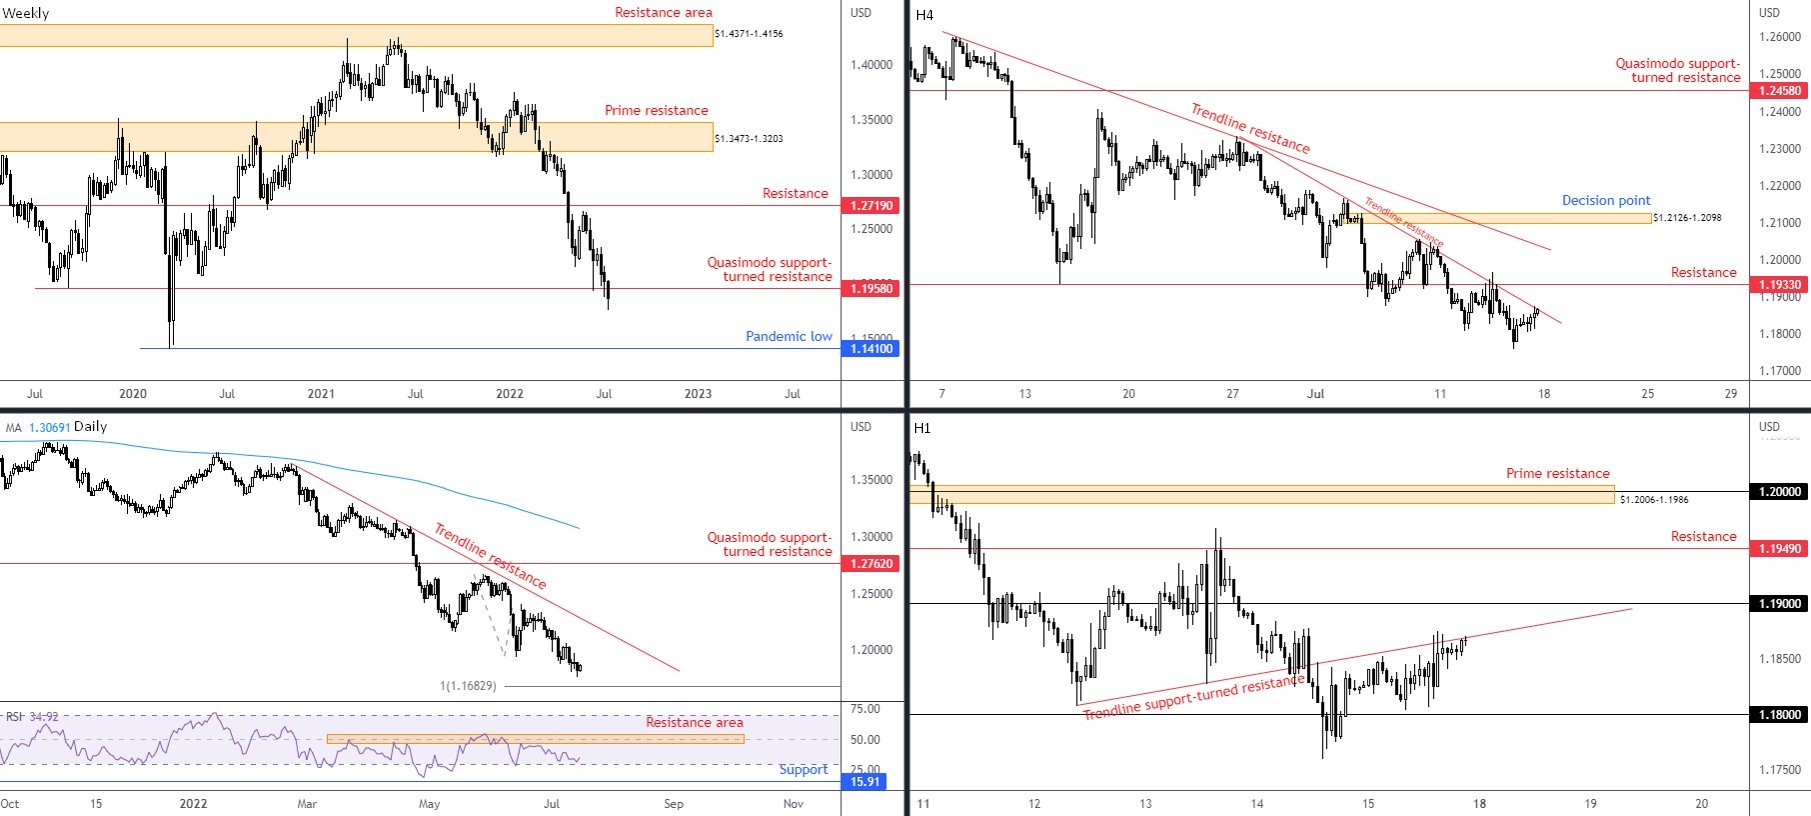
Sterling wrapped up another week lower versus the US dollar, erasing 1.3 per cent and taking on weekly Quasimodo support coming in from $1.1958. This is concerning for the pound; limited support is seen until the pandemic low of $1.1410. Couple this with the downtrend, and GBP/USD appears poised to navigate lower levels over the coming weeks/months.
Here’s where I left the previous weekly research in terms of trend direction (italics):
Trend direction has been unmistakably bearish since February/May’s double-top formation on the weekly timeframe at around $1.4241 (2021). Furthermore, seen through the monthly timeframe, the long-term downtrend has been soft since late 2007 tops at $2.1161.
From the daily timeframe, here’s where I currently stand:
Reduced support is evident until the 100% Fibonacci projection ratio at $1.1683. Overhead directs focus to trendline resistance, taken from the high $1.3639, and therefore could be a technical point we see sellers surface from in the event of a push higher this week. In conjunction with the weekly chart’s bearish vibe, the daily timeframe’s relative strength index (RSI) remains under its 50.00 centreline (negative momentum) and looks set to cross swords with oversold territory.
Addressing the H4 timeframe, local trendline resistance, taken from the high $1.2332, was tested into the close. Above here, resistance from $1.1933 is seen, shadowed by another trendline resistance, drawn from the high $1.2599, and then a decision point from $1.2126-1.2098. Note that it was the local descending line, alongside resistance at $1.1933, which capped upside on Wednesday last week.
Finally, from the H1 timeframe, the unit attempted to cross beneath $1.18 but failed to find grip south of the number and ended the week reconnecting with a trendline support-turned resistance, drawn from the low $1.1807. You will note that this H1 trendline resistance also shares chart space with the H4 timeframe’s local trendline resistance. Area above here is directed to $1.19 and resistance from $1.1949.
Technical Expectation:
Longer-term technical studies show weekly Quasimodo support at $1.1958 has likely been overthrown. Follow-through downside tips the currency pair in favour of testing at least the daily timeframe’s 100% Fibonacci projection at $1.1683, in line with the current downtrend.
Short term, consistent with the bigger picture, the current H1 and H4 trendline resistances intersecting may provide enough technical evidence to attract sellers early in the trading week. Failure to do so could mean a test of the area between H4 resistance at $1.1933 and the $1.19 figure on the H1.
 DISCLAIMER:
The information contained in this material is intended for general advice only. It does not take into account your investment objectives, financial situation or particular needs. FP Markets has made every effort to ensure the accuracy of the information as at the date of publication. FP Markets does not give any warranty or representation as to the material. Examples included in this material are for illustrative purposes only. To the extent permitted by law, FP Markets and its employees shall not be liable for any loss or damage arising in any way (including by way of negligence) from or in connection with any information provided in or omitted from this material. Features of the FP Markets products including applicable fees and charges are outlined in the Product Disclosure Statements available from FP Markets website, www.fpmarkets.com and should be considered before deciding to deal in those products. Derivatives can be risky; losses can exceed your initial payment. FP Markets recommends that you seek independent advice. First Prudential Markets Pty Ltd trading as FP Markets ABN 16 112 600 281, Australian Financial Services License Number 286354.


 Access +10,000 financial
instruments
Access +10,000 financial
instruments